This package was built by Cara Thompson for Dr Claire Meek and her colleagues working on the Ophelia study, to streamline the process of getting from data to clear and compelling visualisations. It currently includes guidance on colours and fonts, and functions which can be added to any ggplot to bring it inline with the Ophelia aesthetics.
Installing the package
This package is stored in a private repo on GitHub. Anyone who has been given the authorisation key can install it as follows:
# If you haven't already installed the {remotes} package, run:
install.packages("remotes")

# Then run:
remotes::install_github("cararthompson/ophelia", auth_token = "the-secret-authorisation-token")
The building blocks
Assets
The package includes assets any collaborators may need, such as the fonts used in the plots and tables, and the Ophelia logo. Once the package is installed, these can be located on your device by using:
system.file("assets/logo.png", package = "ophelia")
system.file("assets/fonts", package = "ophelia")
This is useful for finding the fonts that need to be installed on your device. Please install the fonts before using this package. If you aren’t sure whether the fonts are already installed, use sytemfonts::system_fonts() |> View() and search for them in the resulting dataframe. If you can’t see them there, locate the font files on your device using the system.file() call above, then install them as you would any other font (on Windows, right click on the file and then select “install for all users”). Once you’ve done that, close R Studio, restart, and you should now be able to see in the fonts dataframe (sytemfonts::system_fonts() |> View()) and use the fonts in your plots and tables.
Fonts
Speaking of fonts, the recommended fonts across Ophelia outputs are:
- Nunito Sans for most text
- Crimson Pro for headings, where you want to add something a bit different
The plot and table functions below allow you to change to a different font if the publication you are creating a table or visualisation for requests that. See documentation for how to use the font arguments.
Colors
The anchor colours build on the gold color in the logo, with inspiration from Leon Morrocco’s painting Untitled - Jean resting.

From these colors, we derived a number of additional colors which are combined below to form the Ophelia palettes.
#>  [1] "dark_text"   "light_text"  "background"  "deep_purple" "dark_red"
#>  [6] "purple"      "gold"        "pink"        "light_blue"  "dark_green"
#> [11] "na_value"    "grid_lines"  "background"  "bright_gold" "pale_green"
#> [16] "pale_purple" "pale_pink"
monochromeR::view_palette(ophelia_colours, view_labels = FALSE)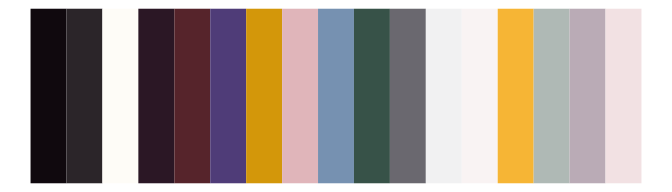
The hex code corresponding to individual colors can be retrieved as follows, for stand-alone use in plots and elsewhere:
ophelia_colours$purple
ophelia_colours$goldPalettes
The anchor colors above are combined to create a set of palettes which all fit the Ophelia aesthetic. To make the most of color symbolism, we created a green/red combination to signal positive/negative, and a palette based on the colors associated with US politics. The scale_color_ti() and scale_fill_ti() functions make use of ggplot functions to interpolate between the colours in each palette. Each palette can therefore be made to accommodate any number of colors (within reason!).


Examples of Ophelia-themed plots
Plots
The plots below all make use of the bespoke color and theme functions in this package, which are detailed below as part of the package documentation.
library(ggplot2)

palmerpenguins::penguins |>
  ggplot() +
  geom_point(aes(x = bill_length_mm,
                 y = flipper_length_mm,
                 size = body_mass_g,
                 fill = body_mass_g),
             shape = 21,
             color = ophelia_colours$background) +
  labs(title = "Perfectly proportional penguins",
       subtitle = "Lorem ipsum dolor sit amet, consectetur adipiscing elit, sed do eiusmod tempor incididunt ut labore et dolore magna aliqua. Ut enim ad minim veniam, quis nostrud exercitation ullamco laboris nisi ut aliquip ex ea commodo consequat.",
       x = "Bill length (mm)",
       y = "Flipper length (mm)",
       fill = "Body mass (g)",
       caption = "Demo plot, built with {palmerpenguins}") +
  guides(size = "none") +
  scale_fill_ophelia(continuous = TRUE) +
  theme_ophelia()
palmerpenguins::penguins |>
  ggplot() +
  geom_point(aes(x = bill_length_mm,
                 y = flipper_length_mm,
                 size = body_mass_g,
                 color = species),
             alpha = 0.8) +
  labs(title = "Perfectly proportional penguins",
       subtitle = "Look at them go!",
       x = "Bill length (mm)",
       y = "Flipper length (mm)",
       caption = "Demo plot, built with {palmerpenguins}") +
  scale_colour_ophelia(palette = "warm_colours",
                 continuous = FALSE) +
  theme_ophelia(background = FALSE) +
  theme(legend.position = "none")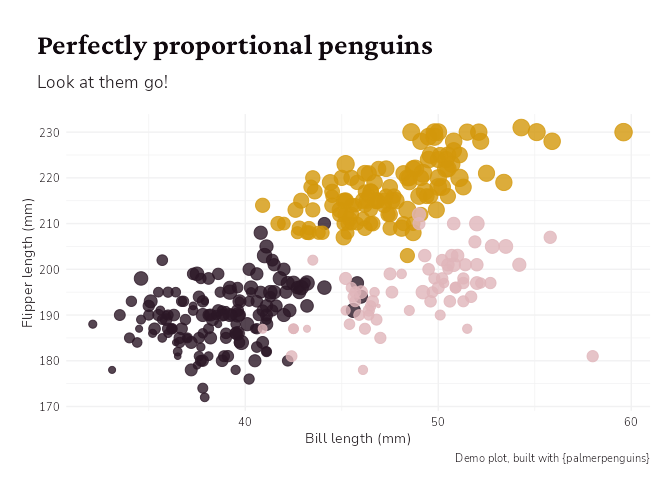
palmerpenguins::penguins |>
  ggplot() +
  geom_point(aes(x = bill_length_mm,
                 y = flipper_length_mm,
                 size = body_mass_g,
                 fill = species),
             shape = 21,
             color = ophelia_colours$background) +
  labs(title = "Perfectly proportional penguins",
       subtitle = "Look at them go!",
  ) +
  scale_fill_ophelia(palette = "cool_colours",
                continuous = FALSE) +
  geom_smooth(aes(x = bill_length_mm,
                  y = flipper_length_mm),
              color = ophelia_colours$gold,
              fill = ophelia_colours$gold) +
  guides(size = "none") +
  theme_ophelia()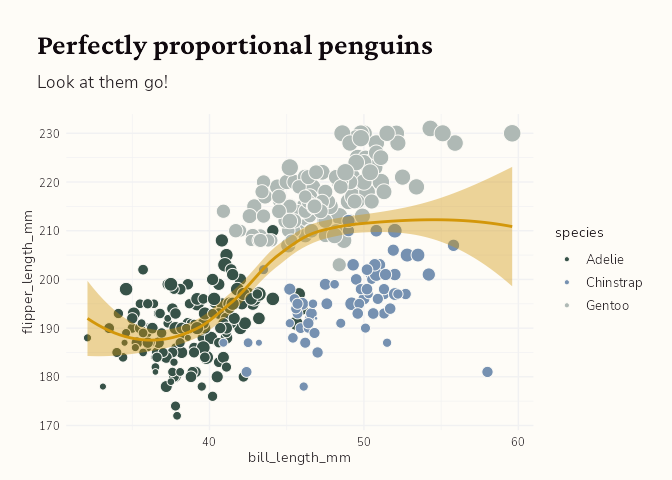
palmerpenguins::penguins |>
  ggplot(aes(x = 1,
             fill = species),
         stat = "count") +
  geom_bar() +
  xlim(c(-0.5, 2)) +
  coord_polar(theta = "y") +
  labs(title = "Perfectly proportional penguins",
       subtitle = "Does anyone know if penguins like donuts?",
       caption = "Data from {palmerpenguins}") +
  theme(legend.position = "right") +
  scale_fill_ophelia(palette = "warm_colours") +
  theme_ophelia(void = TRUE,
           background = FALSE) +
  theme(plot.title = ggtext::element_markdown(hjust = 0.5),
        plot.subtitle = ggtext::element_textbox_simple(halign = 0.5, vjust = 1),
        legend.position = "bottom")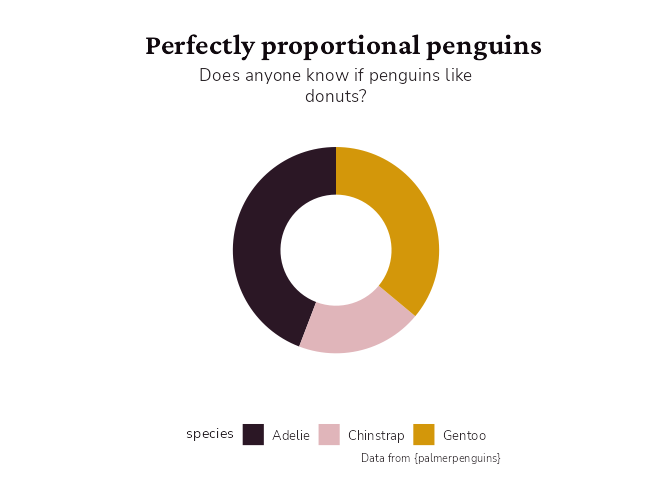
The functions
The documentation for all the functions contained within the package can be access via the Reference section of this site.