

Dynamic annotations
Shiny In Production | 13th October 2023
10 tips for making text better
- Using
{bakeoff}by Alison Presmanes Hill - Namespacing
package::function("blah")
- Choose your own pipe
- I like the old one
- All the code and slides available on my talks page
hello@cararthompson.com
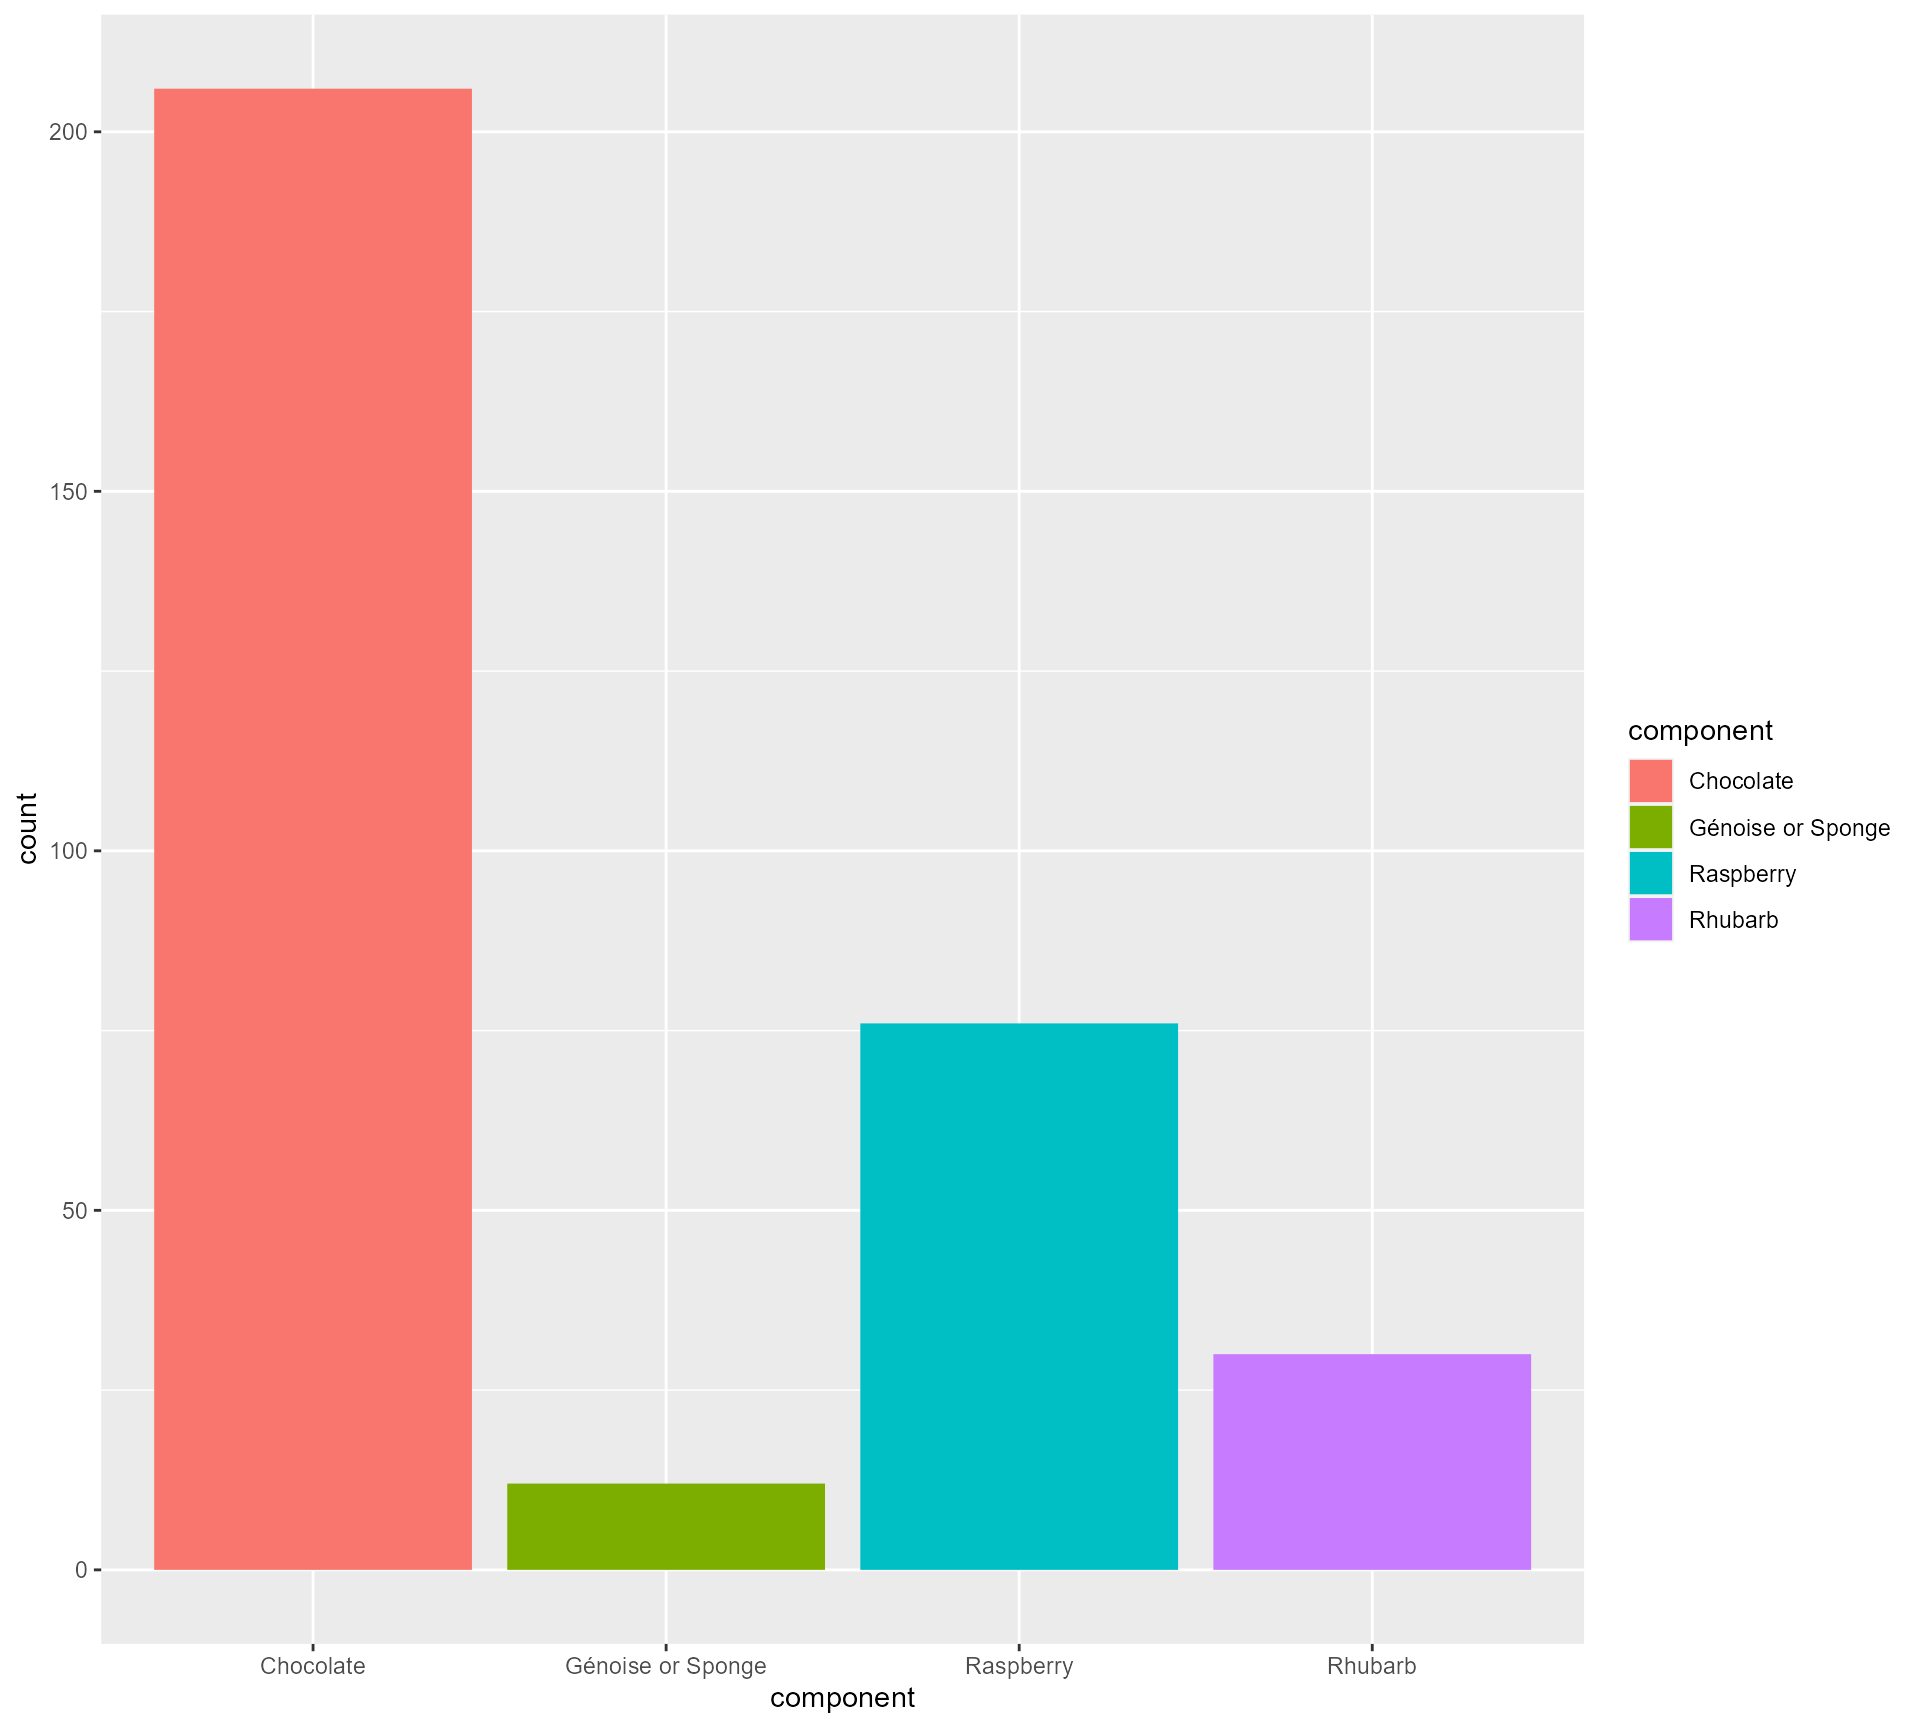
Our starting point
A plot!
Our starting point
Mini tip - theme_minimal()!
Our starting point
Let’s add a bit of text…
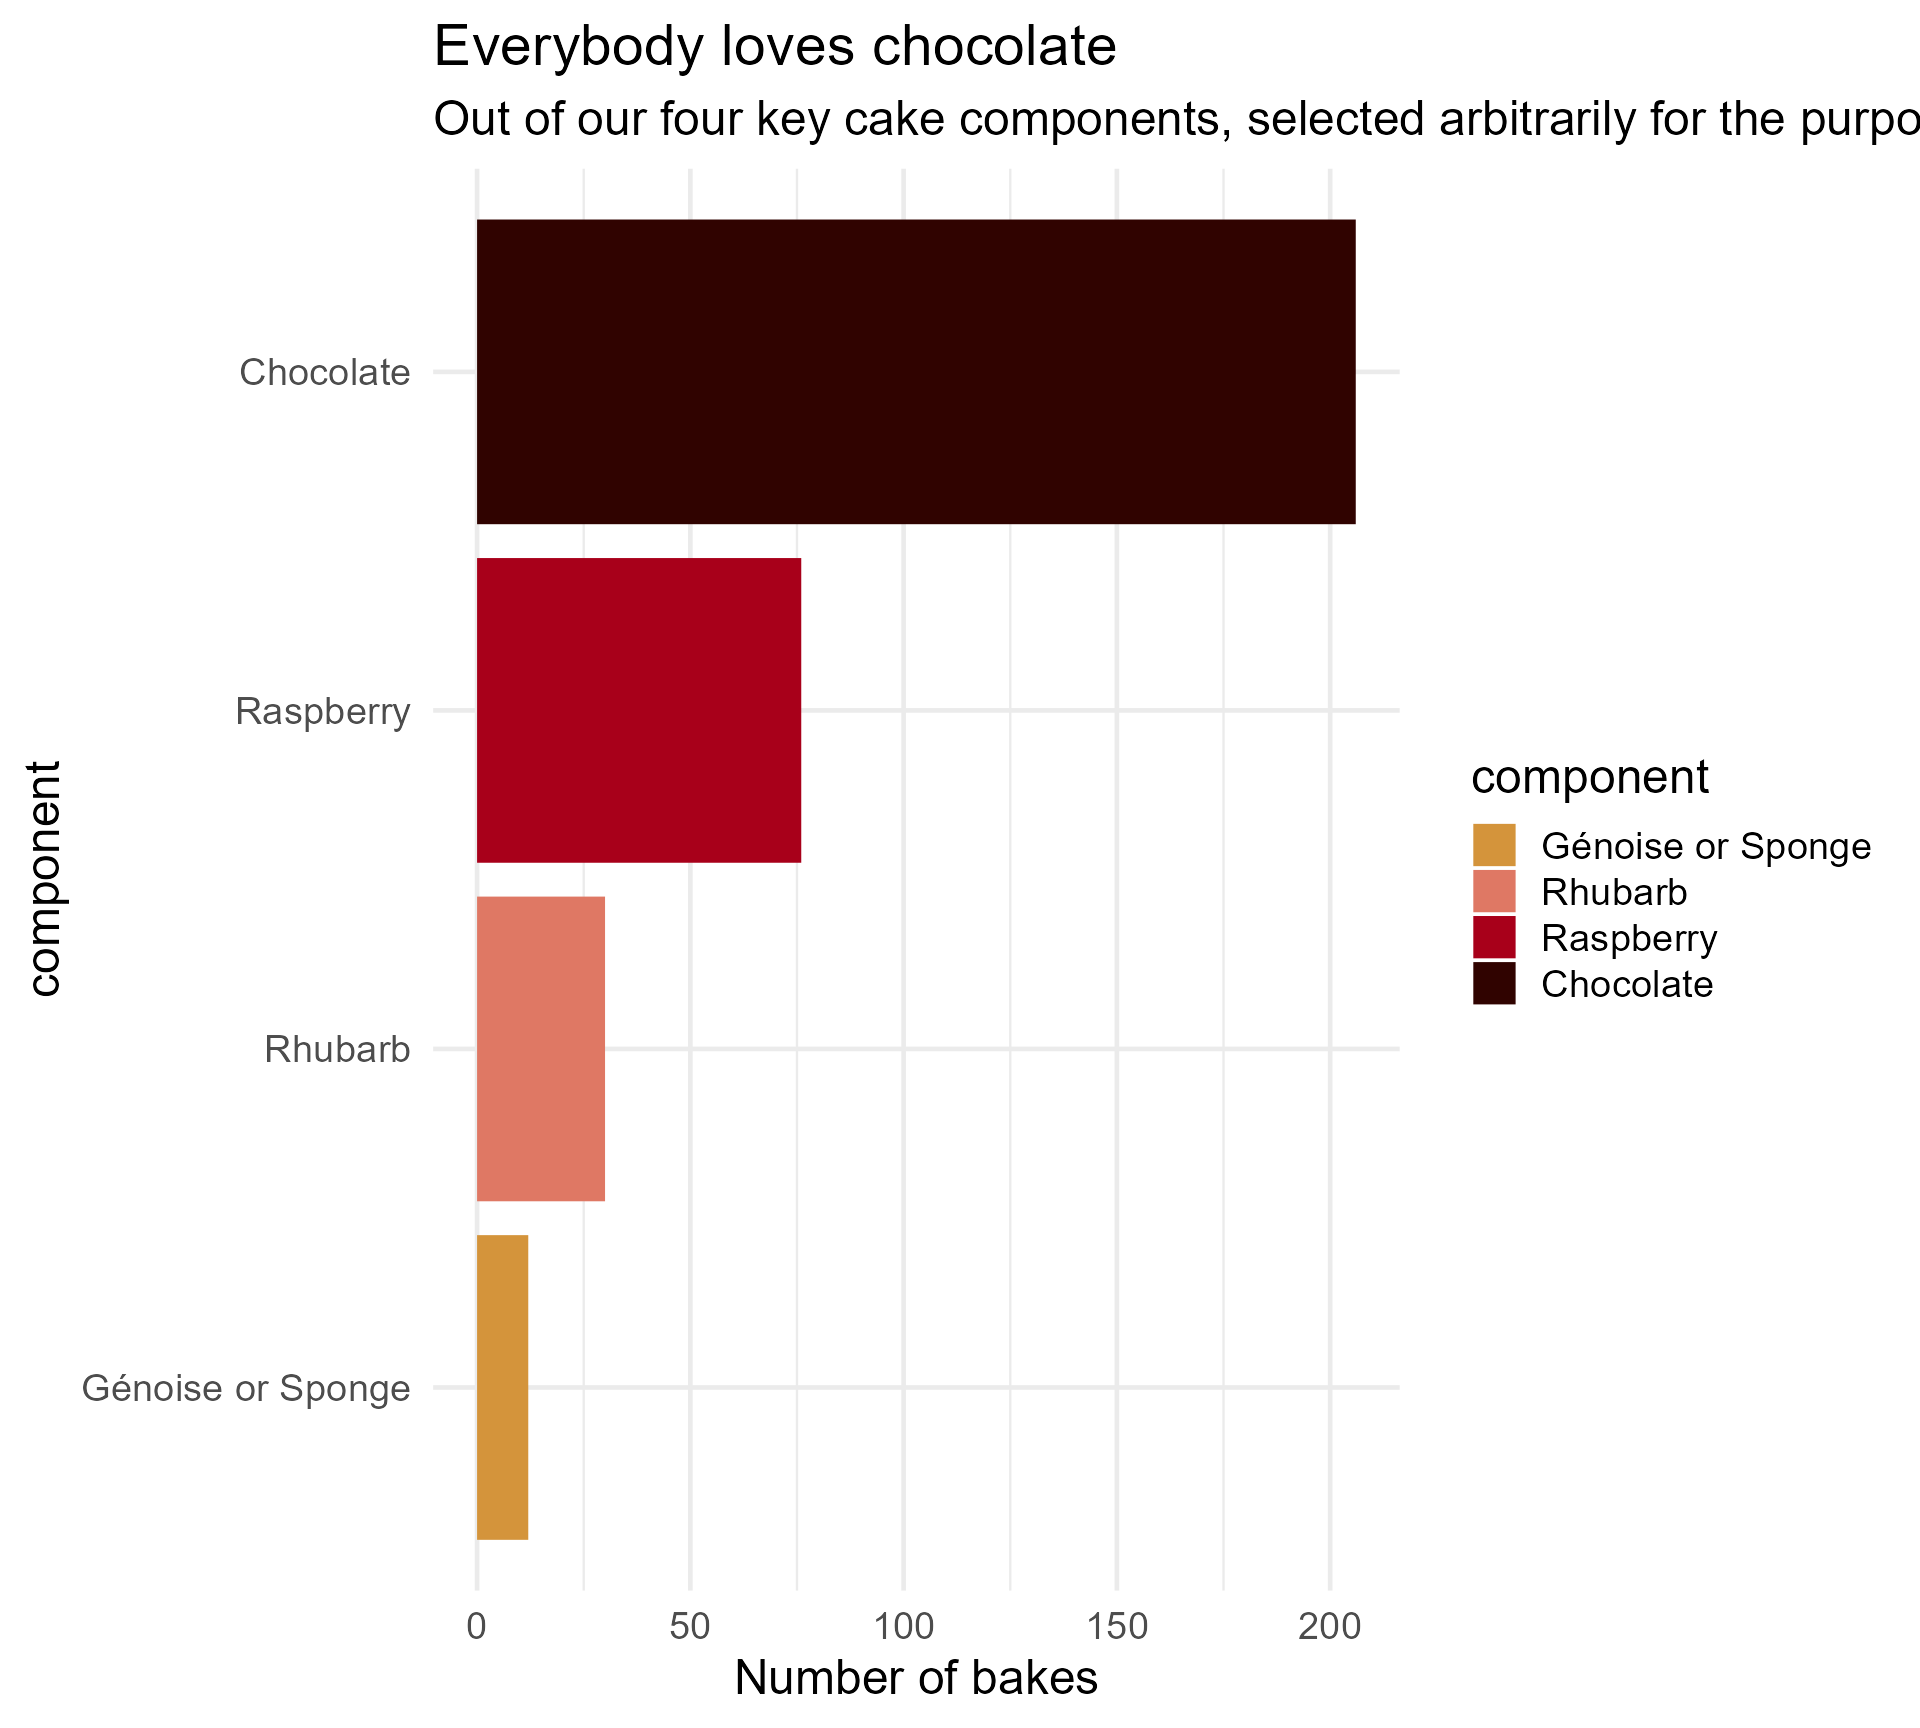
key_components %>%
ggplot(aes(x = component,
y = count,
fill = component)) +
geom_bar(stat = "identity") +
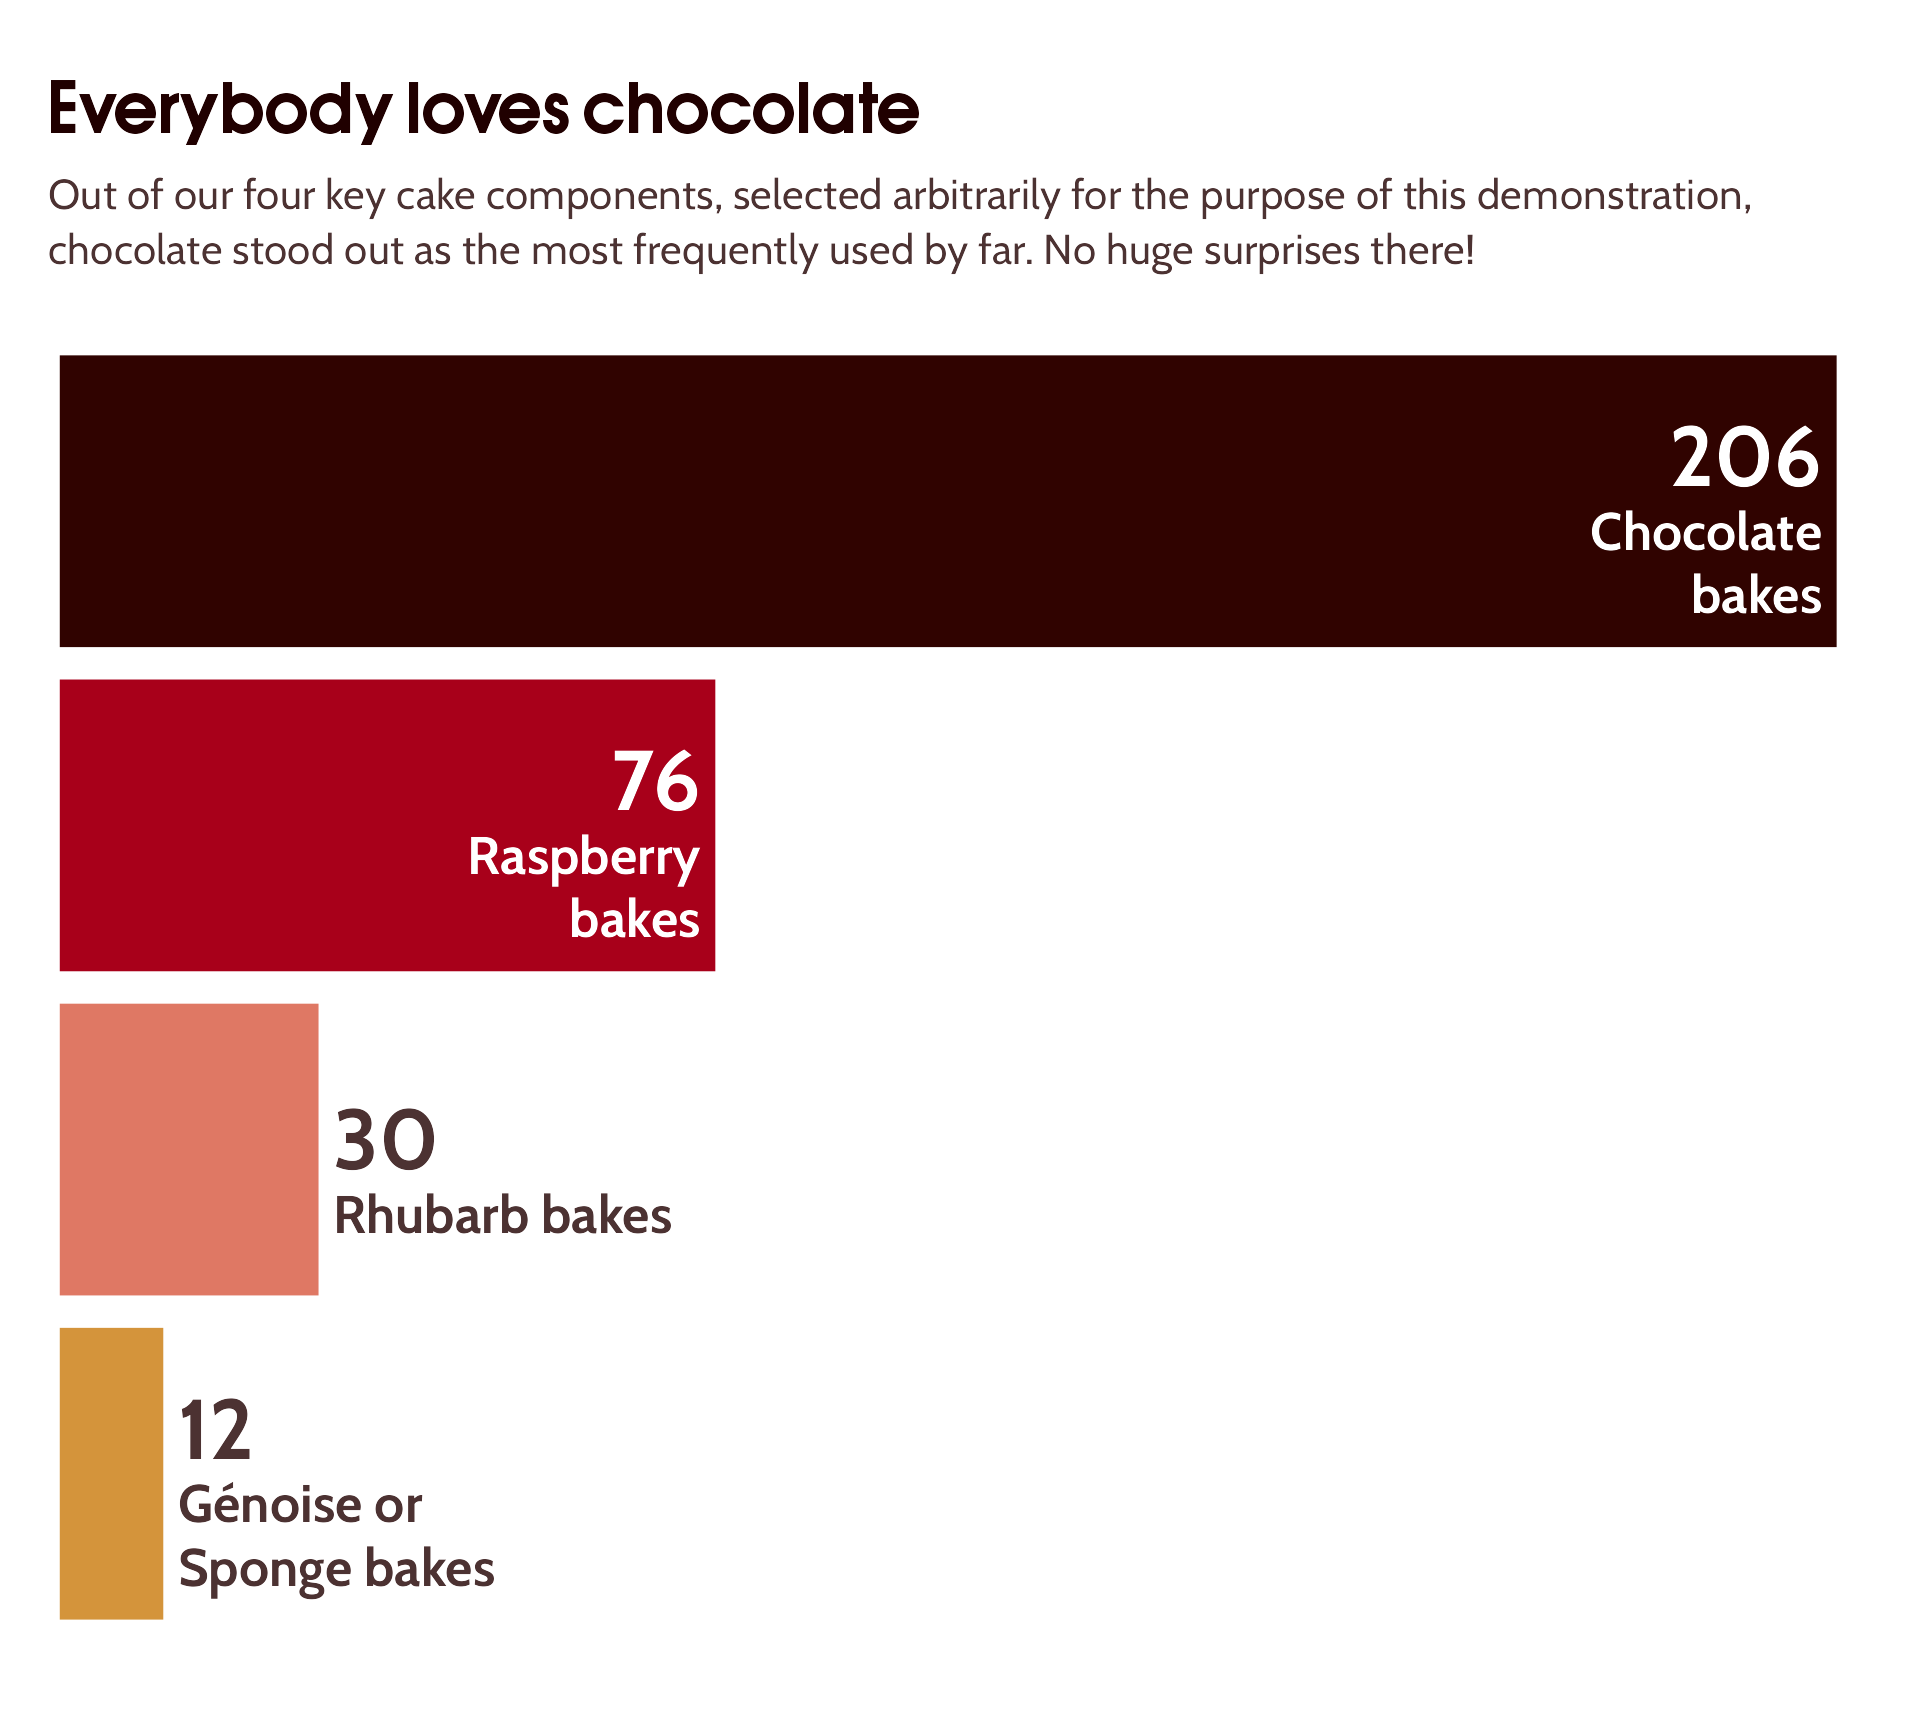
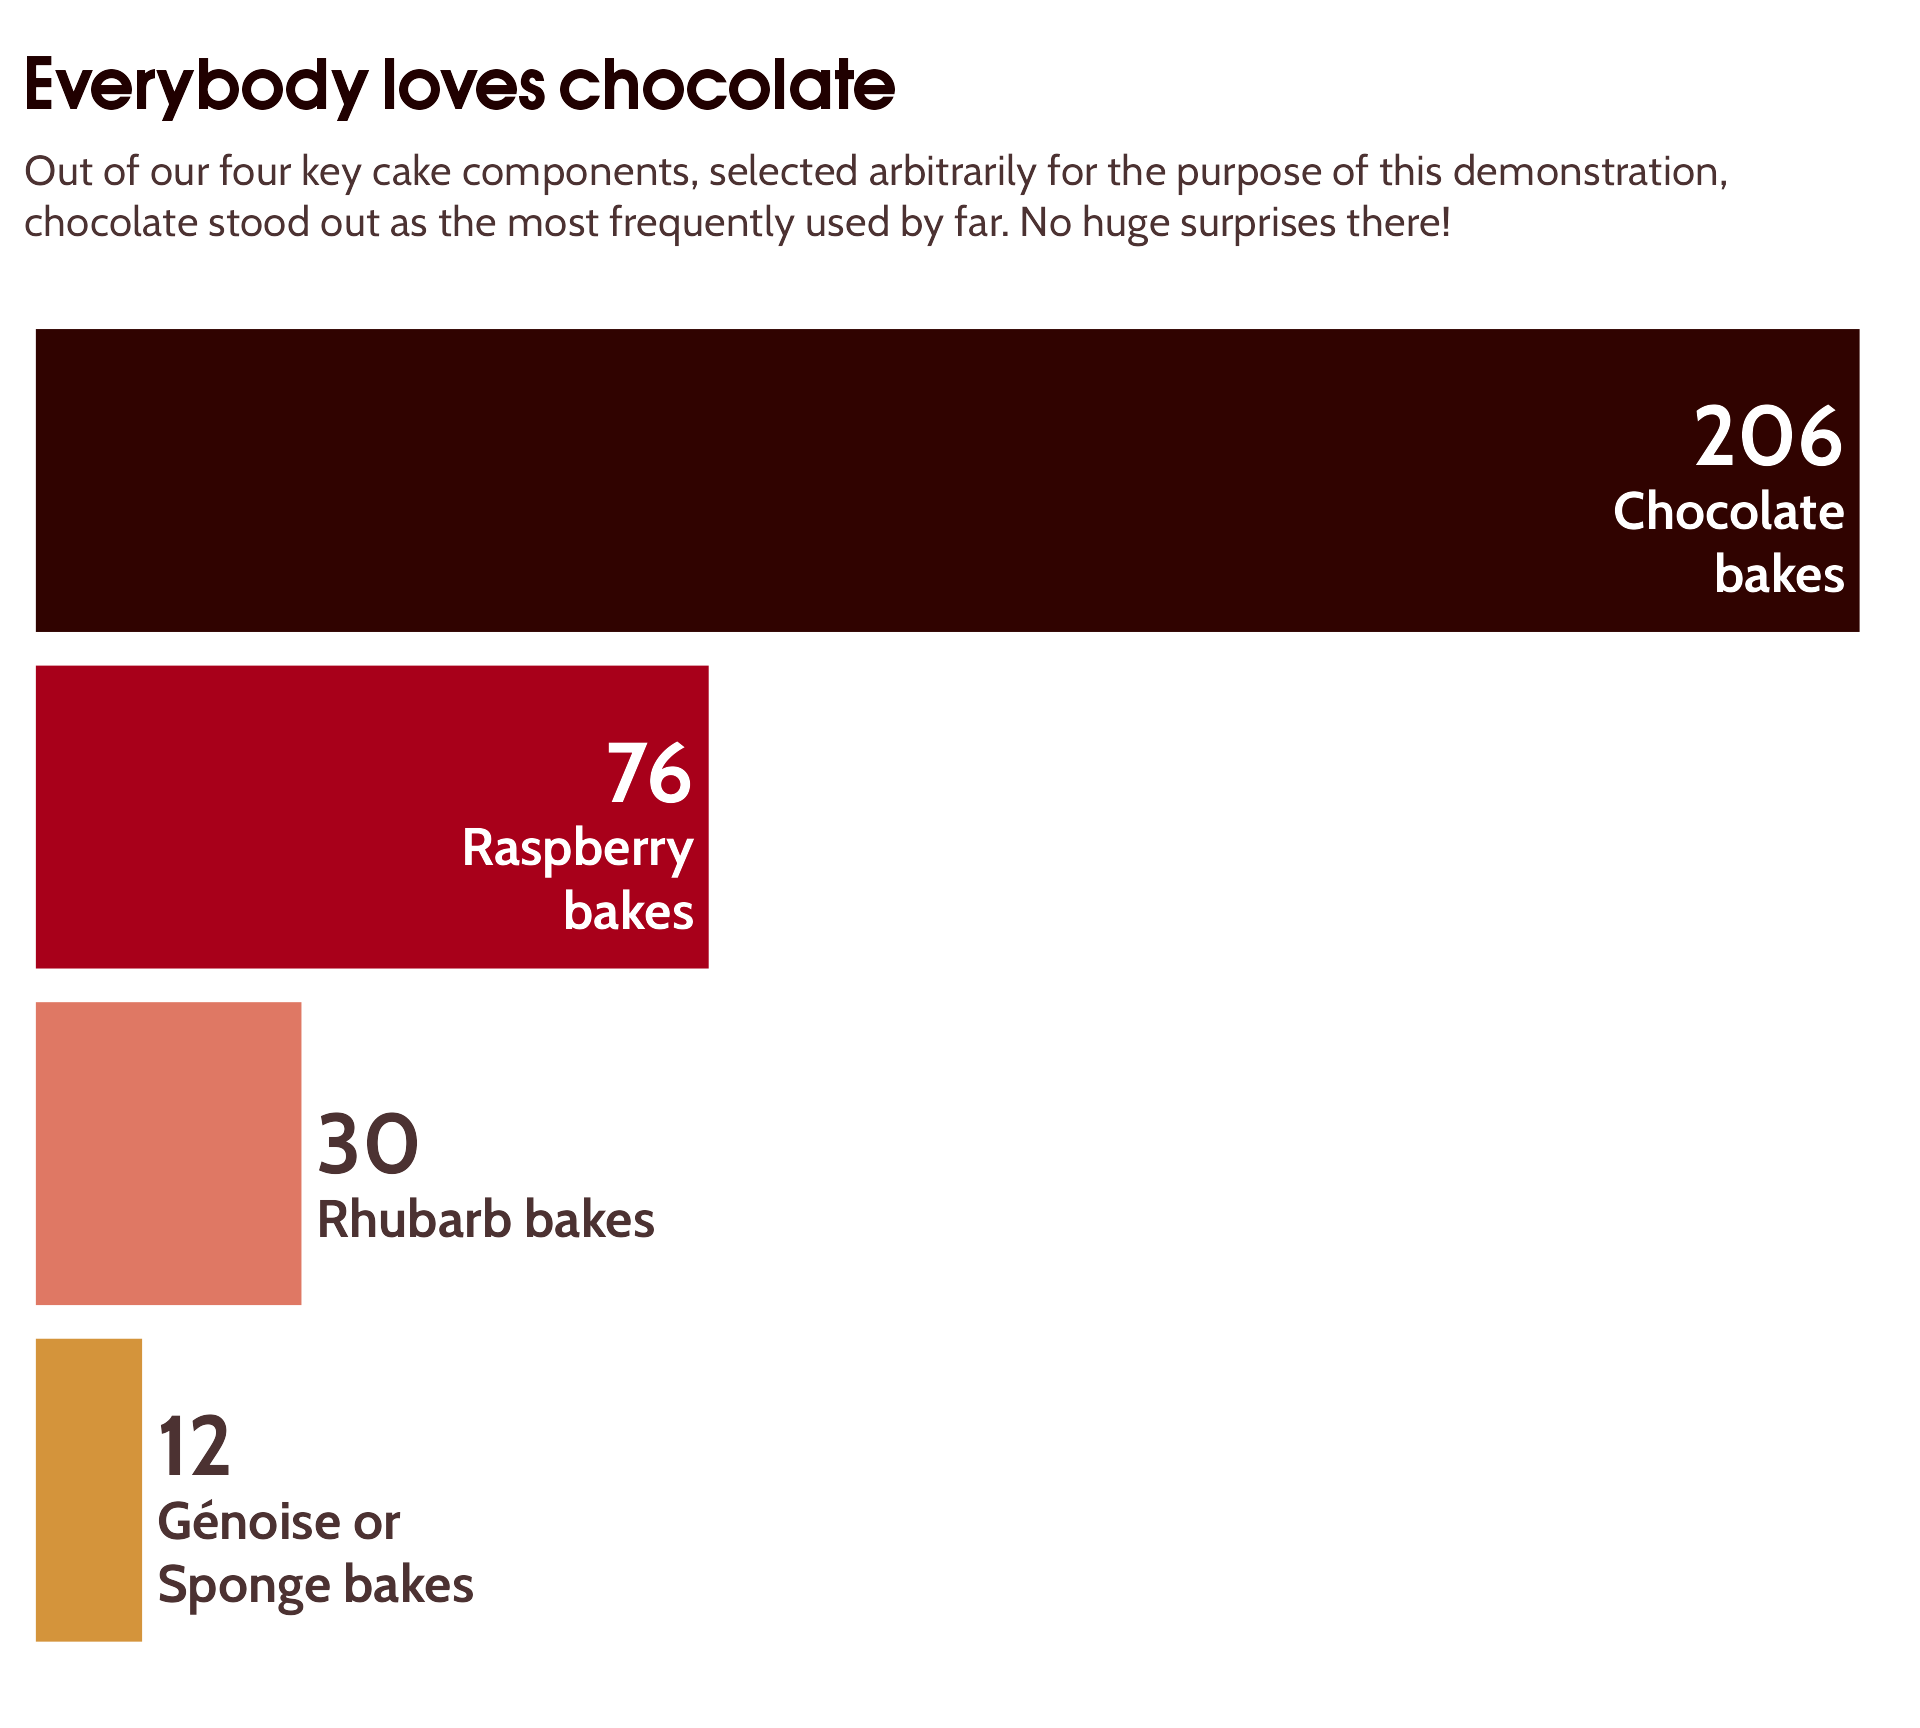
labs(title = "Everybody loves chocolate",
subtitle = "Out of our four key cake components, selected arbitrarily for the purpose of this demonstration, chocolate stood out as the most frequently used by far. No huge surprises there!") +
theme_minimal() 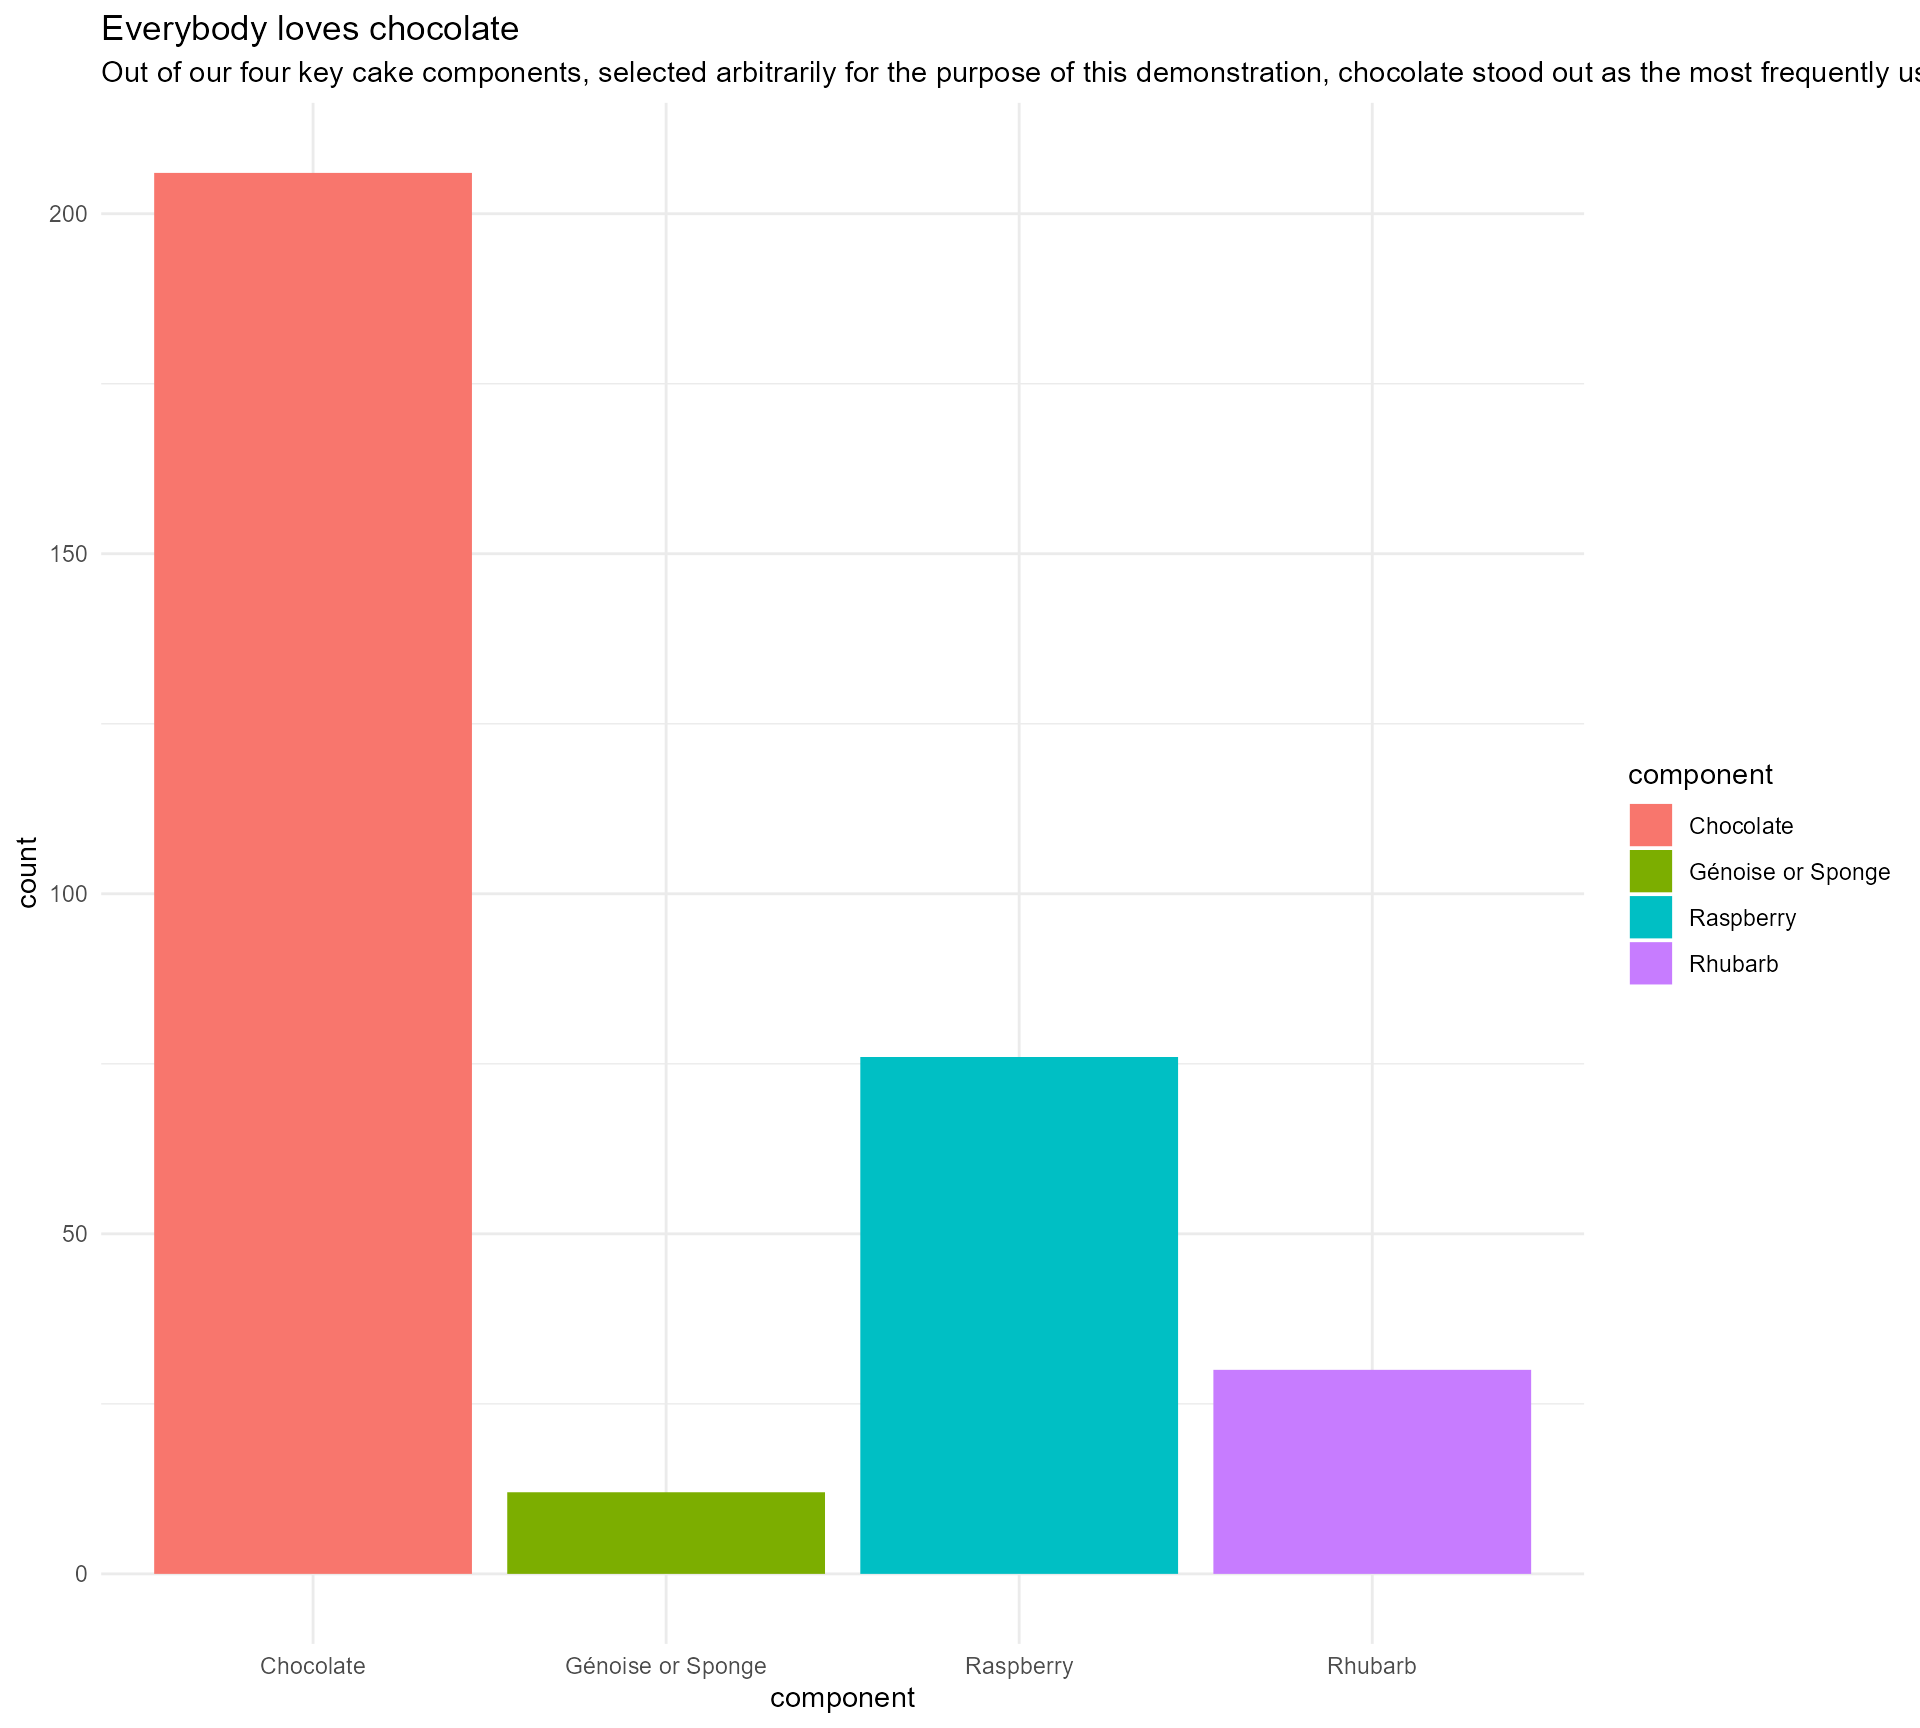
Our starting point
Let’s add a bit of text…
key_components %>%
ggplot(aes(x = component,
y = count,
fill = component)) +
geom_bar(stat = "identity") +
labs(title = "Everybody loves chocolate",
subtitle = "Out of our four key cake components, selected arbitrarily for the purpose of this demonstration, chocolate stood out as the most frequently used by far. No huge surprises there!") +
theme_minimal(base_size = 18) 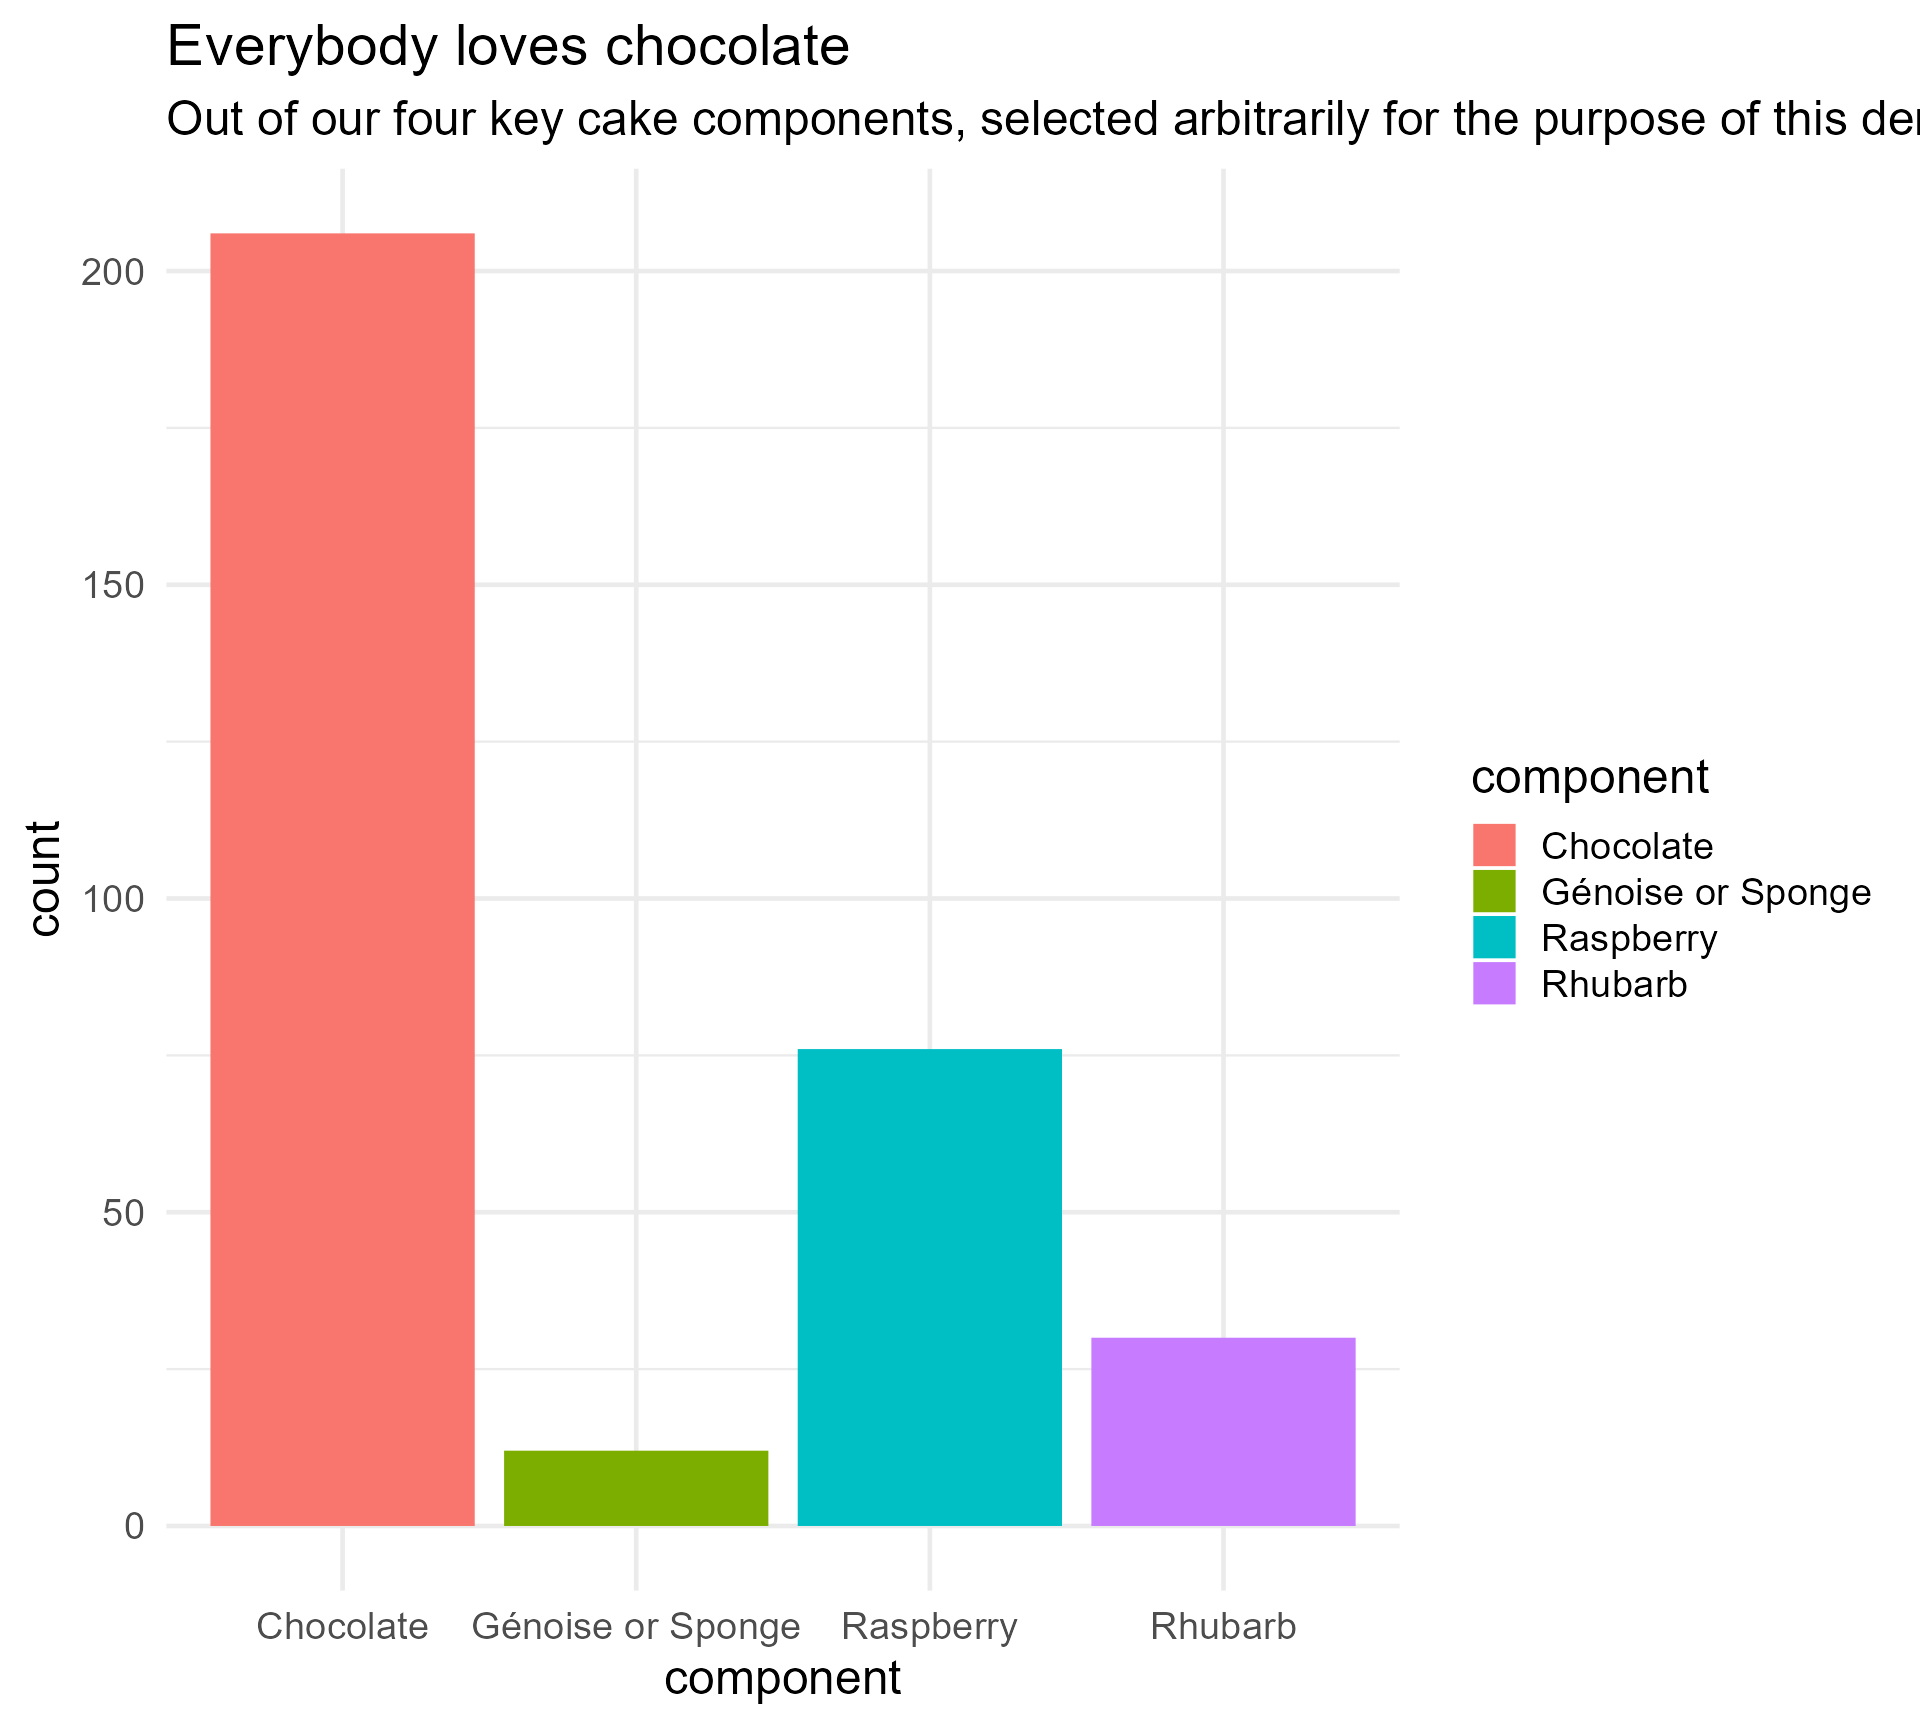
Our starting point
Mini tip! Get the bars in order
key_components %>%
arrange(count) %>%
mutate(component = factor(component,
levels = component)) %>%
ggplot(aes(x = component,
y = count,
fill = component,
colour = component)) +
geom_bar(stat = "identity") +
labs(title = "Everybody loves chocolate",
subtitle = "Out of our four key cake components, selected arbitrarily for the purpose of this demonstration, chocolate stood out as the most frequently used by far. No huge surprises there!") +
theme_minimal(base_size = 18) 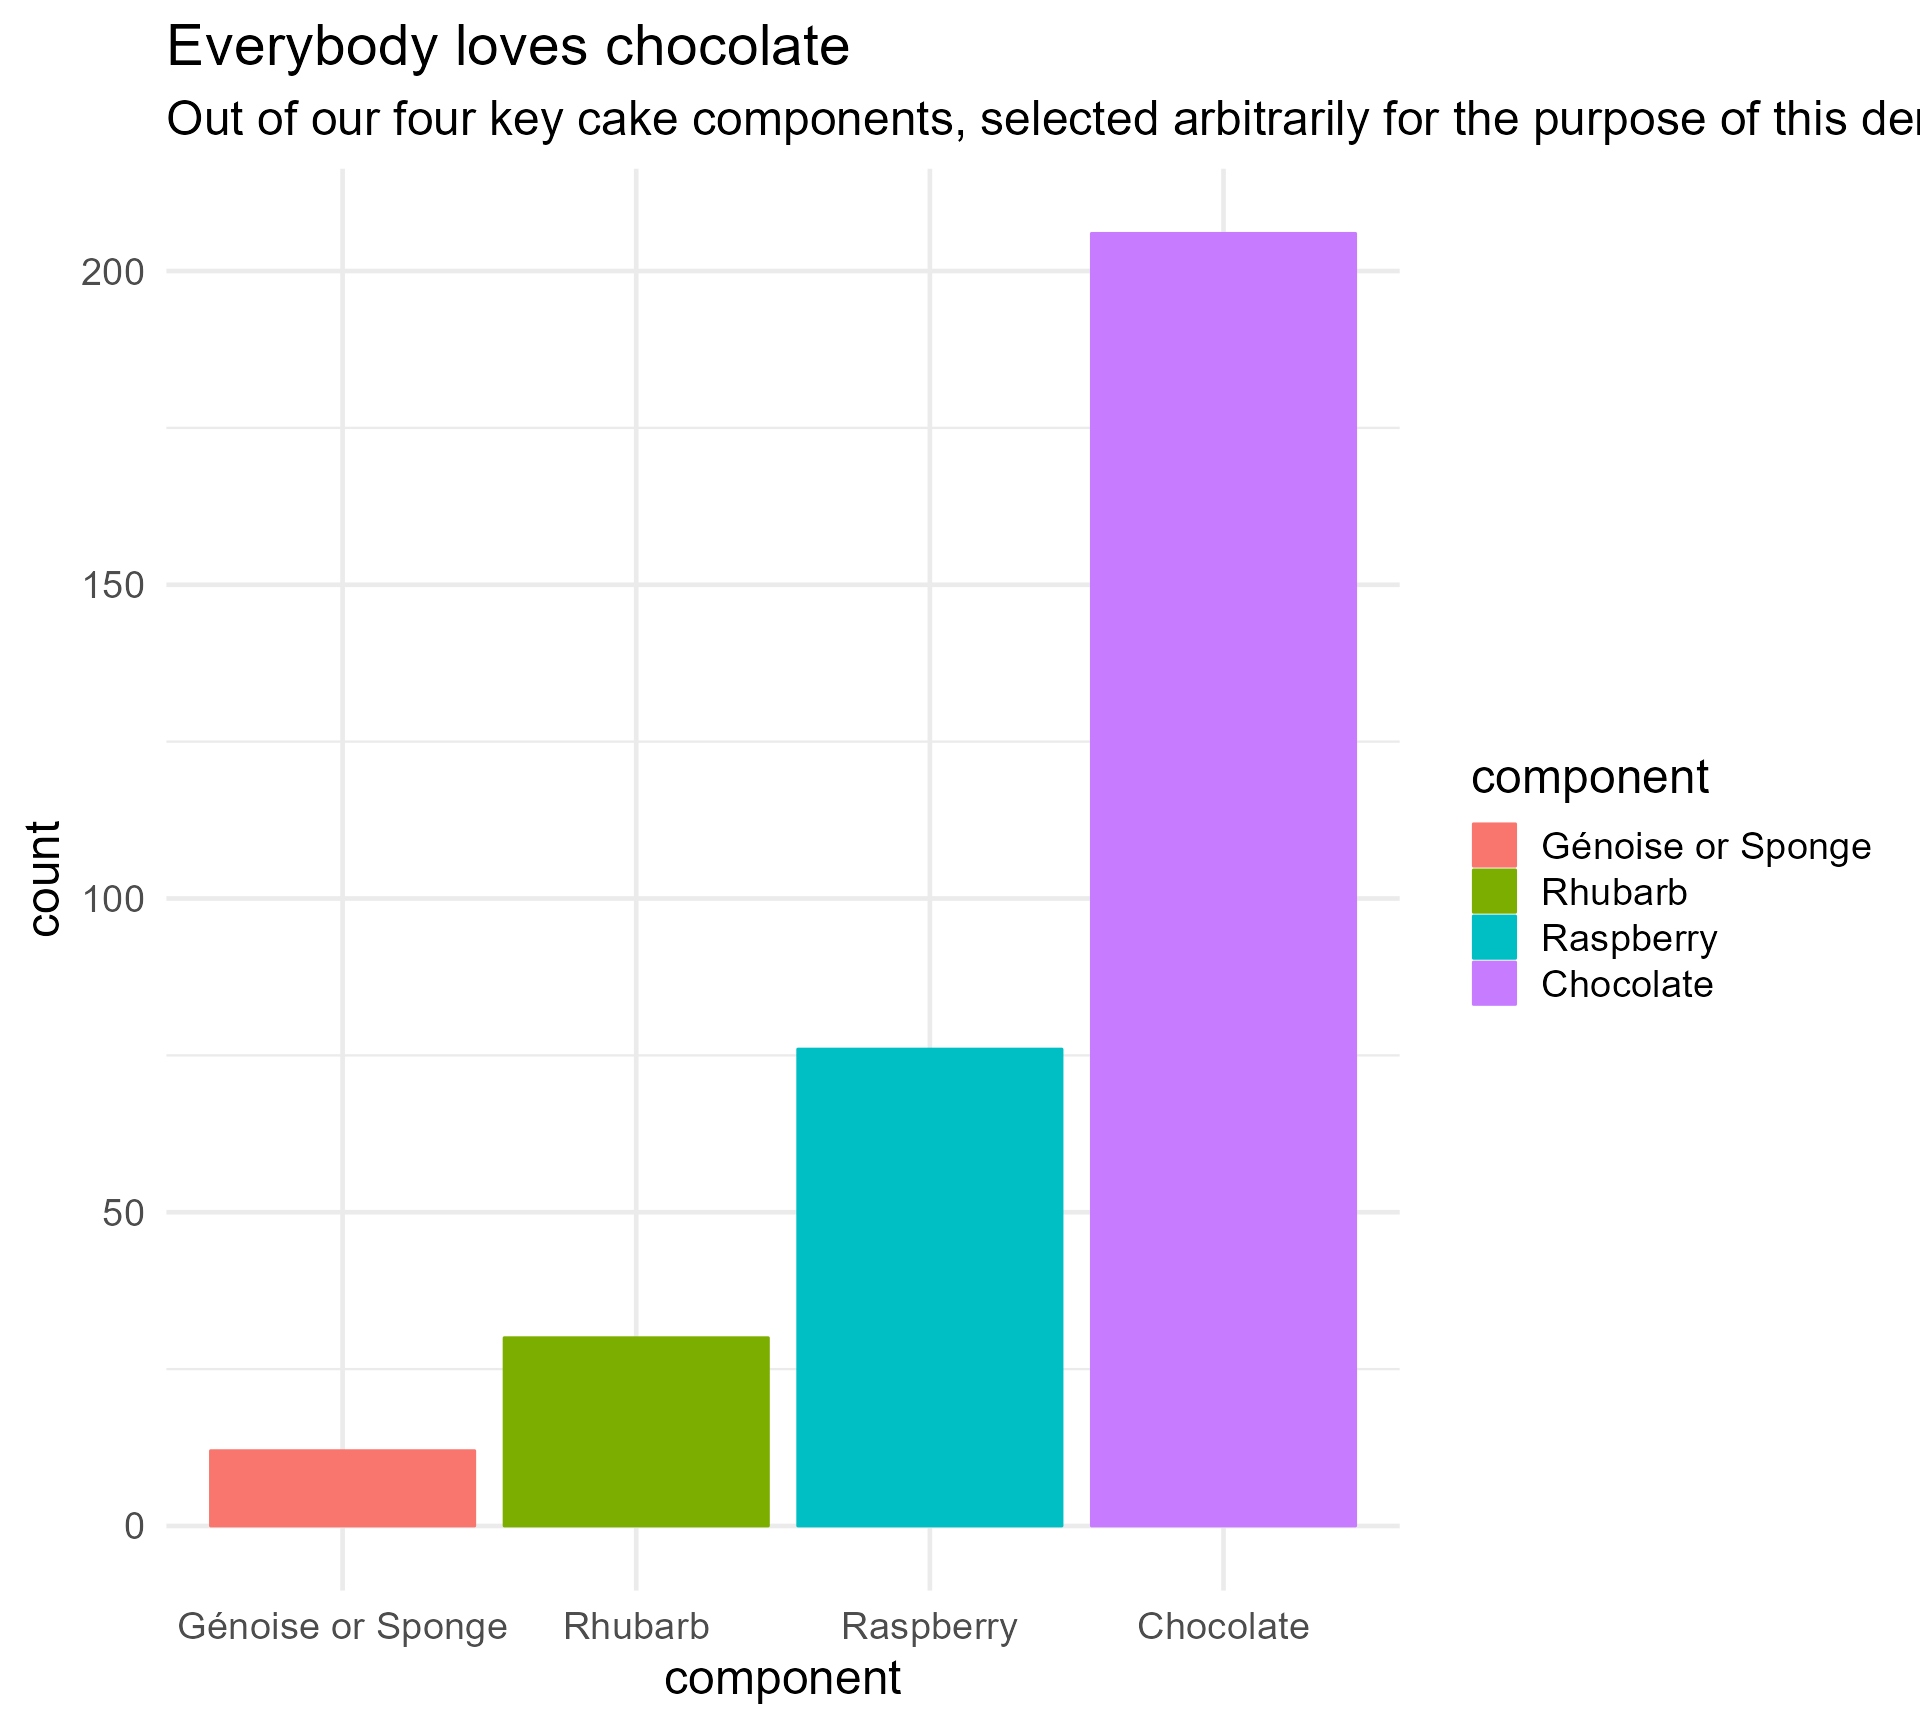
Our starting point
Mini tip! Avoid giving everyone a sore neck
key_components %>%
arrange(count) %>%
mutate(component = factor(component,
levels = component)) %>%
ggplot(aes(x = component,
y = count,
fill = component,
colour = component)) +
geom_bar(stat = "identity") +
labs(title = "Everybody loves chocolate",
subtitle = "Out of our four key cake components, selected arbitrarily for the purpose of this demonstration, chocolate stood out as the most frequently used by far. No huge surprises there!") +
theme_minimal(base_size = 18) +
coord_flip()
Our starting point
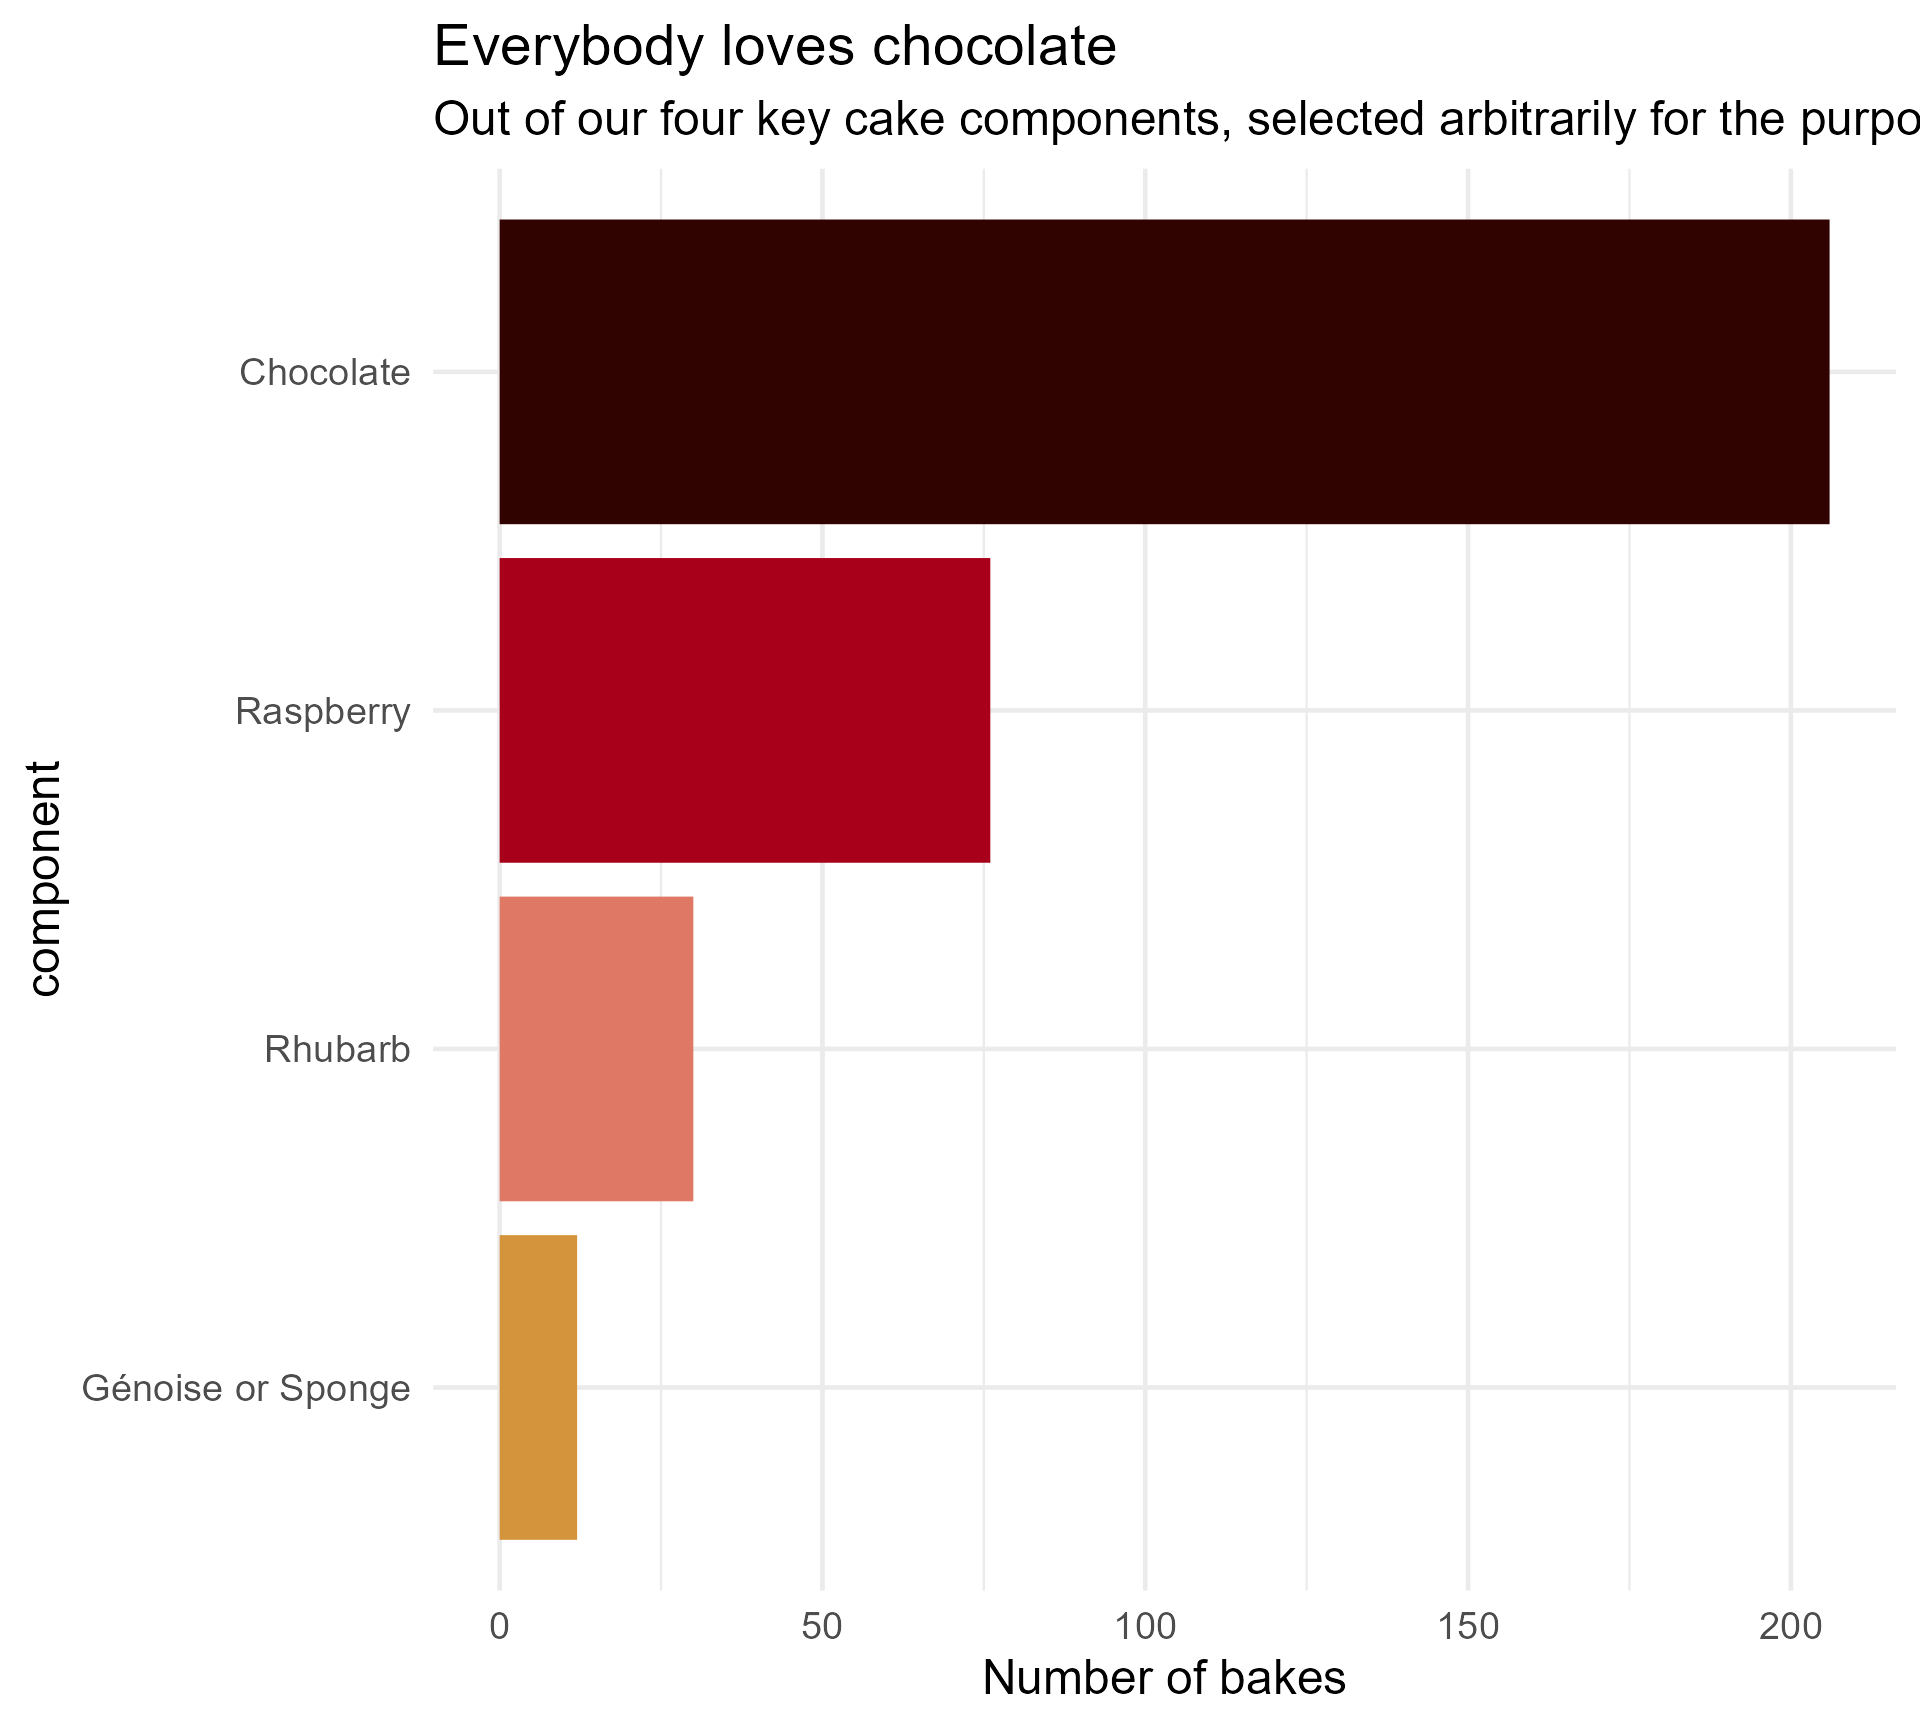
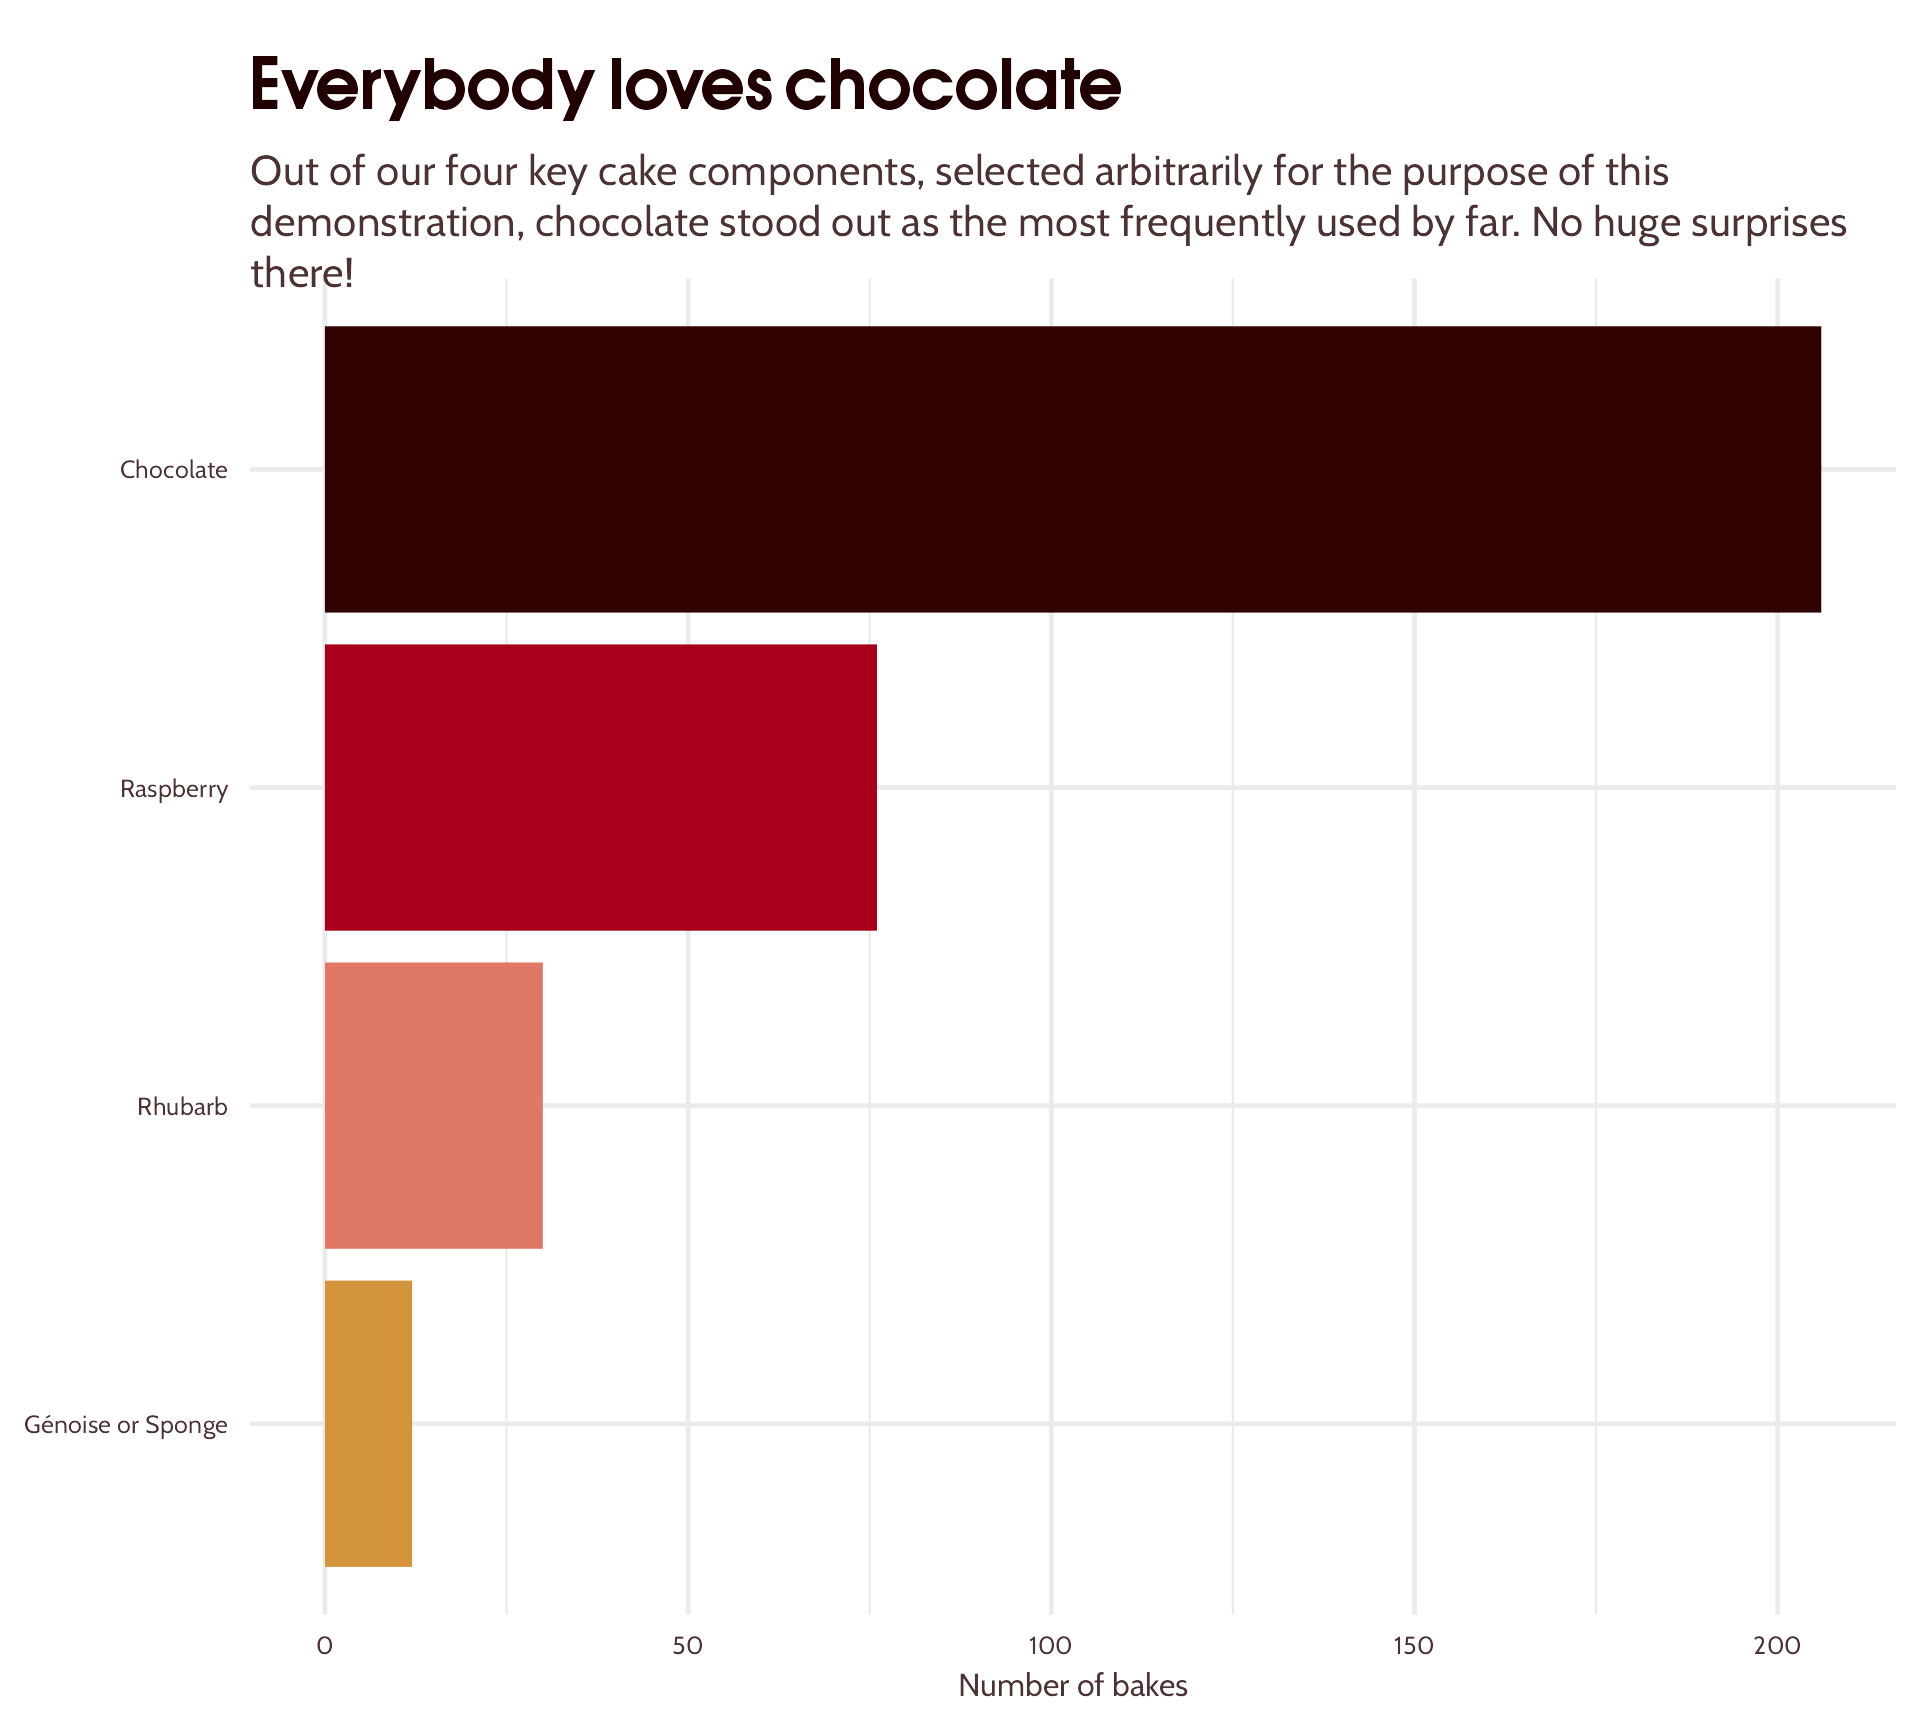
Mini tip! Use plain English
key_components %>%
arrange(count) %>%
mutate(component = factor(component,
levels = component)) %>%
ggplot(aes(x = component,
y = count,
fill = component,
colour = component)) +
geom_bar(stat = "identity") +
labs(title = "Everybody loves chocolate",
subtitle = "Out of our four key cake components, selected arbitrarily for the purpose of this demonstration, chocolate stood out as the most frequently used by far. No huge surprises there!",
y = "Number of bakes") +
theme_minimal(base_size = 18) +
coord_flip()
Our starting point
Perfectly functional - but…

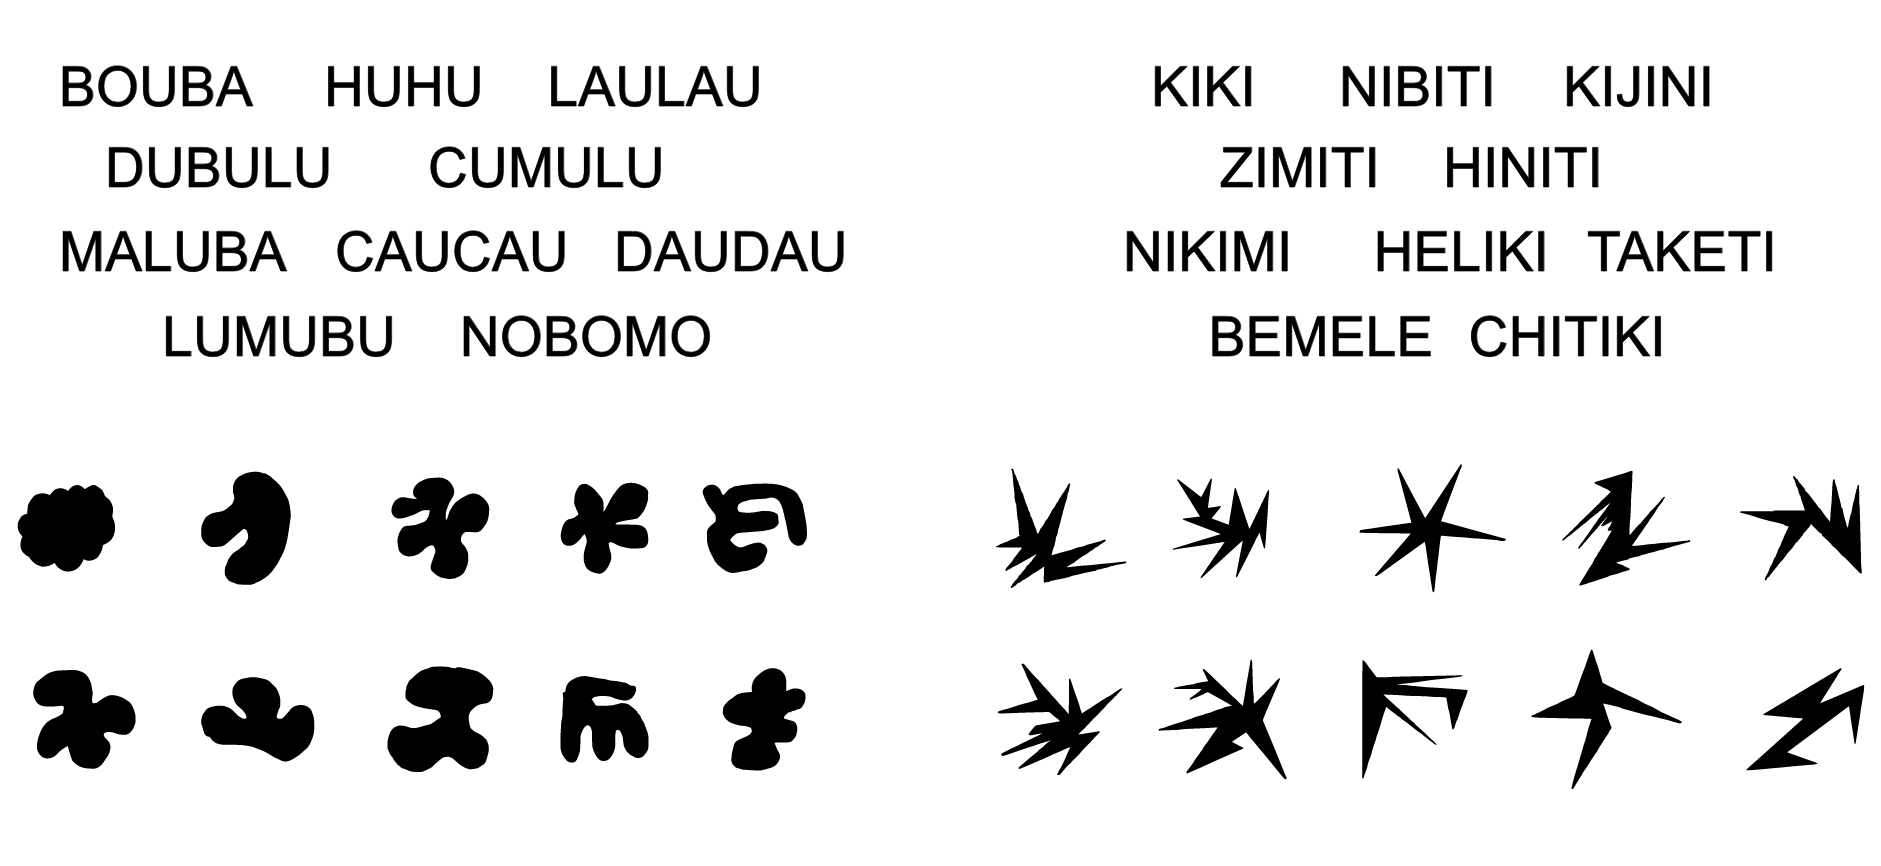
#1 Decrease reliance on text
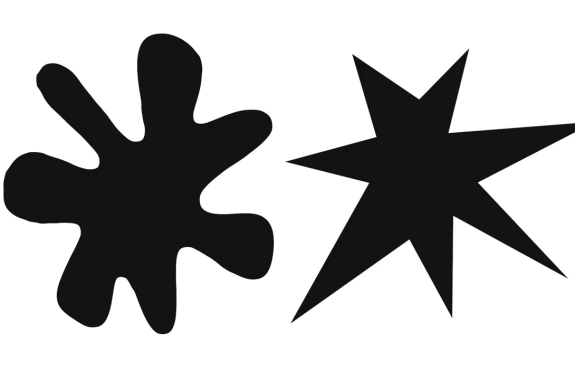
#1 Decrease reliance on text
Predicted by sound properties - Passi & Arun, 2022
#1 Decrease reliance on text
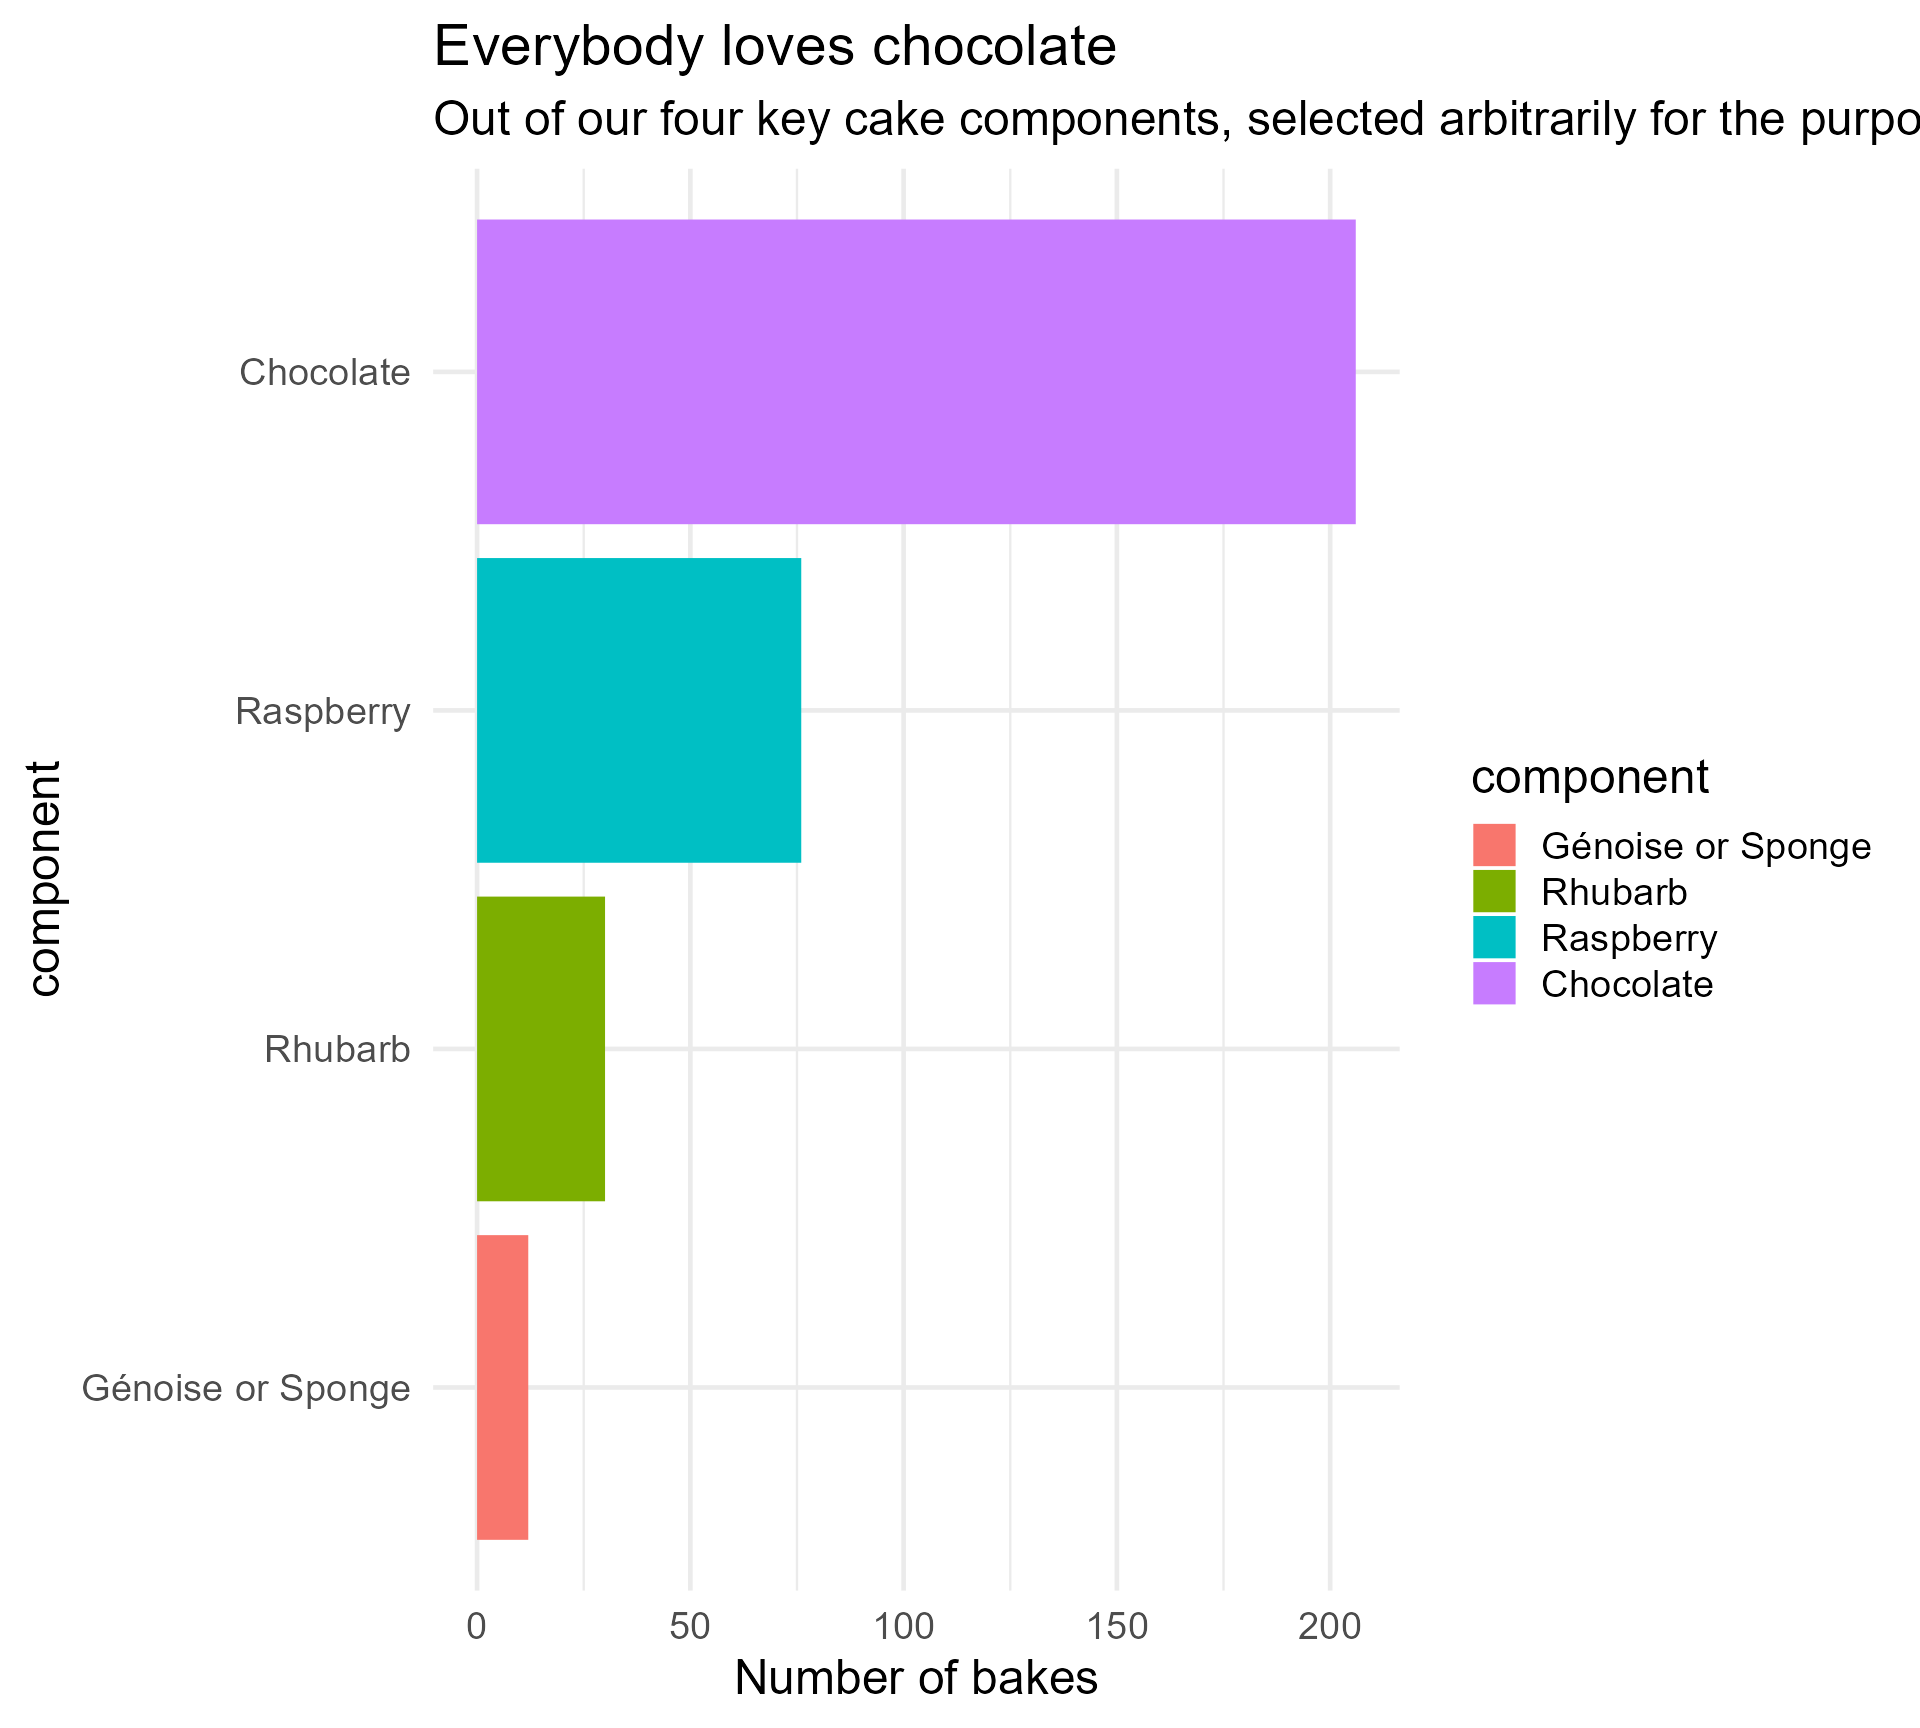
A mouth-watering palette!

#1 Decrease reliance on text

#1 Decrease reliance on text
#1 Decrease reliance on text
#1 Decrease reliance on text

#1 Decrease reliance on text

#2 Add text hierarchy
#2 Add text hierarchy
Where we were…

#2 Add text hierarchy
Use text colour based on “anchor” colour

#2 Add text hierarchy
Override theme_minimal()’s axis text colour

#2 Add text hierarchy
Use text colour(s) based on “anchor” colour

#2 Add text hierarchy
Increase difference between title and subtitle

#2 Add text hierarchy
Add some personality!
basic_bar_plot +
scale_fill_manual(values = component_colours) +
theme(text = element_text(family = "Cabin",
colour = "#4C3232"),
legend.position = "none",
axis.title.y = element_blank(),
plot.subtitle = element_text(size = 16),
plot.title = element_text(family = "OPTIAuvantGothic-DemiBold",
size = 24,
face = "bold",
colour = "#200000"),
axis.text = element_text(colour = "#4C3232"))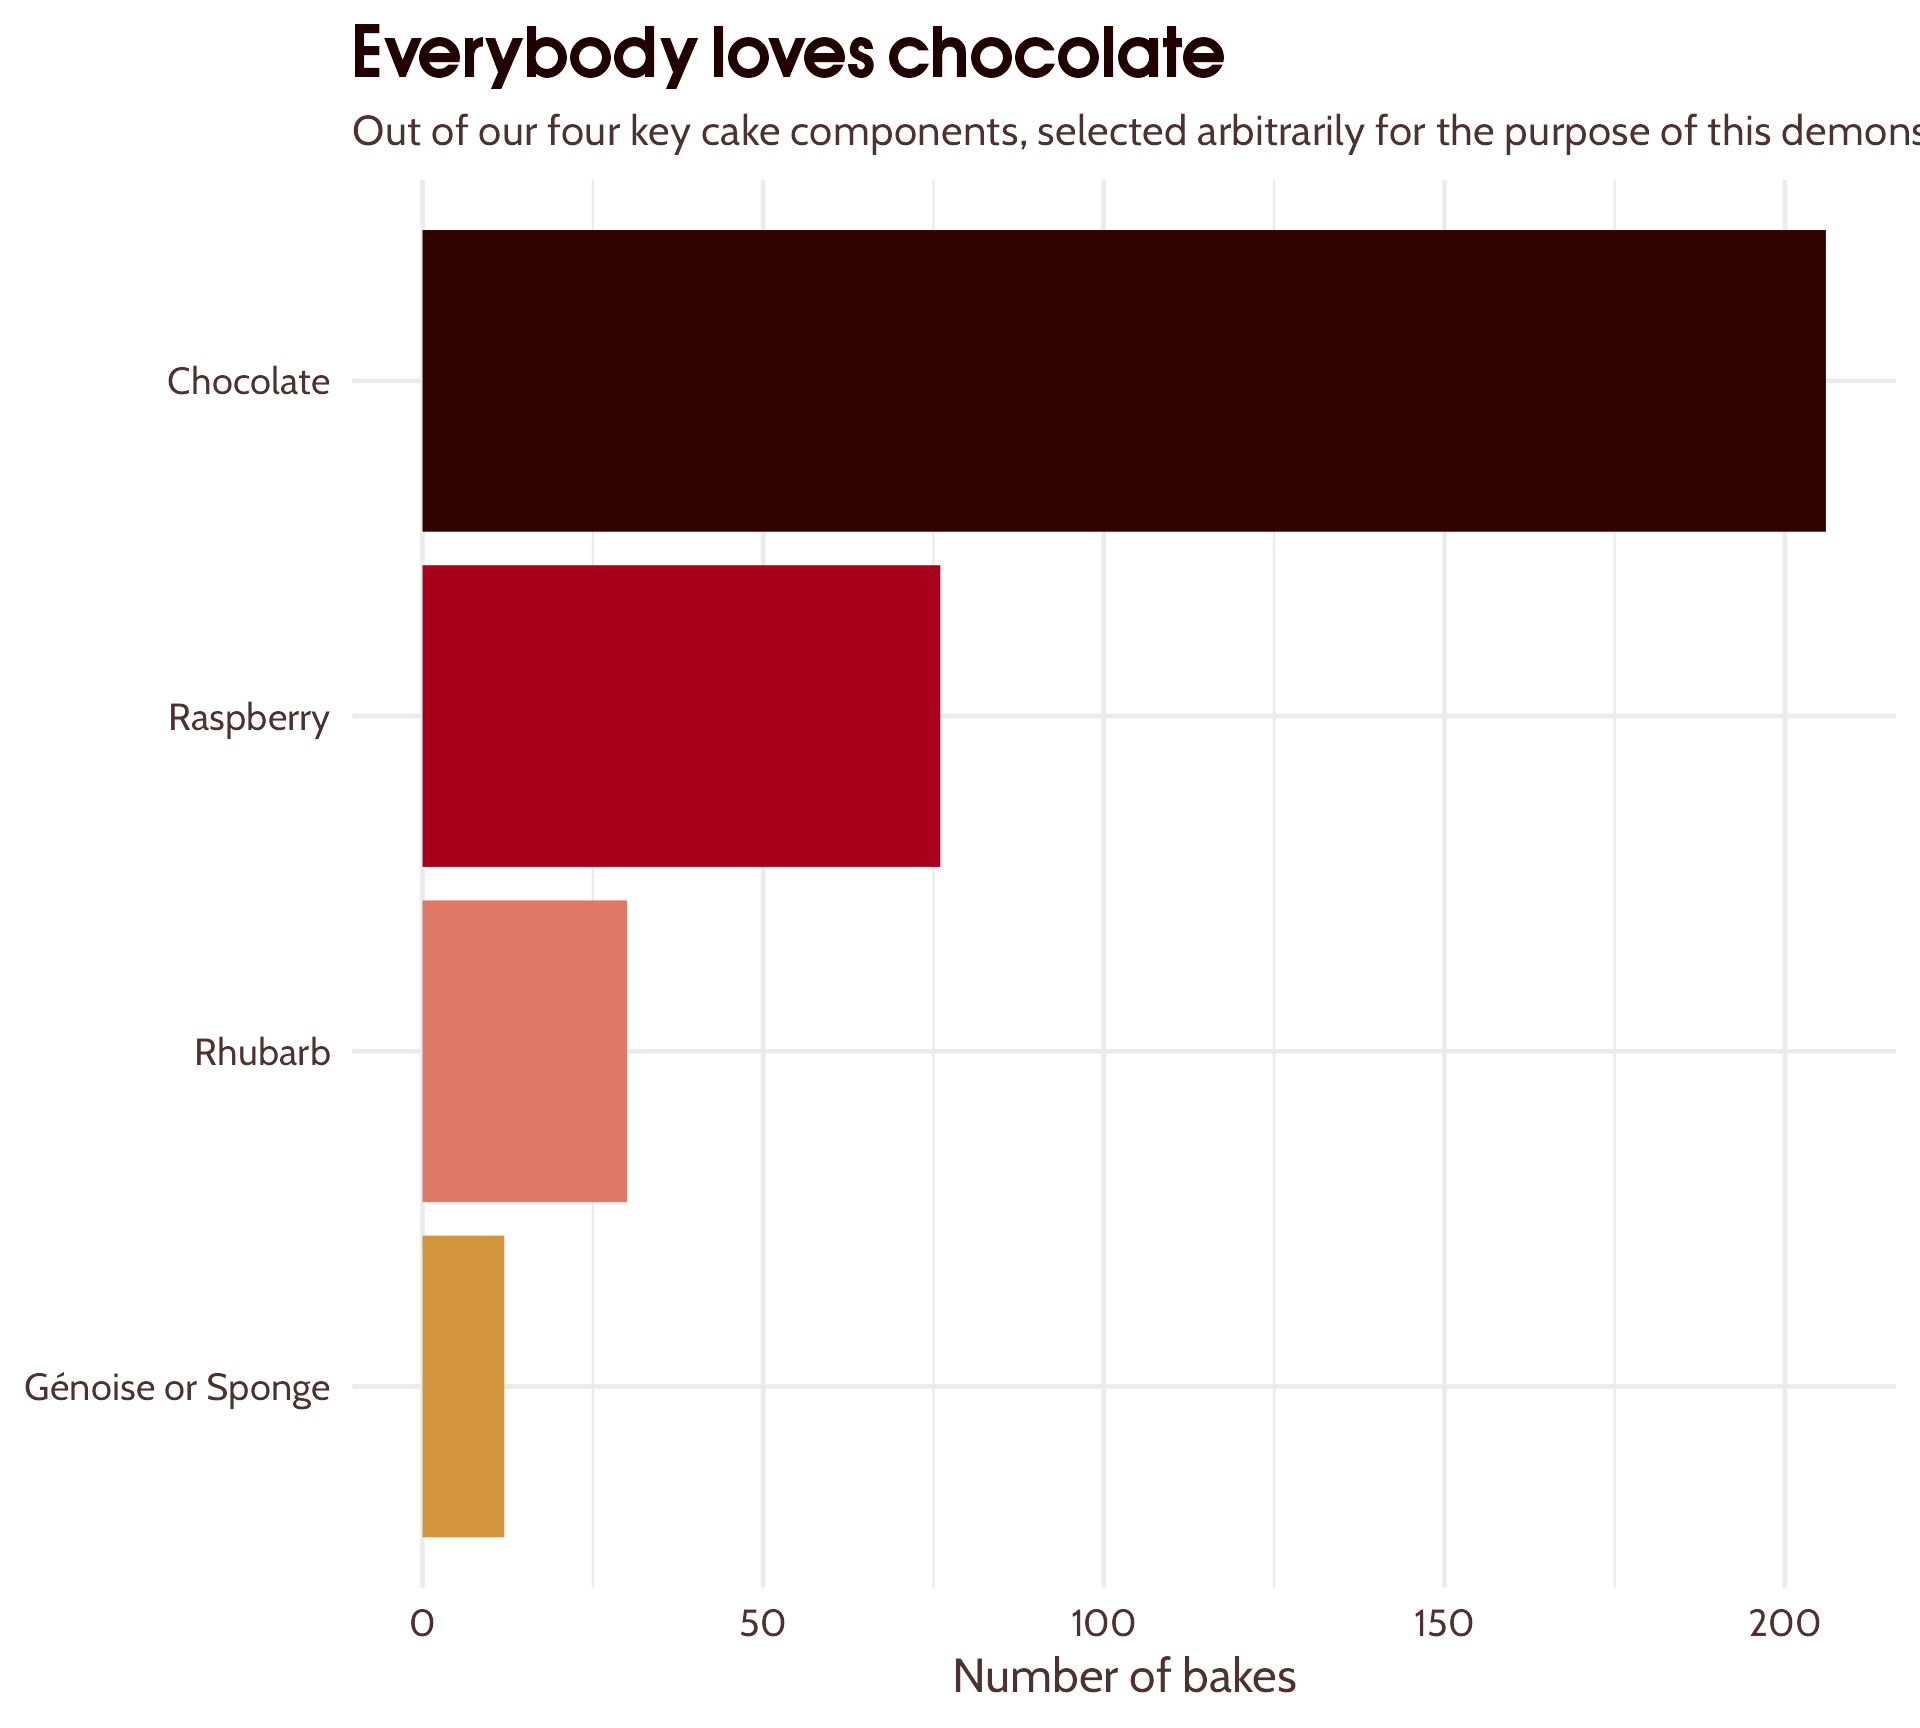
#2 - Add text hierarchy
Getting fonts to work can be frustrating!
Install fonts locally, restart R Studio + 📦
{systemfonts}({ragg}+{textshaping}) + Set graphics device to “AGG” + 🤞
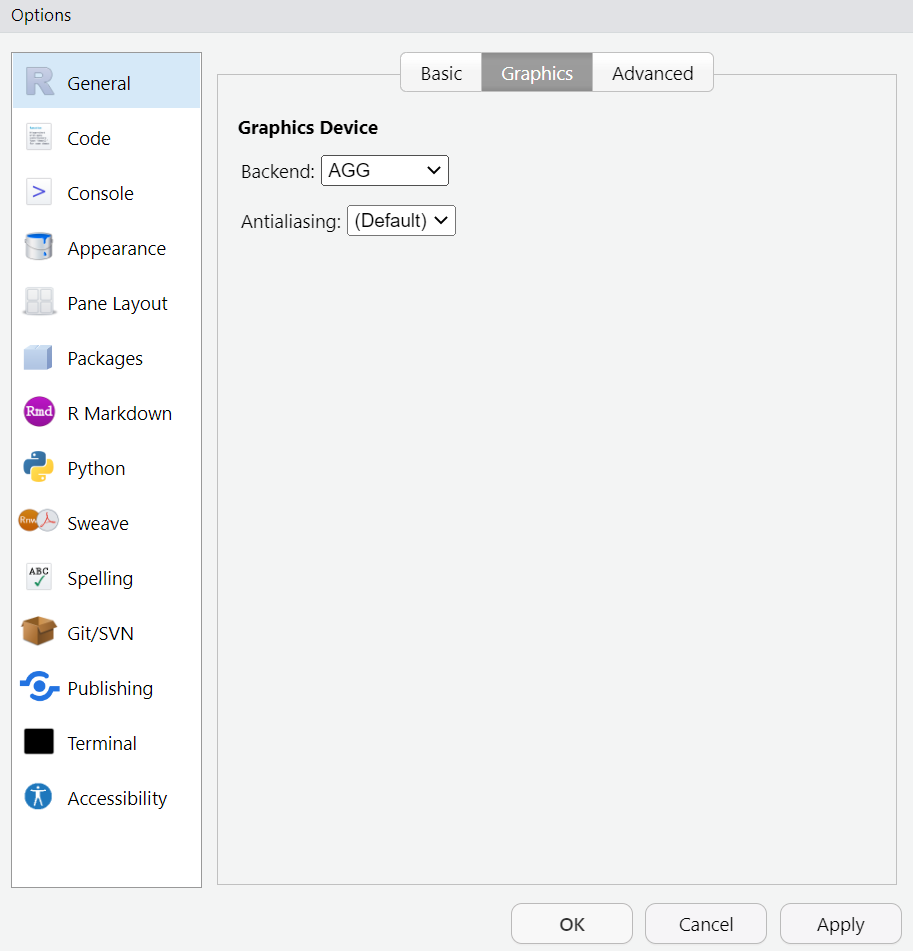
knitr::opts_chunk$set(dev = “ragg_png”)
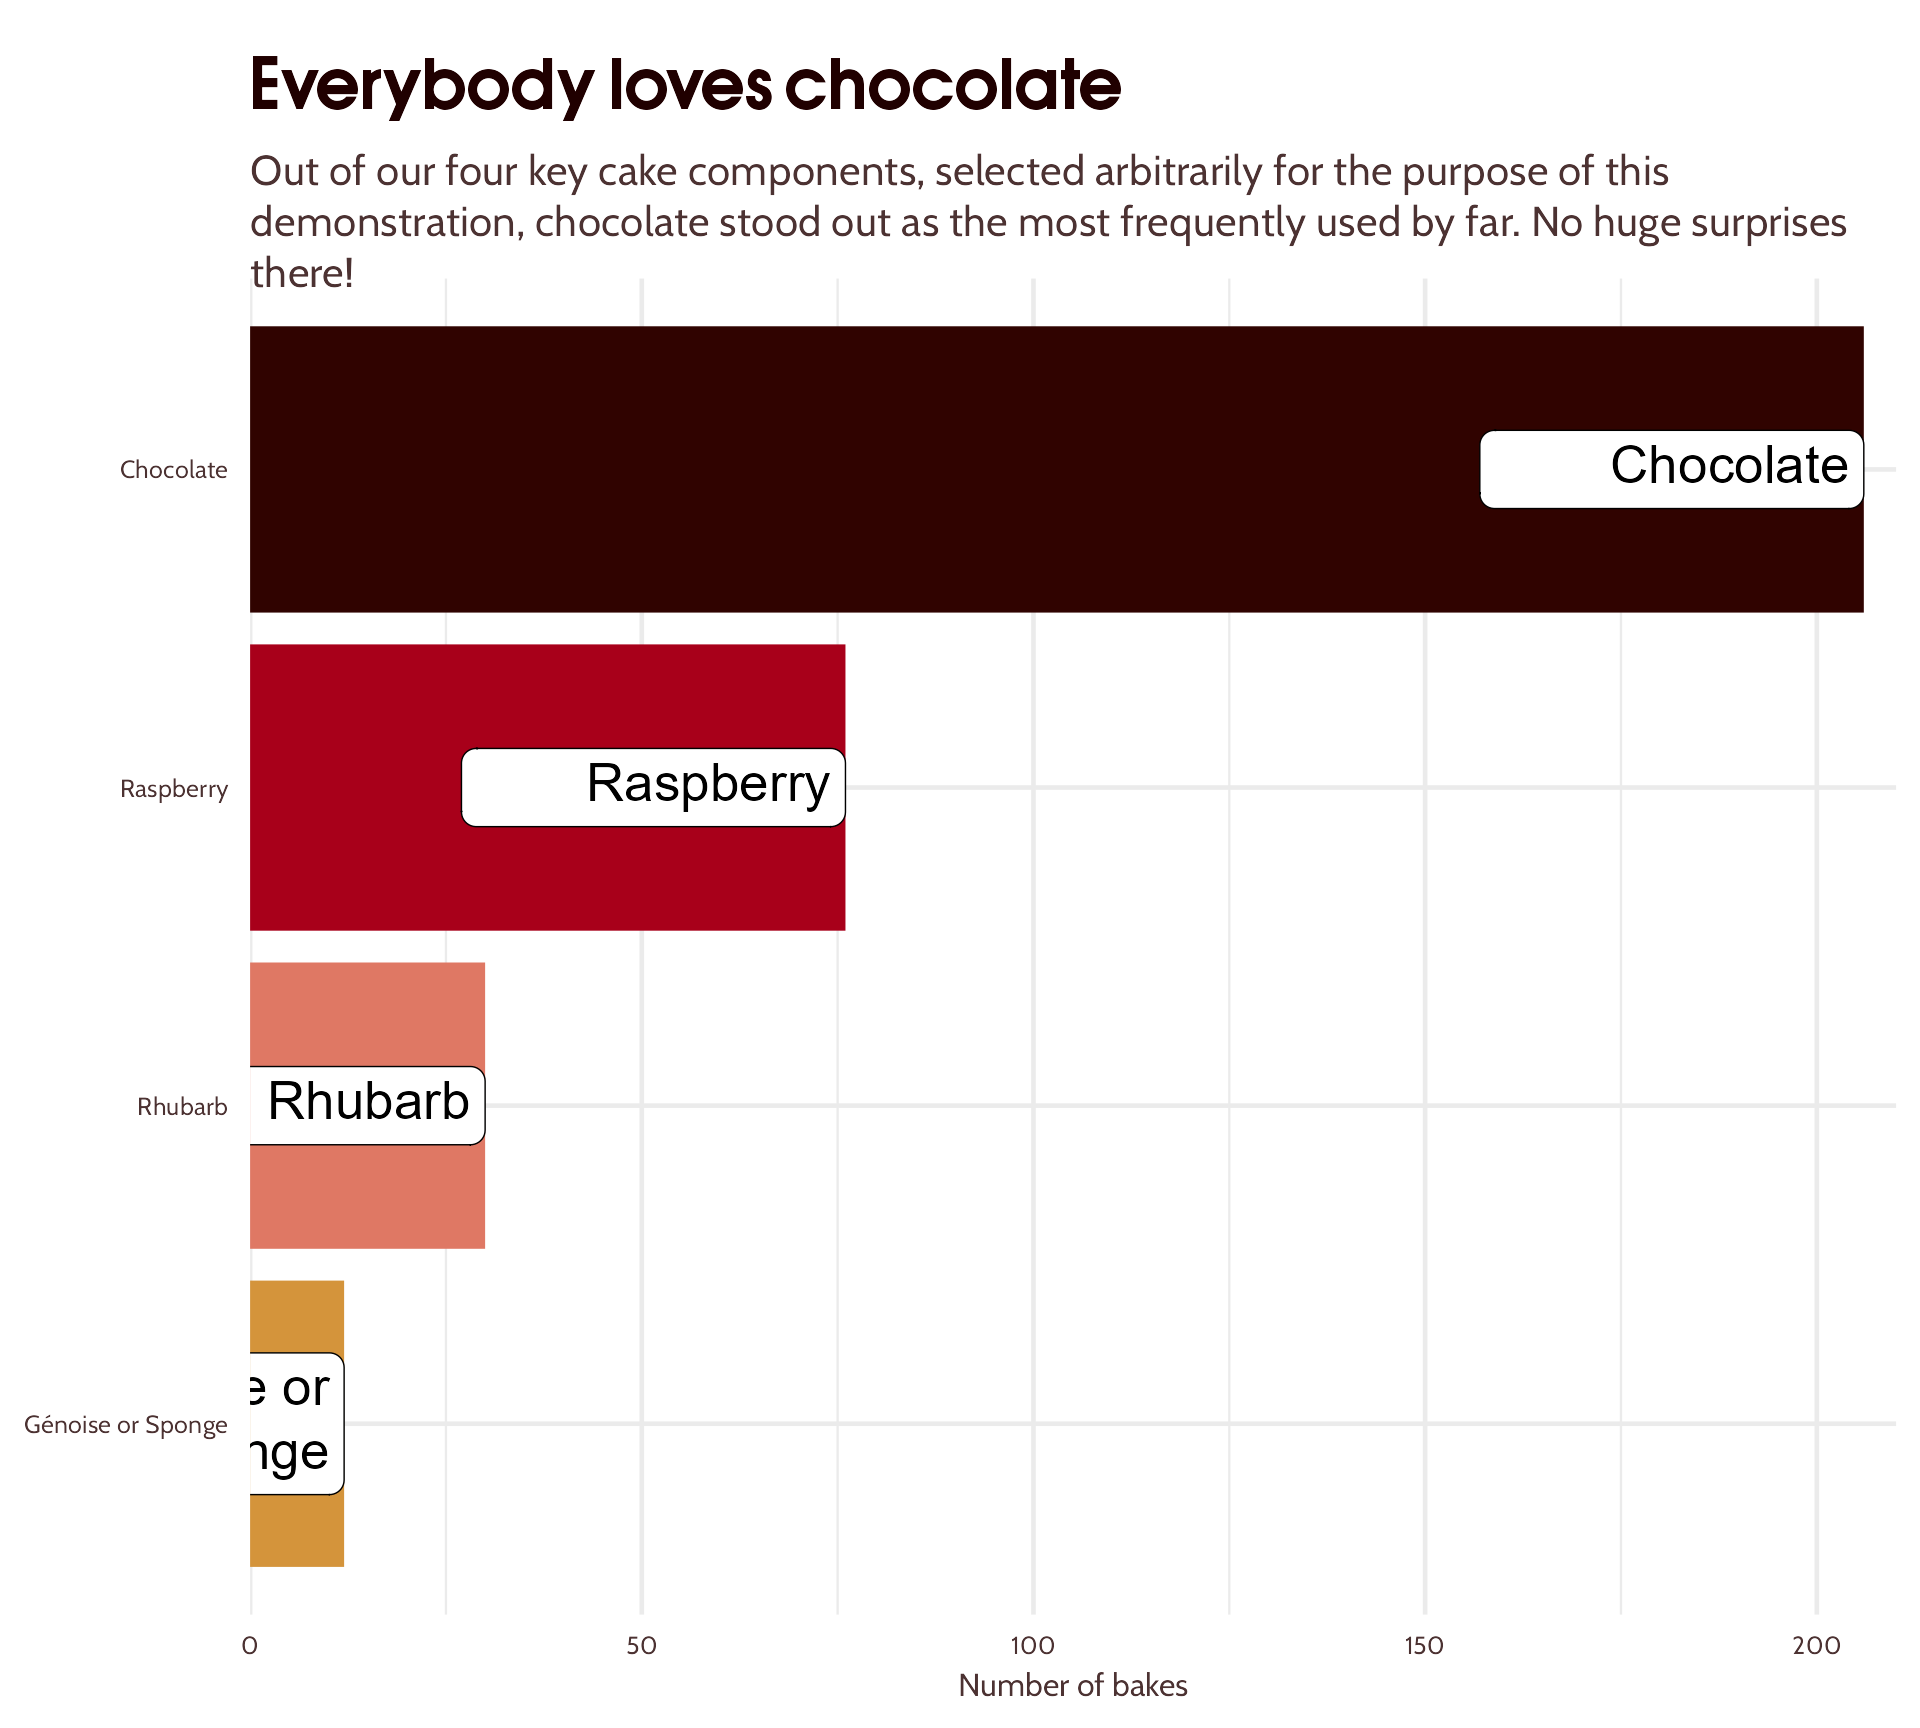
#2 Add text hierarchy
I ❤️ {ggtext}
basic_bar_plot +
scale_fill_manual(values = component_colours) +
theme(text = element_text(family = "Cabin",
colour = "#4C3232"),
legend.position = "none",
axis.title.y = element_blank(),
plot.subtitle = ggtext::element_textbox_simple(size = 16),
plot.title = element_text(family = "OPTIAuvantGothic-DemiBold",
size = 24,
face = "bold",
colour = "#200000"),
axis.text = element_text(colour = "#4C3232"))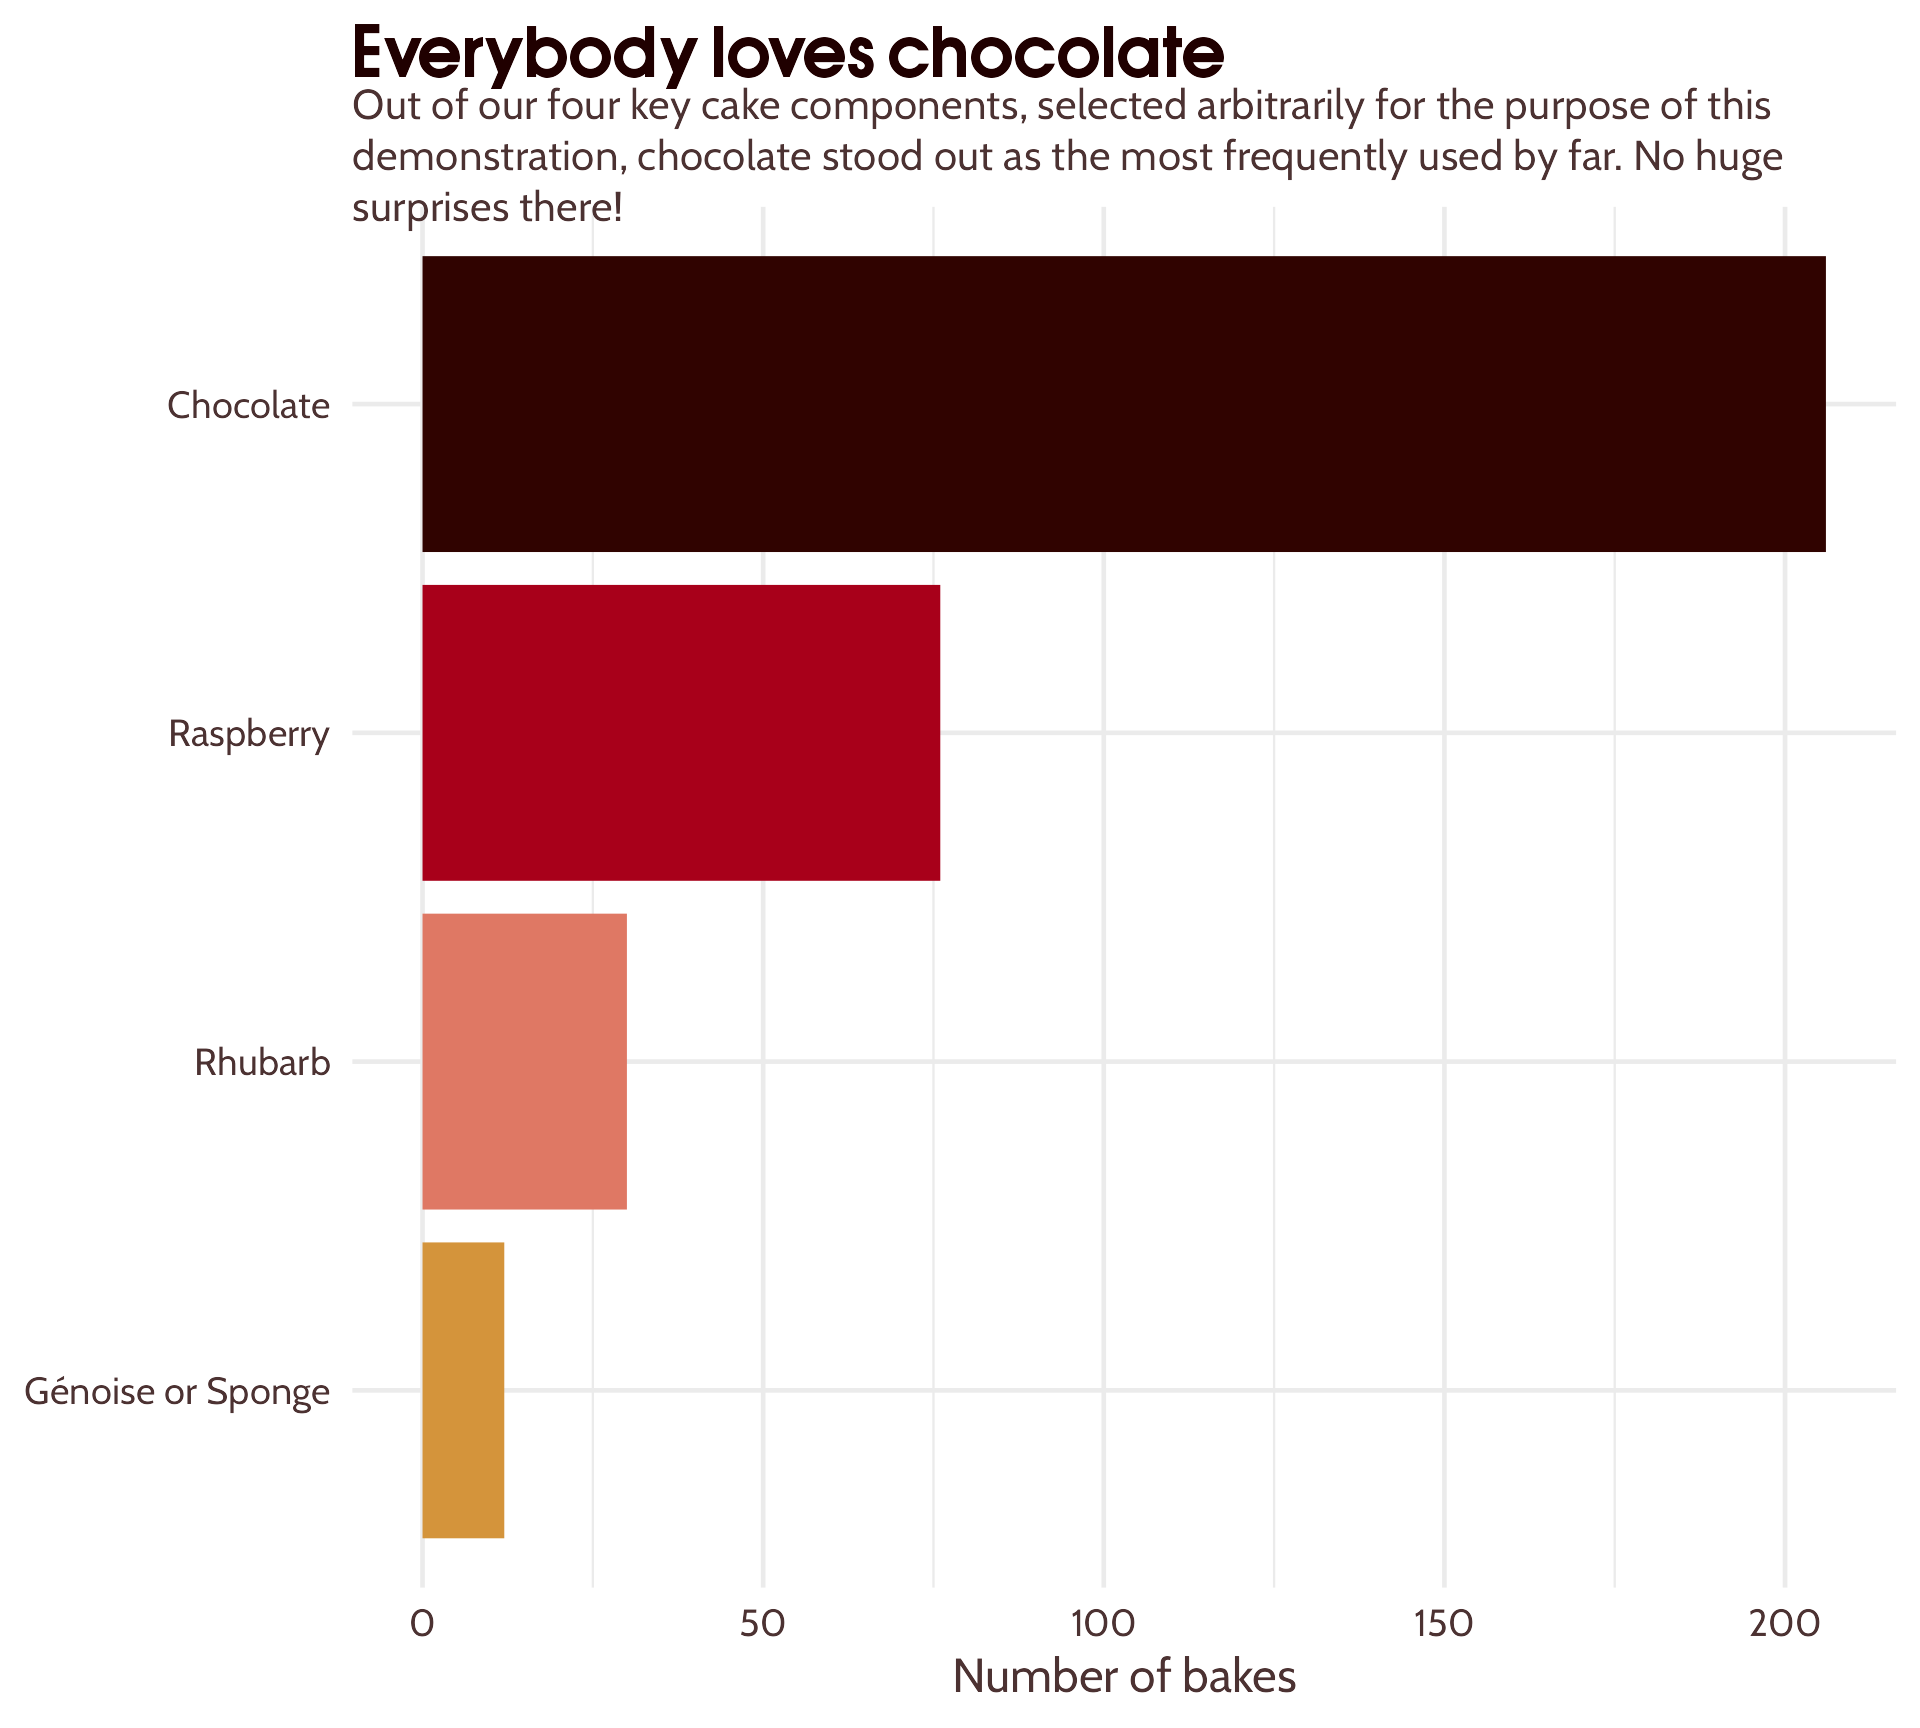
#2 Add text hierarchy
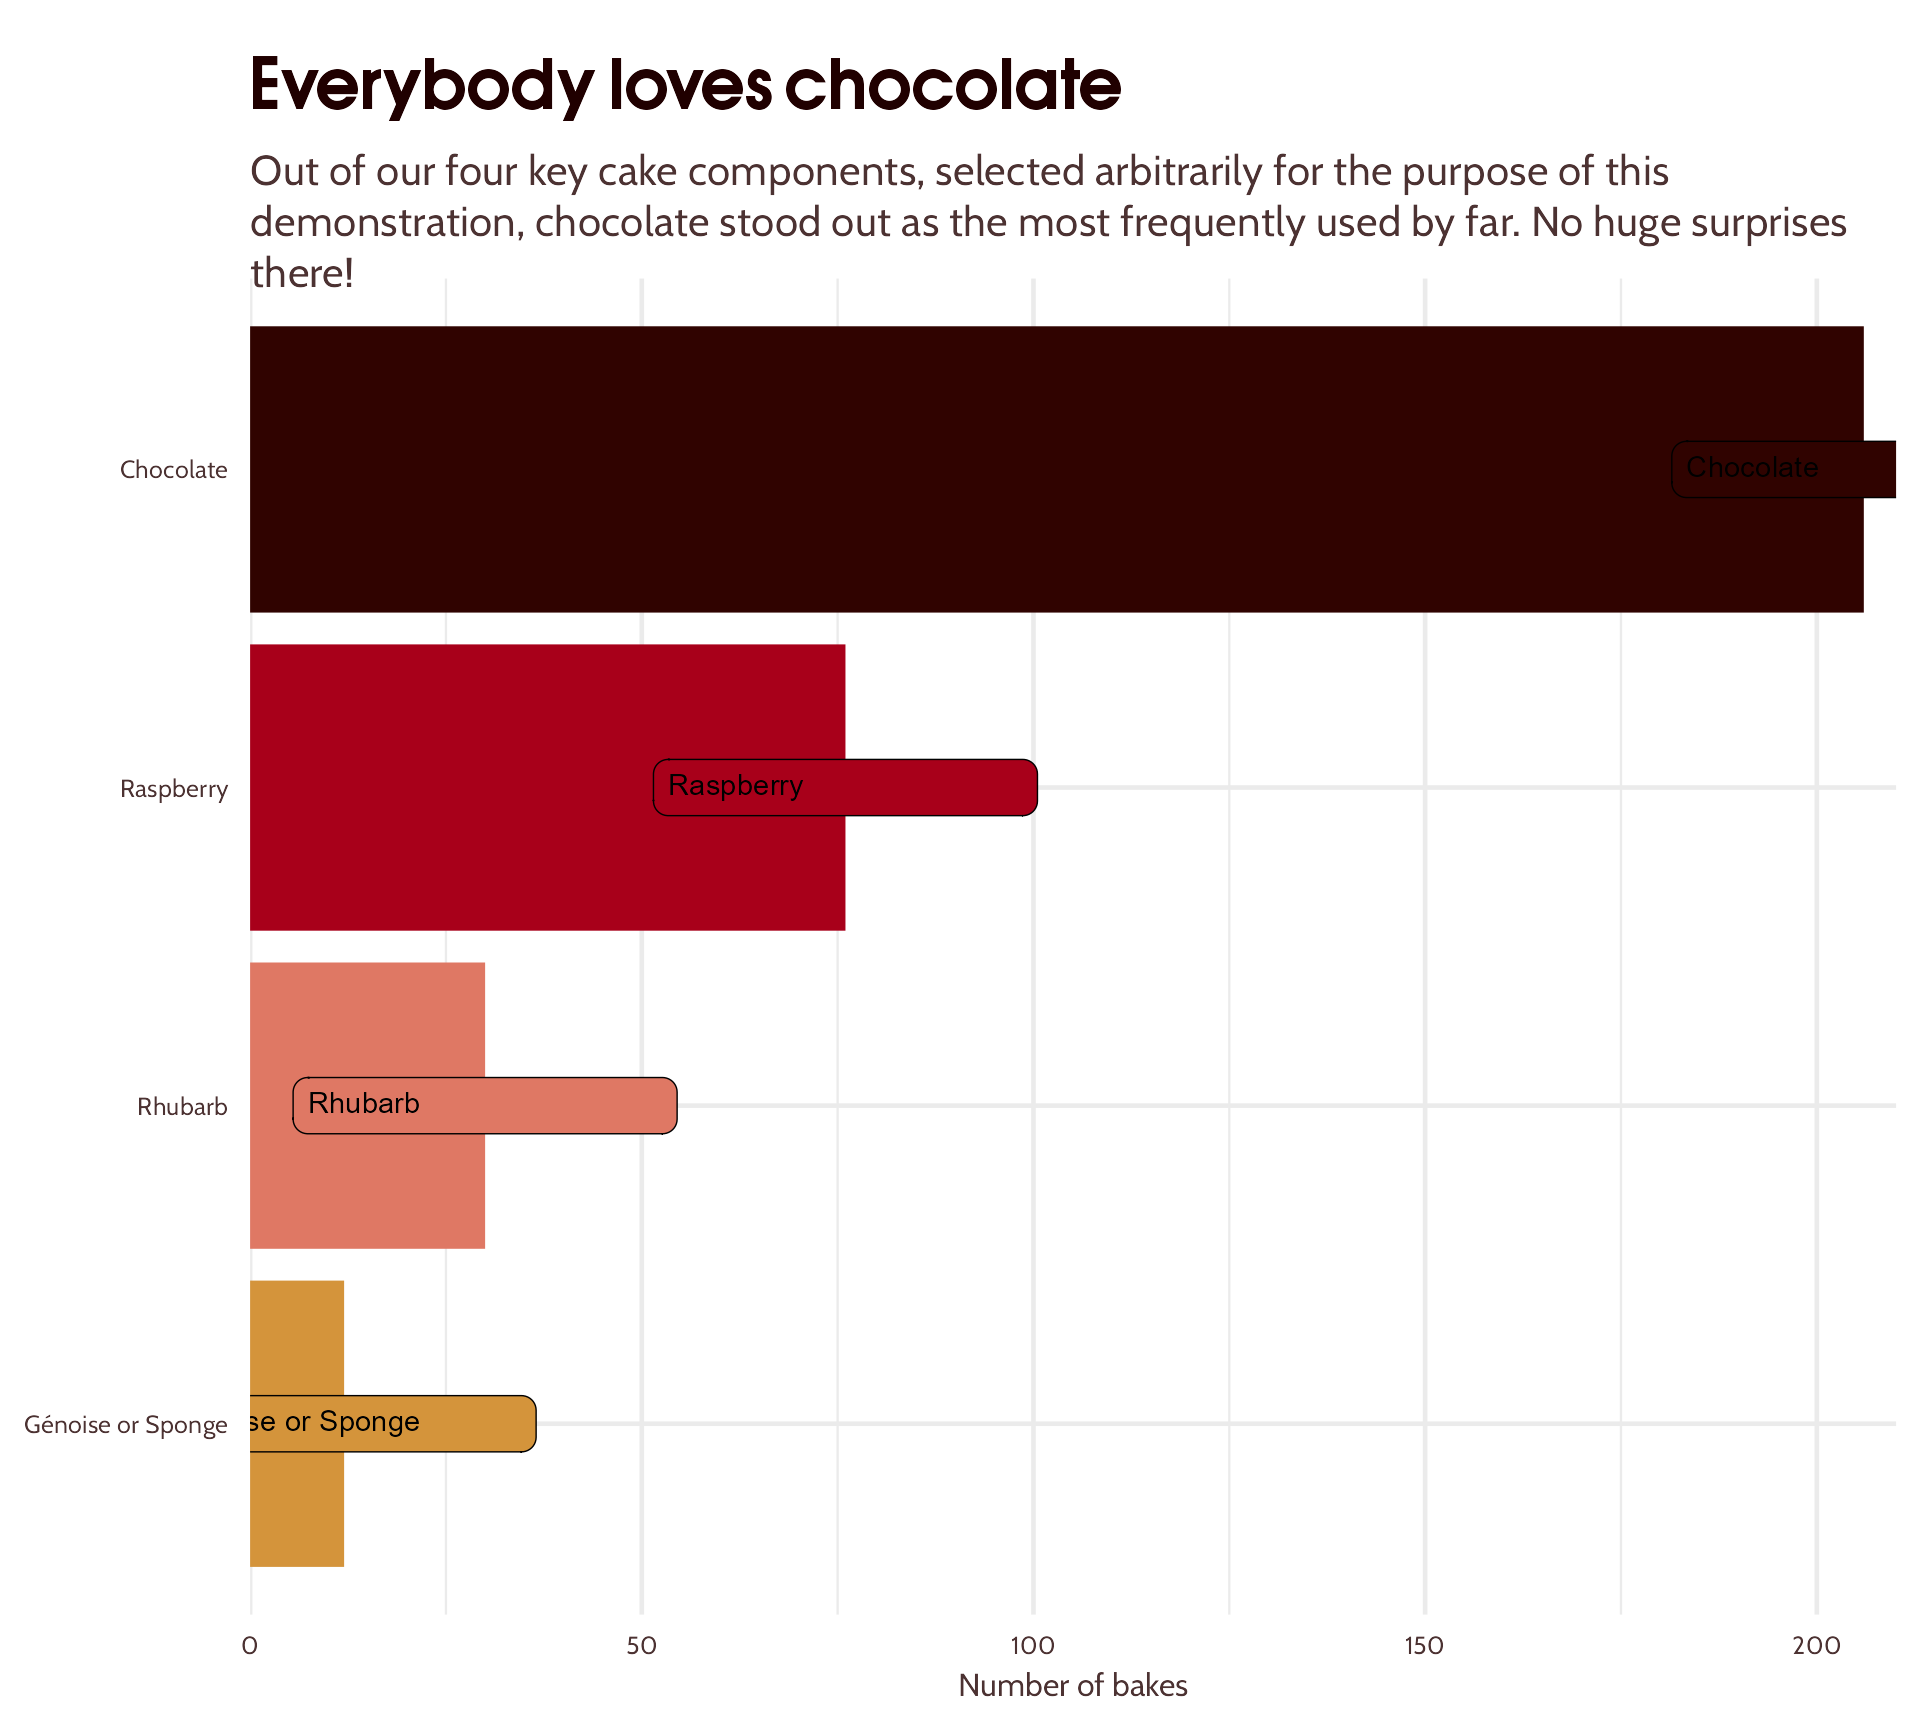
I ❤️ {ggtext} - but watch that alignment!
basic_bar_plot +
scale_fill_manual(values = component_colours) +
theme(text = element_text(family = "Cabin",
colour = "#4C3232"),
legend.position = "none",
axis.title.y = element_blank(),
plot.subtitle = ggtext::element_textbox_simple(size = 16,
vjust = 1),
plot.title = element_text(family = "OPTIAuvantGothic-DemiBold",
size = 24,
face = "bold",
colour = "#200000"),
axis.text = element_text(colour = "#4C3232"))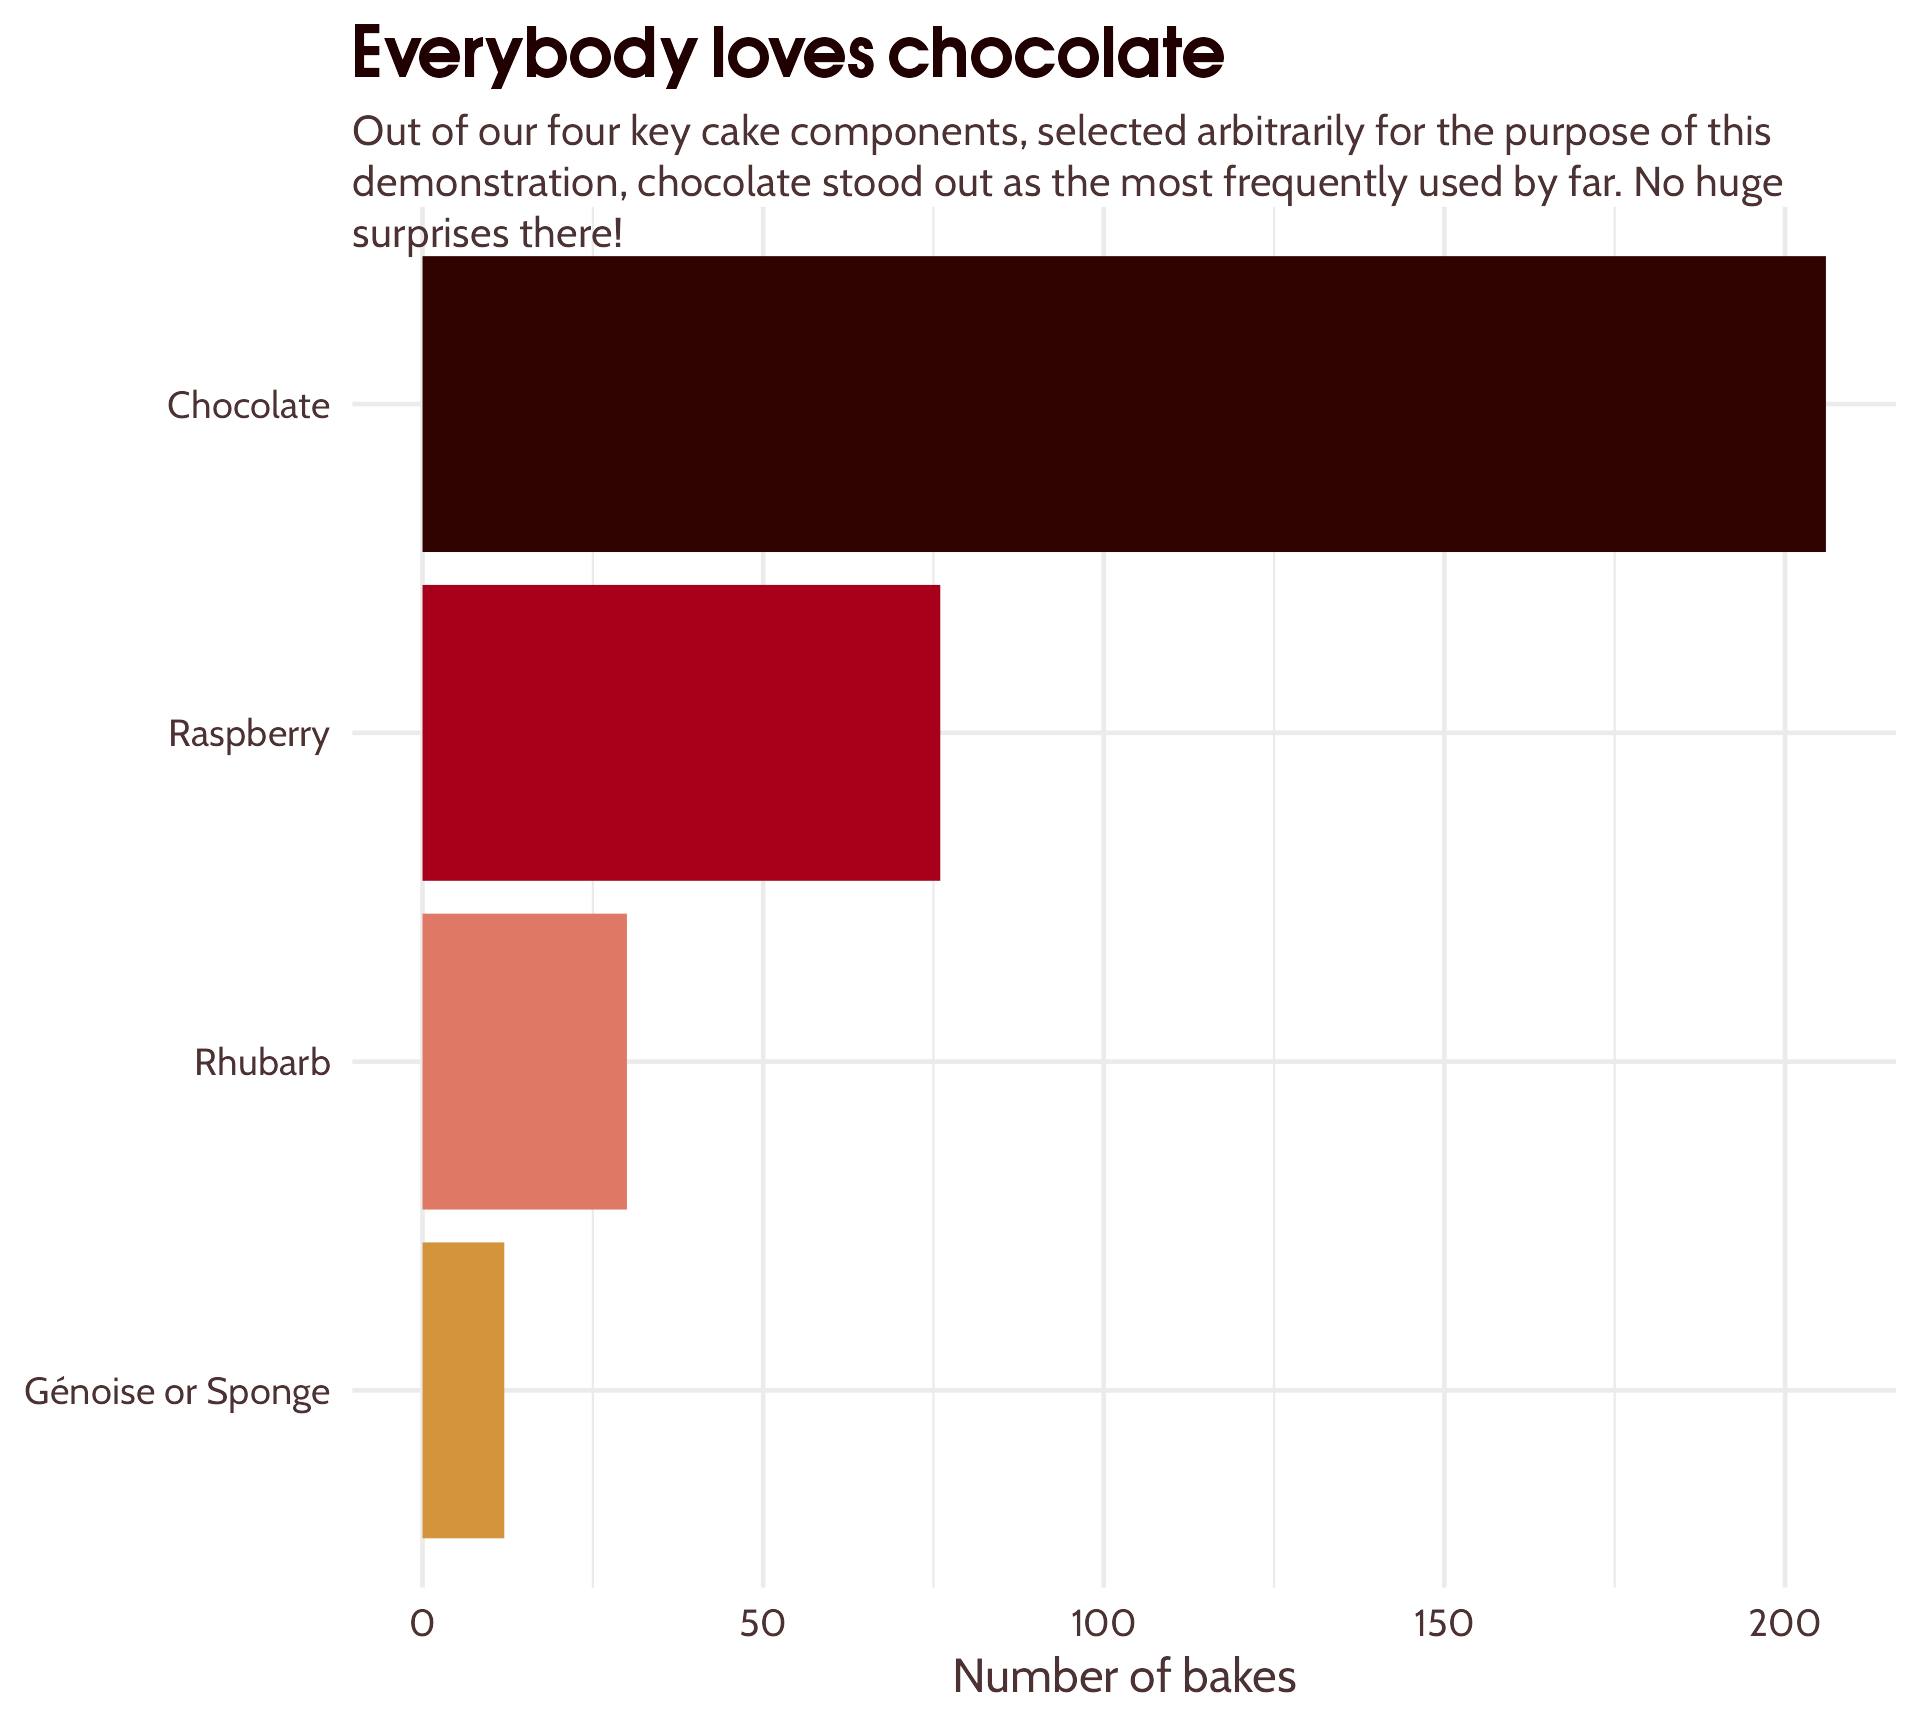
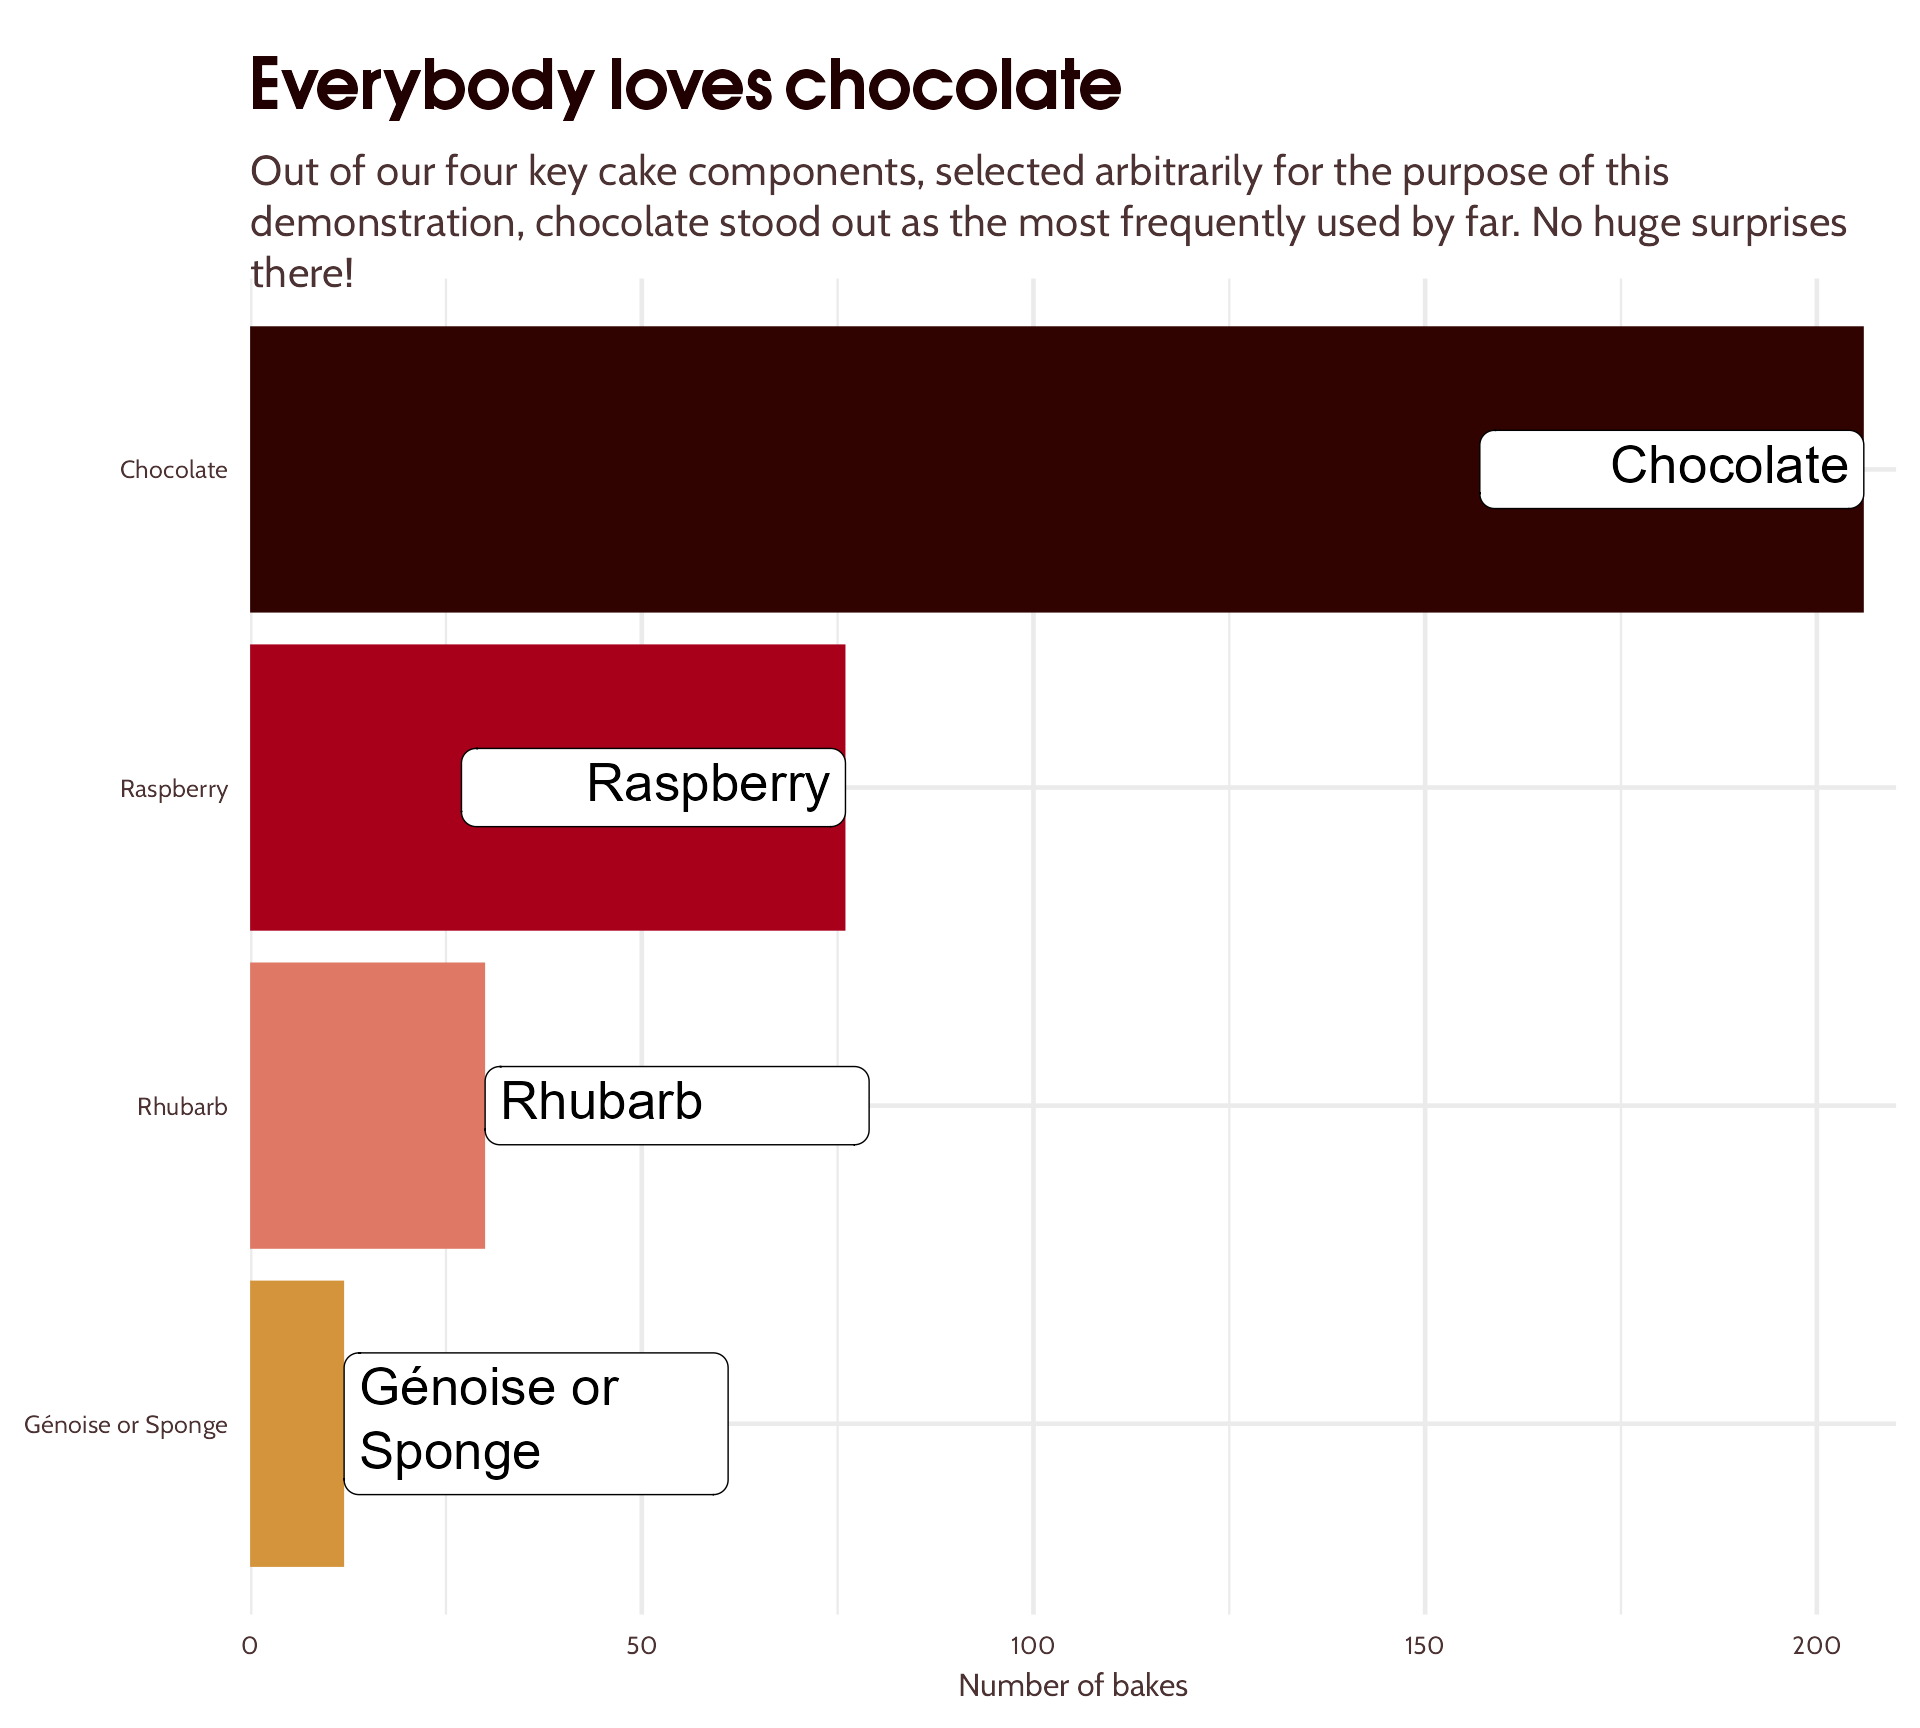
#2 Add text hierarchy
Allow some breathing space
basic_bar_plot +
scale_fill_manual(values = component_colours) +
theme(text = element_text(family = "Cabin",
colour = "#4C3232"),
legend.position = "none",
axis.title.y = element_blank(),
plot.subtitle = ggtext::element_textbox_simple(size = 16,
vjust = 1,
margin = margin(0, 0, 12, 0)),
plot.title = element_text(family = "OPTIAuvantGothic-DemiBold",
size = 24,
face = "bold",
colour = "#200000",
margin = margin(12, 0, 12, 0)),
axis.text = element_text(colour = "#4C3232"))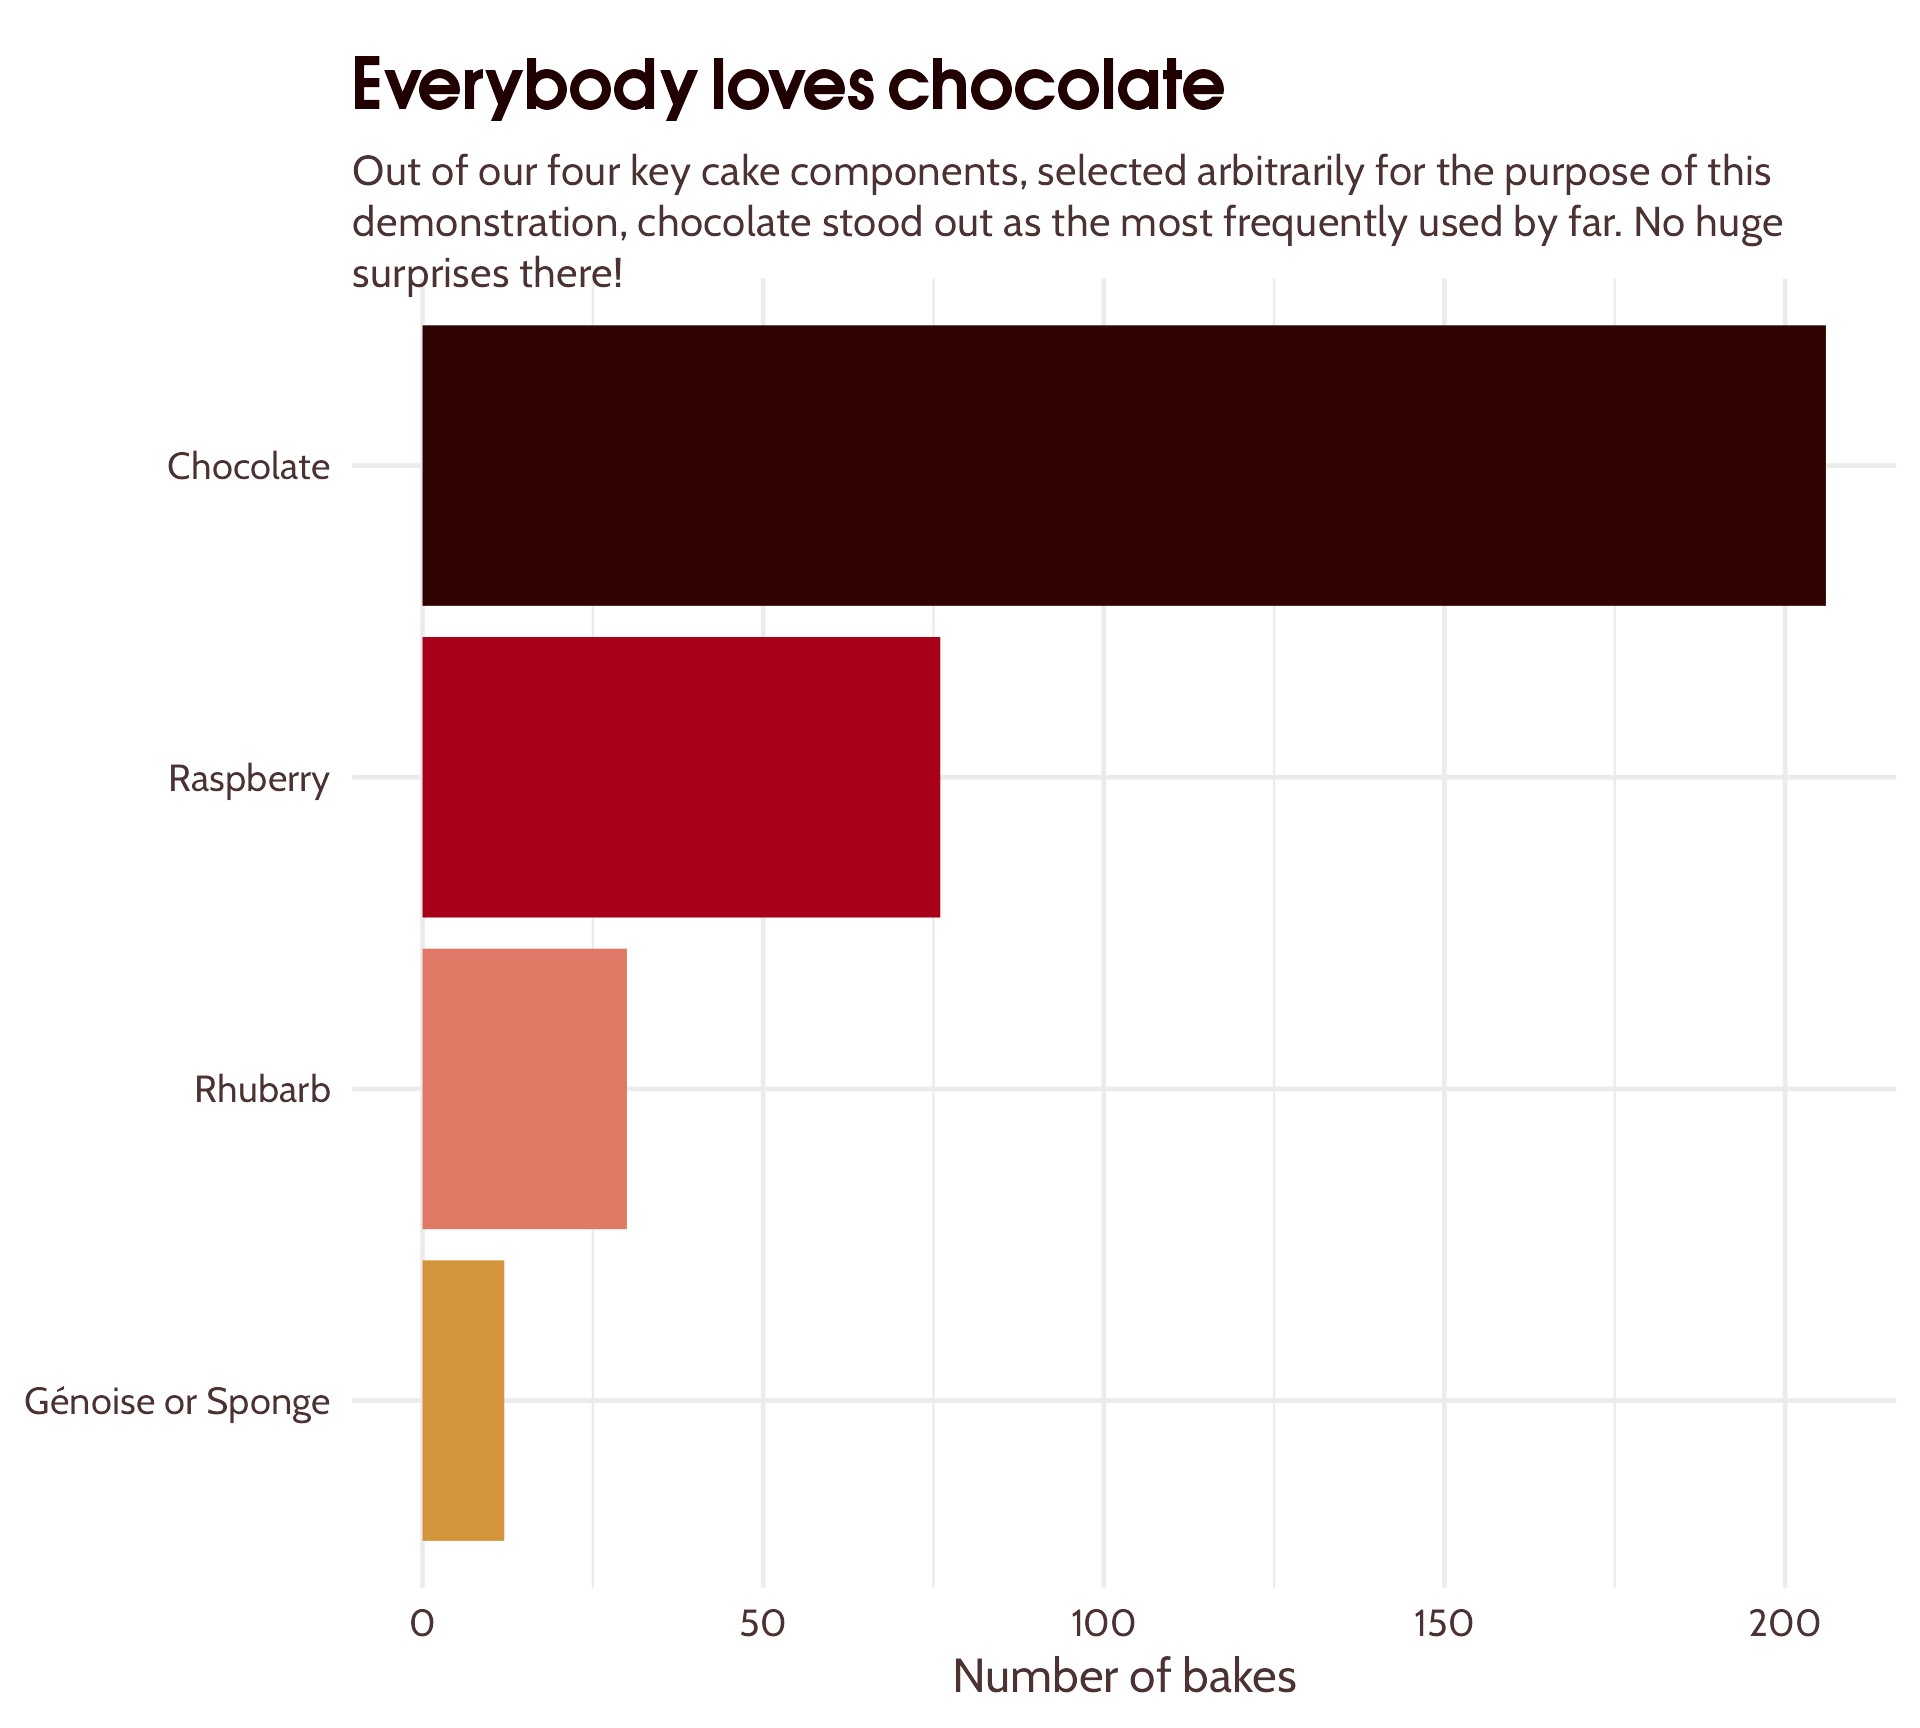
#2 Add text hierarchy


#3 Reduce unnecessary eye movement
Our starting point

#3 Reduce unnecessary eye movement
Mind the gap!

#3 Reduce unnecessary eye movement
I ❤️ {ggtext}
#3 Reduce unnecessary eye movement
Debugging mode
#3 Reduce unnecessary eye movement
Debugging mode
#3 Reduce unnecessary eye movement
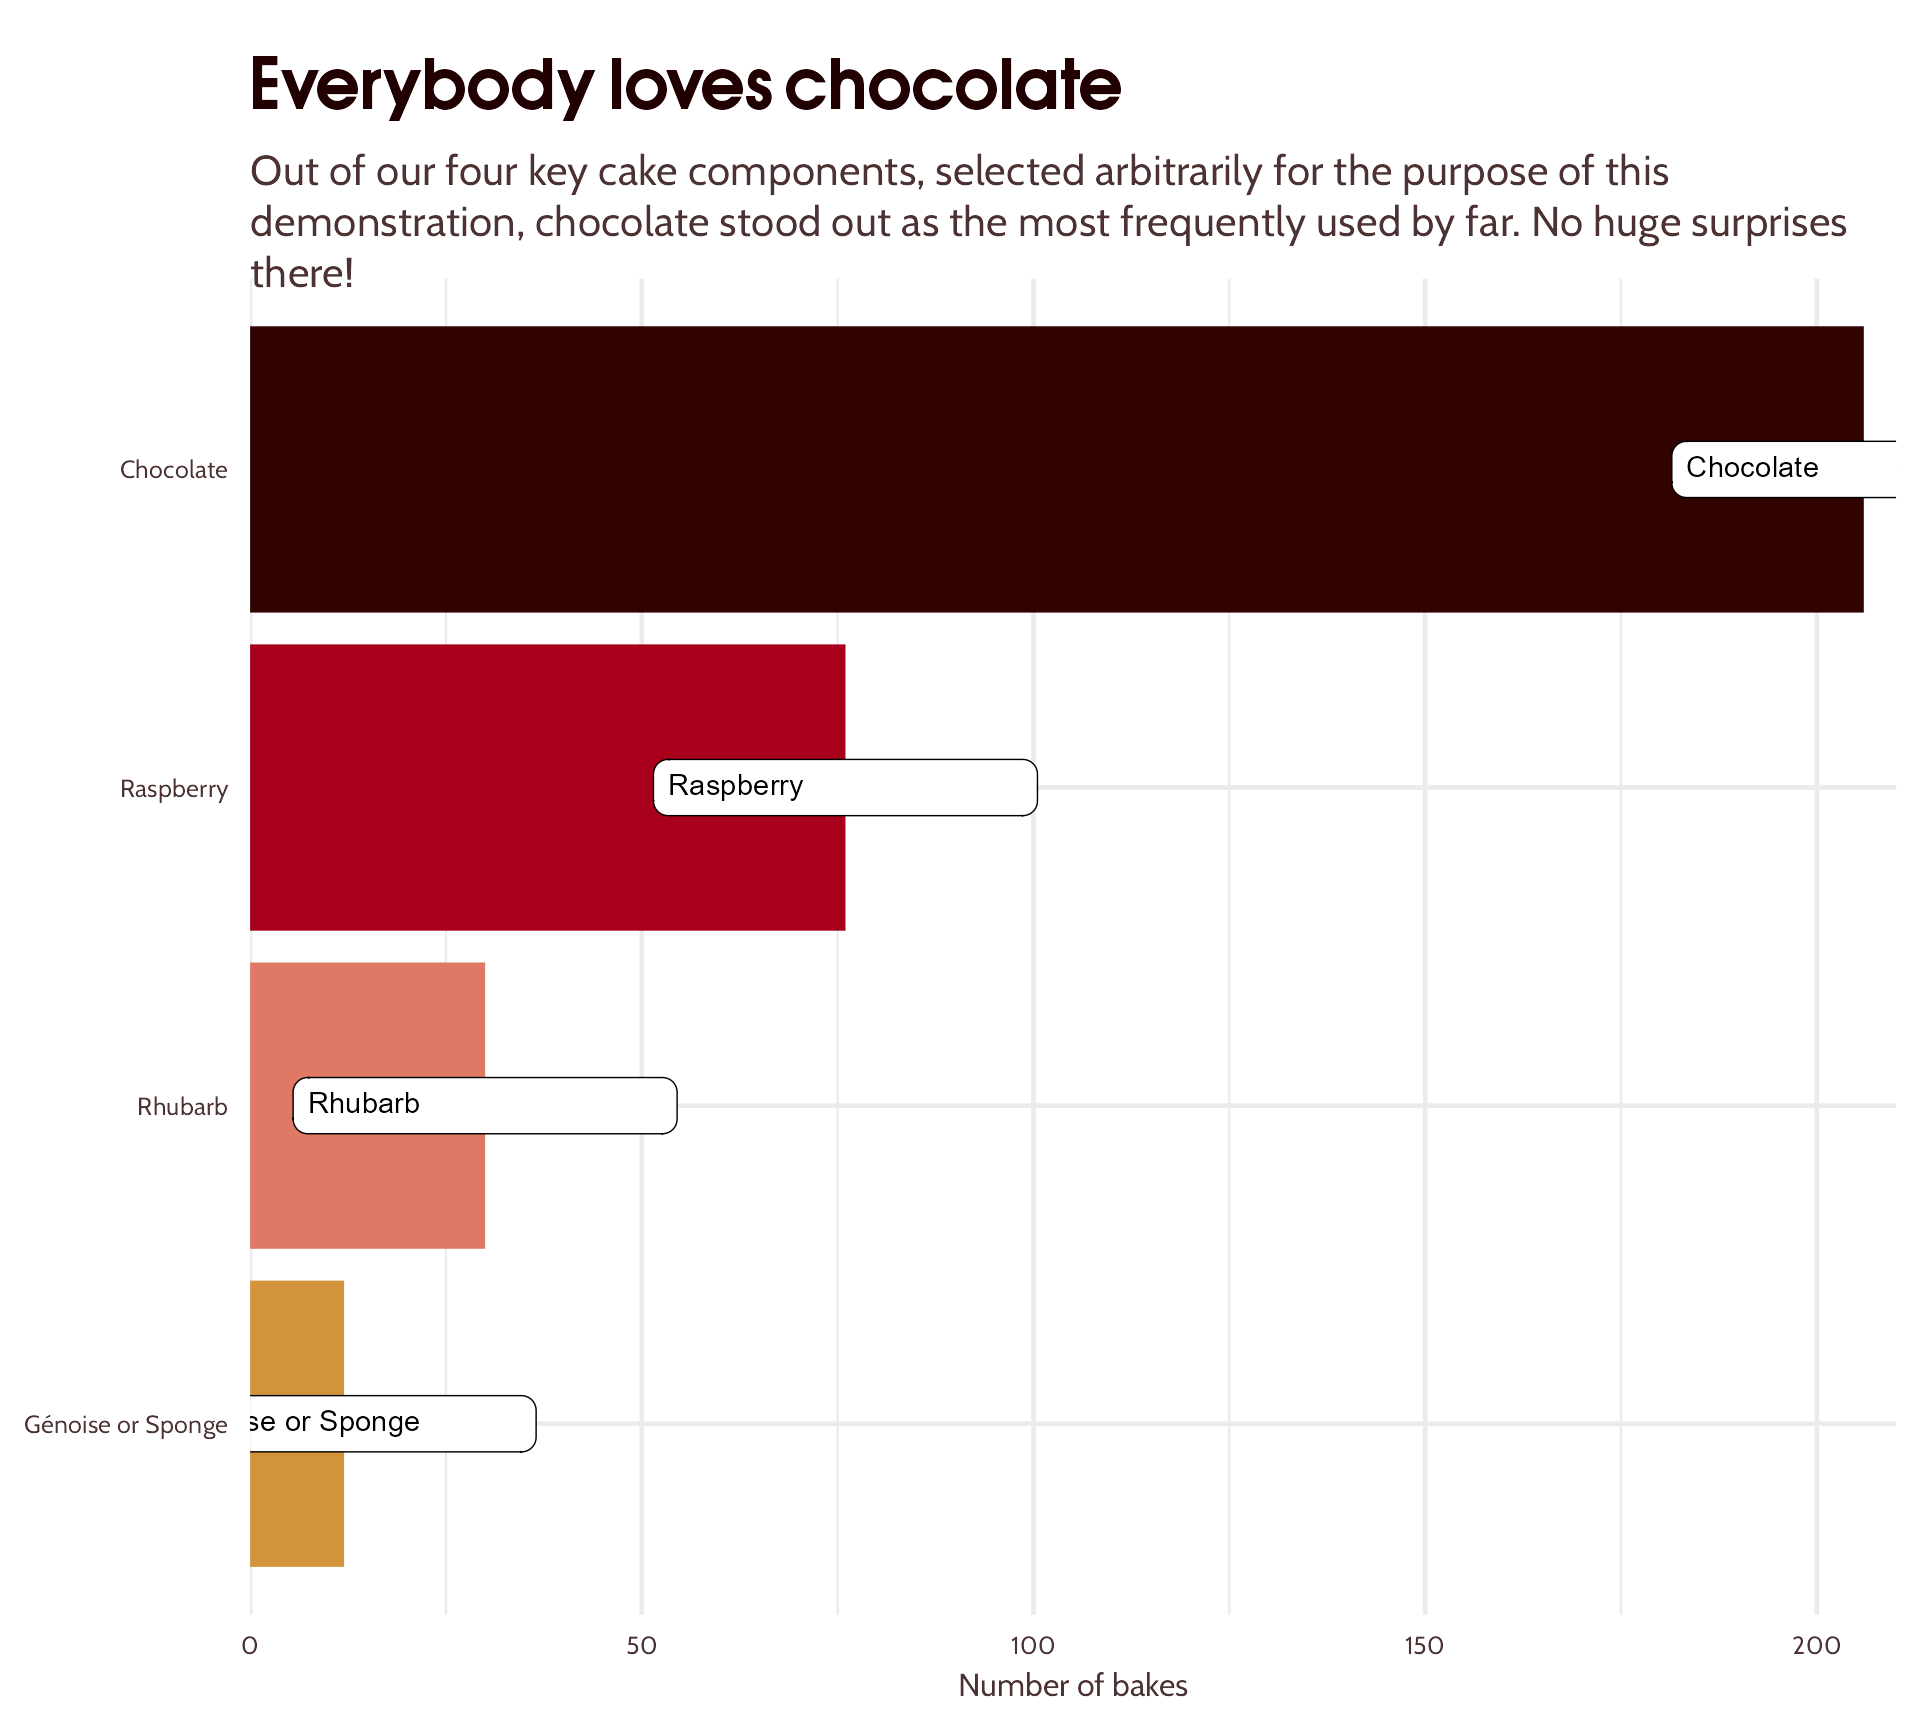
Conditional alignments!
#3 Reduce unnecessary eye movement
Conditional alignments & colour
bar_plot_text_hierarchy +
scale_y_continuous(expand = expansion(c(0, 0.02))) +
ggtext::geom_textbox(aes(label = component,
hjust = case_when(count < 50 ~ 0,
TRUE ~ 1),
halign = case_when(count < 50 ~ 0,
TRUE ~ 1),
colour = case_when(count < 50 ~ "#4C3232",
TRUE ~ "white")),
size = 7,
fill = "white")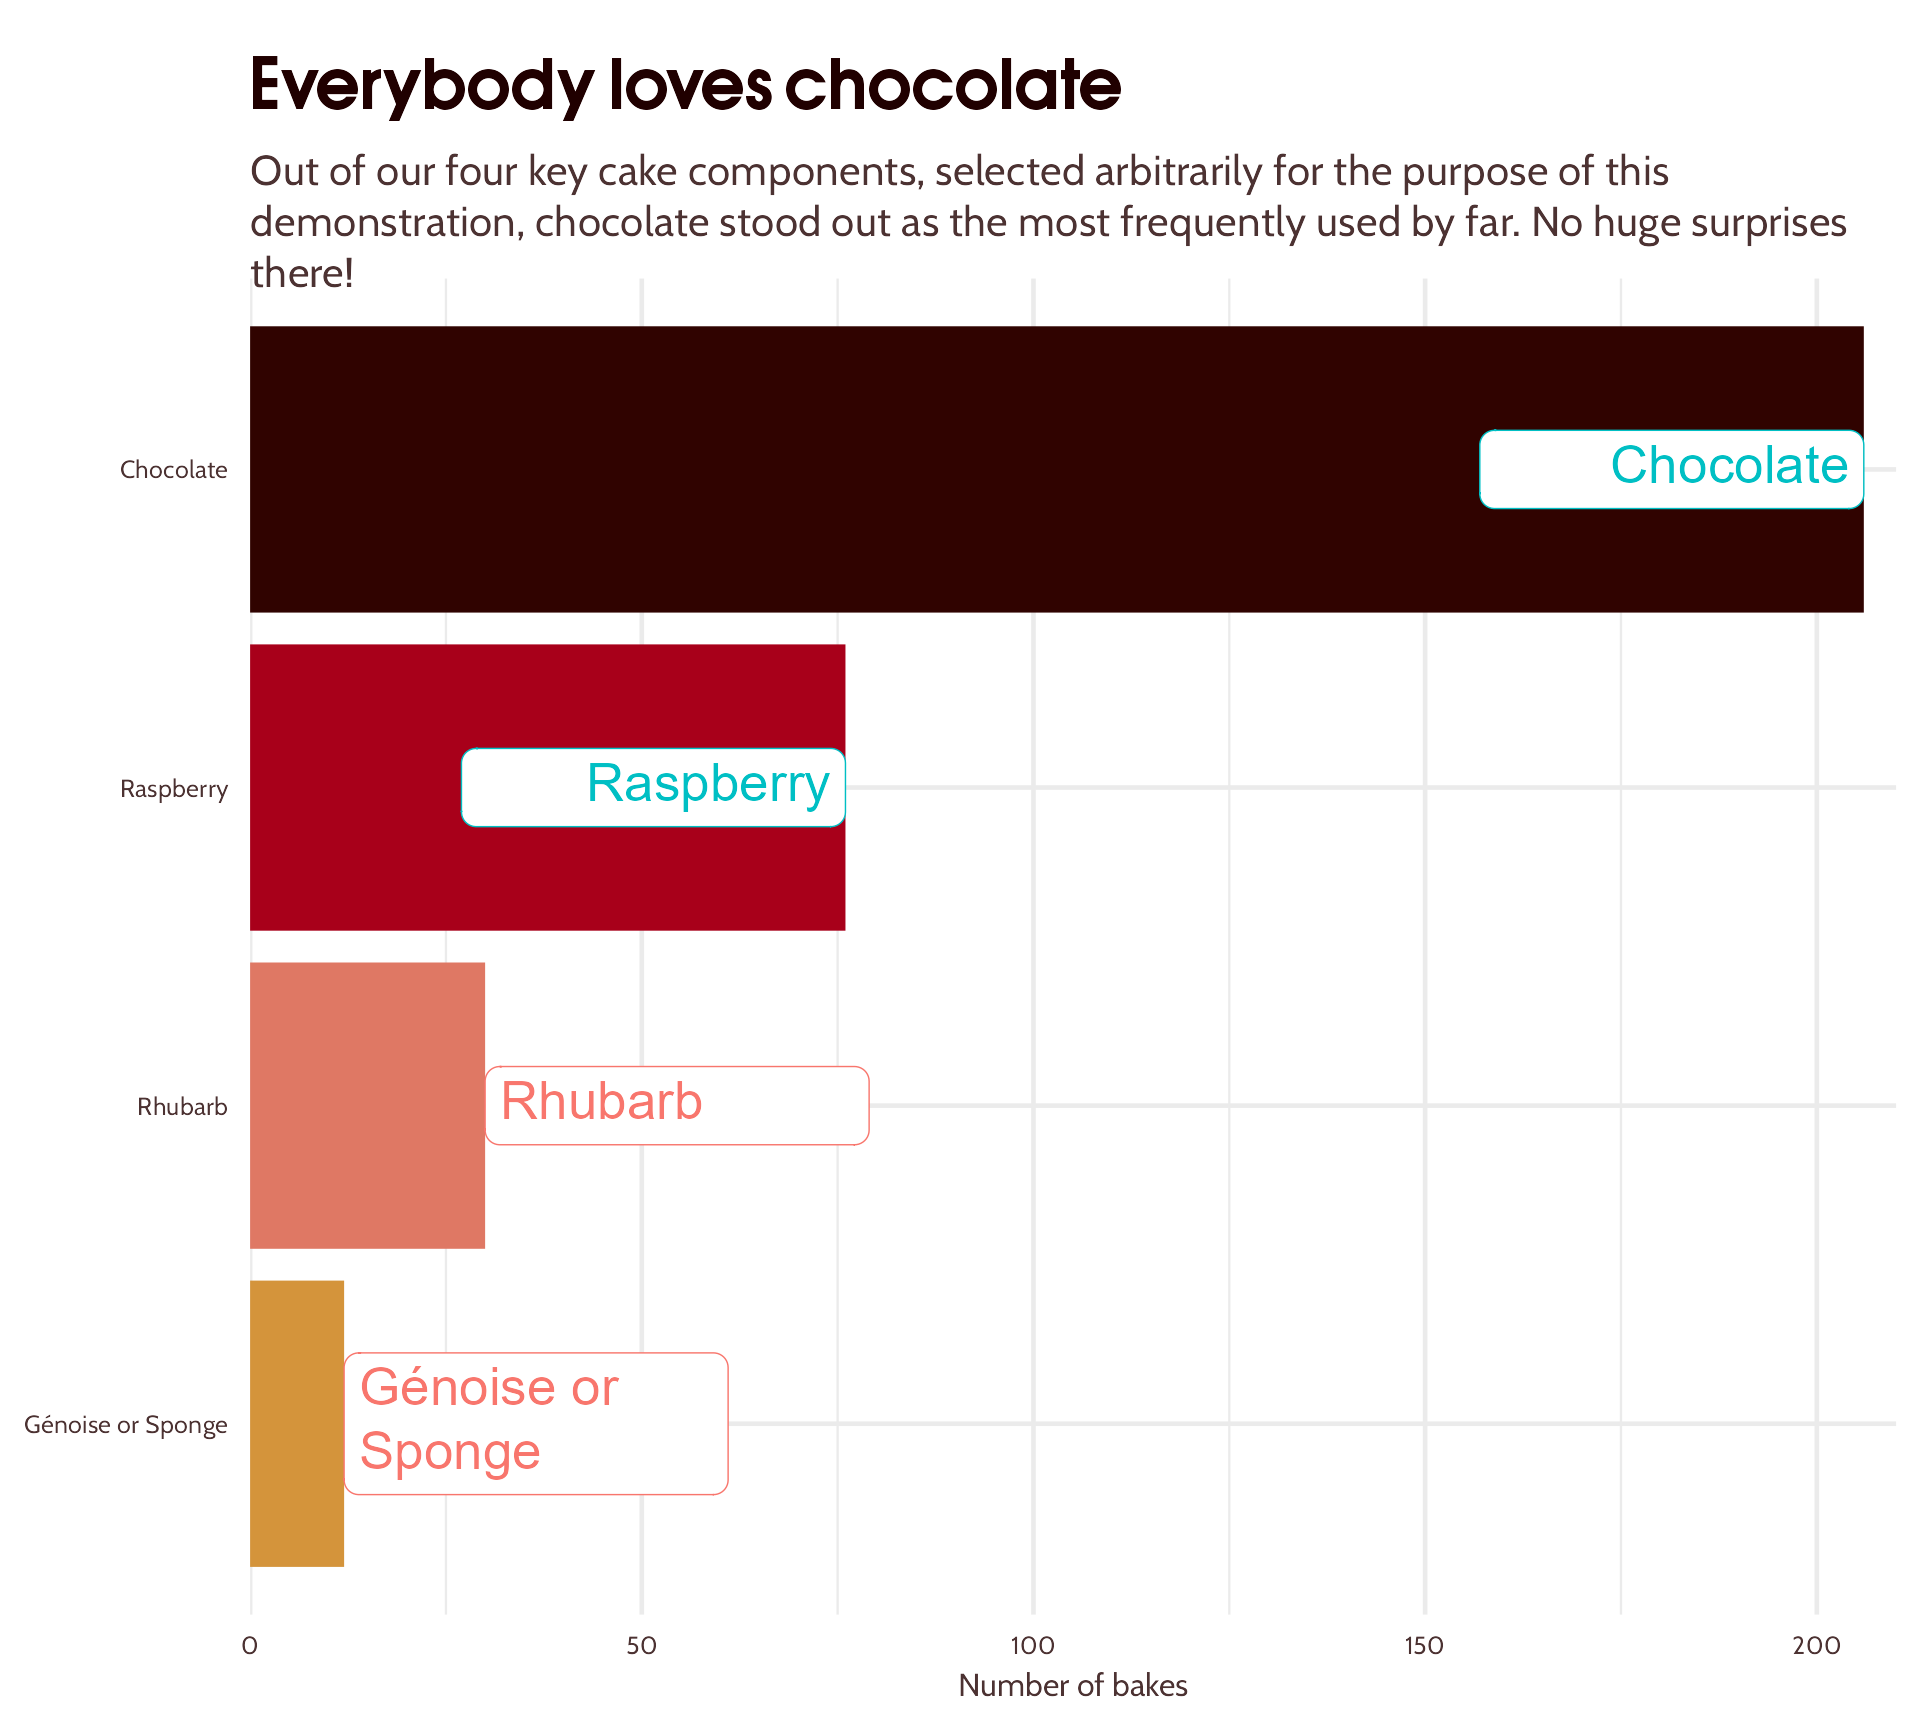
#3 Reduce unnecessary eye movement
Conditional alignments & colour
bar_plot_text_hierarchy +
scale_y_continuous(expand = expansion(c(0, 0.02))) +
ggtext::geom_textbox(aes(label = component,
hjust = case_when(count < 50 ~ 0,
TRUE ~ 1),
halign = case_when(count < 50 ~ 0,
TRUE ~ 1),
colour = case_when(count < 50 ~ "#4C3232",
TRUE ~ "white")),
size = 7,
fill = "white") +
scale_colour_identity()
#3 Reduce unnecessary eye movement
Bring in our fonts and colours
bar_plot_text_hierarchy +
scale_y_continuous(expand = expansion(c(0, 0.02))) +
ggtext::geom_textbox(aes(label = component,
hjust = case_when(count < 50 ~ 0,
TRUE ~ 1),
halign = case_when(count < 50 ~ 0,
TRUE ~ 1),
colour = case_when(count < 50 ~ "#4C3232",
TRUE ~ "white")),
fill = NA,
box.colour = NA,
family = "Cabin",
size = 7,
fontface = "bold") +
scale_colour_identity()
#3 Reduce unnecessary eye movement
Do we need that text?
bar_plot_text_hierarchy +
scale_y_continuous(expand = expansion(c(0, 0.02))) +
ggtext::geom_textbox(aes(label = component,
hjust = case_when(count < 50 ~ 0,
TRUE ~ 1),
halign = case_when(count < 50 ~ 0,
TRUE ~ 1),
colour = case_when(count < 50 ~ "#4C3232",
TRUE ~ "white")),
fill = NA,
box.colour = NA,
family = "Cabin",
size = 7,
fontface = "bold") +
scale_colour_identity() +
theme(axis.text.y = element_blank())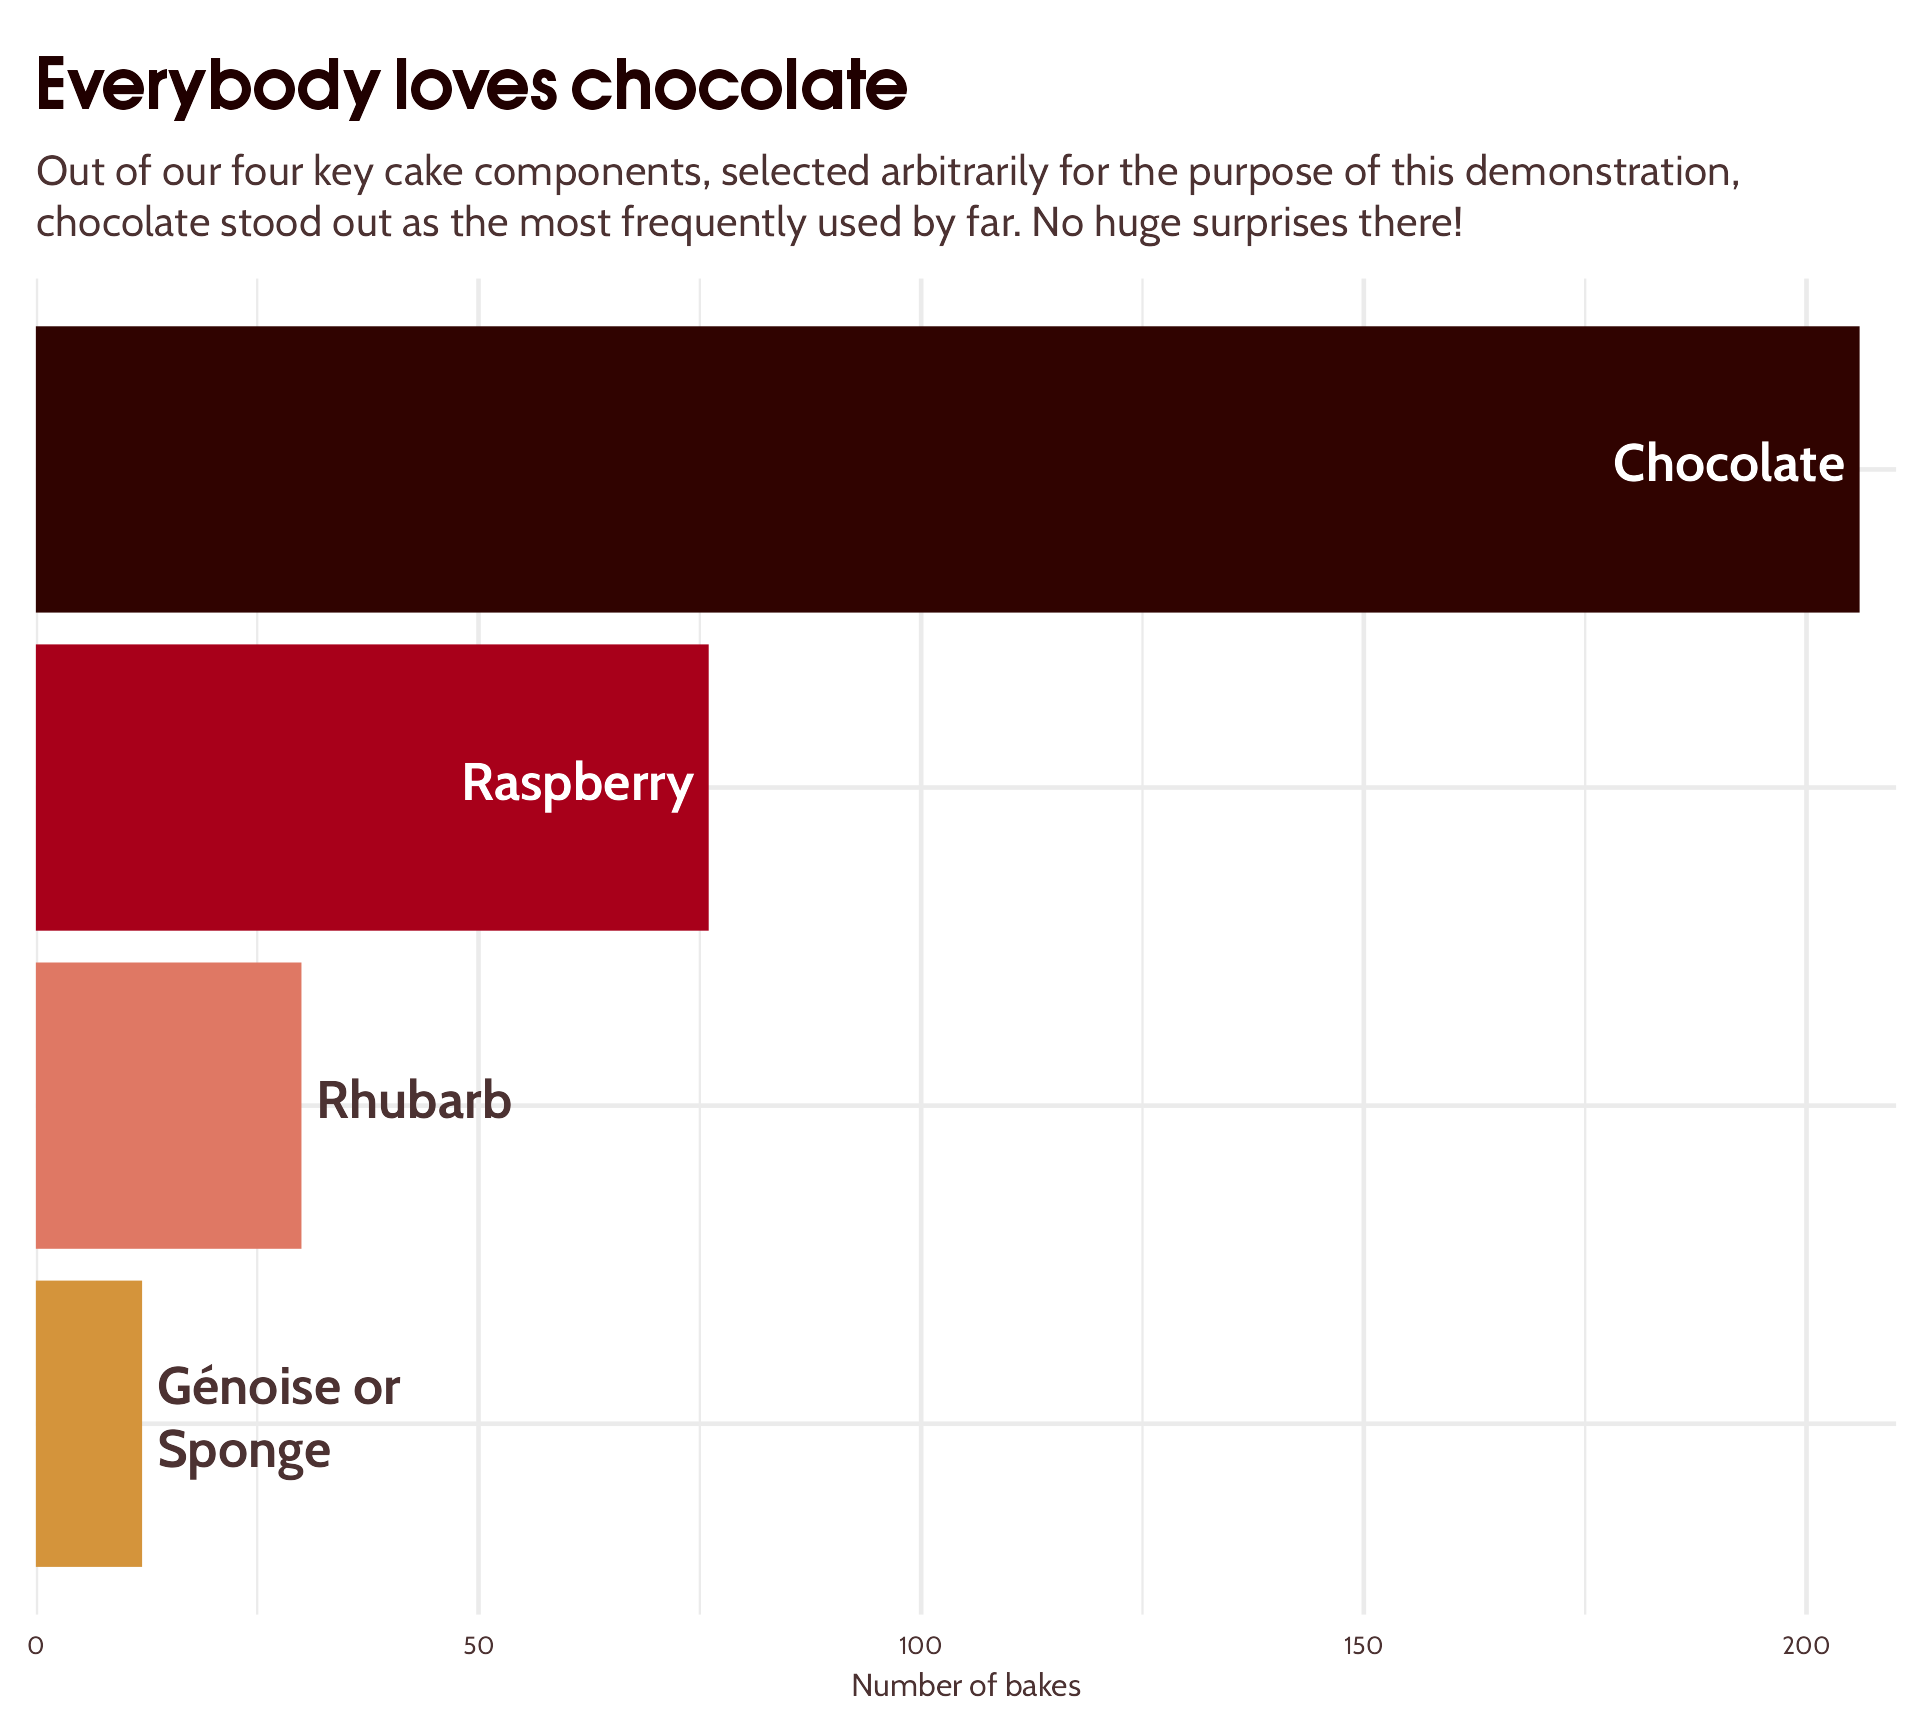
#3 Reduce unnecessary eye movement
Could we make our labels more informative?
bar_plot_text_hierarchy +
scale_y_continuous(expand = expansion(c(0, 0.02))) +
ggtext::geom_textbox(aes(label = paste0(component,
"<br><span style='font-size:32pt'>",
count,
"</span>"),
hjust = case_when(count < 50 ~ 0,
TRUE ~ 1),
halign = case_when(count < 50 ~ 0,
TRUE ~ 1),
colour = case_when(count < 50 ~ "#4C3232",
TRUE ~ "white")),
fill = NA,
box.colour = NA,
family = "Cabin",
size = 7,
fontface = "bold") +
scale_colour_identity() +
theme(axis.text.y = element_blank())
#3 Reduce unnecessary eye movement
Alignment tweak
bar_plot_text_hierarchy +
scale_y_continuous(expand = expansion(c(0, 0.02))) +
ggtext::geom_textbox(aes(label = paste0(component,
"<span style='font-size:32pt'><br>",
count,
"</span>"),
hjust = case_when(count < 50 ~ 0,
TRUE ~ 1),
halign = case_when(count < 50 ~ 0,
TRUE ~ 1),
colour = case_when(count < 50 ~ "#4C3232",
TRUE ~ "white")),
vjust = 0.45,
fill = NA,
box.colour = NA,
family = "Cabin",
size = 7,
fontface = "bold") +
scale_colour_identity() +
theme(axis.text.y = element_blank())
#3 Reduce unnecessary eye movement
Do we need the rest of this?
bar_plot_text_hierarchy +
scale_y_continuous(expand = expansion(c(0, 0.02))) +
ggtext::geom_textbox(aes(label = paste0(component,
" bakes<span style='font-size:32pt'><br>",
count,
"</span>"),
hjust = case_when(count < 50 ~ 0,
TRUE ~ 1),
halign = case_when(count < 50 ~ 0,
TRUE ~ 1),
colour = case_when(count < 50 ~ "#4C3232",
TRUE ~ "white")),
vjust = 0.45,
fill = NA,
box.colour = NA,
family = "Cabin",
size = 7,
fontface = "bold") +
scale_colour_identity() +
theme(axis.text.y = element_blank(),
axis.text.x = element_blank(),
axis.title.x = element_blank(),
panel.grid = element_blank())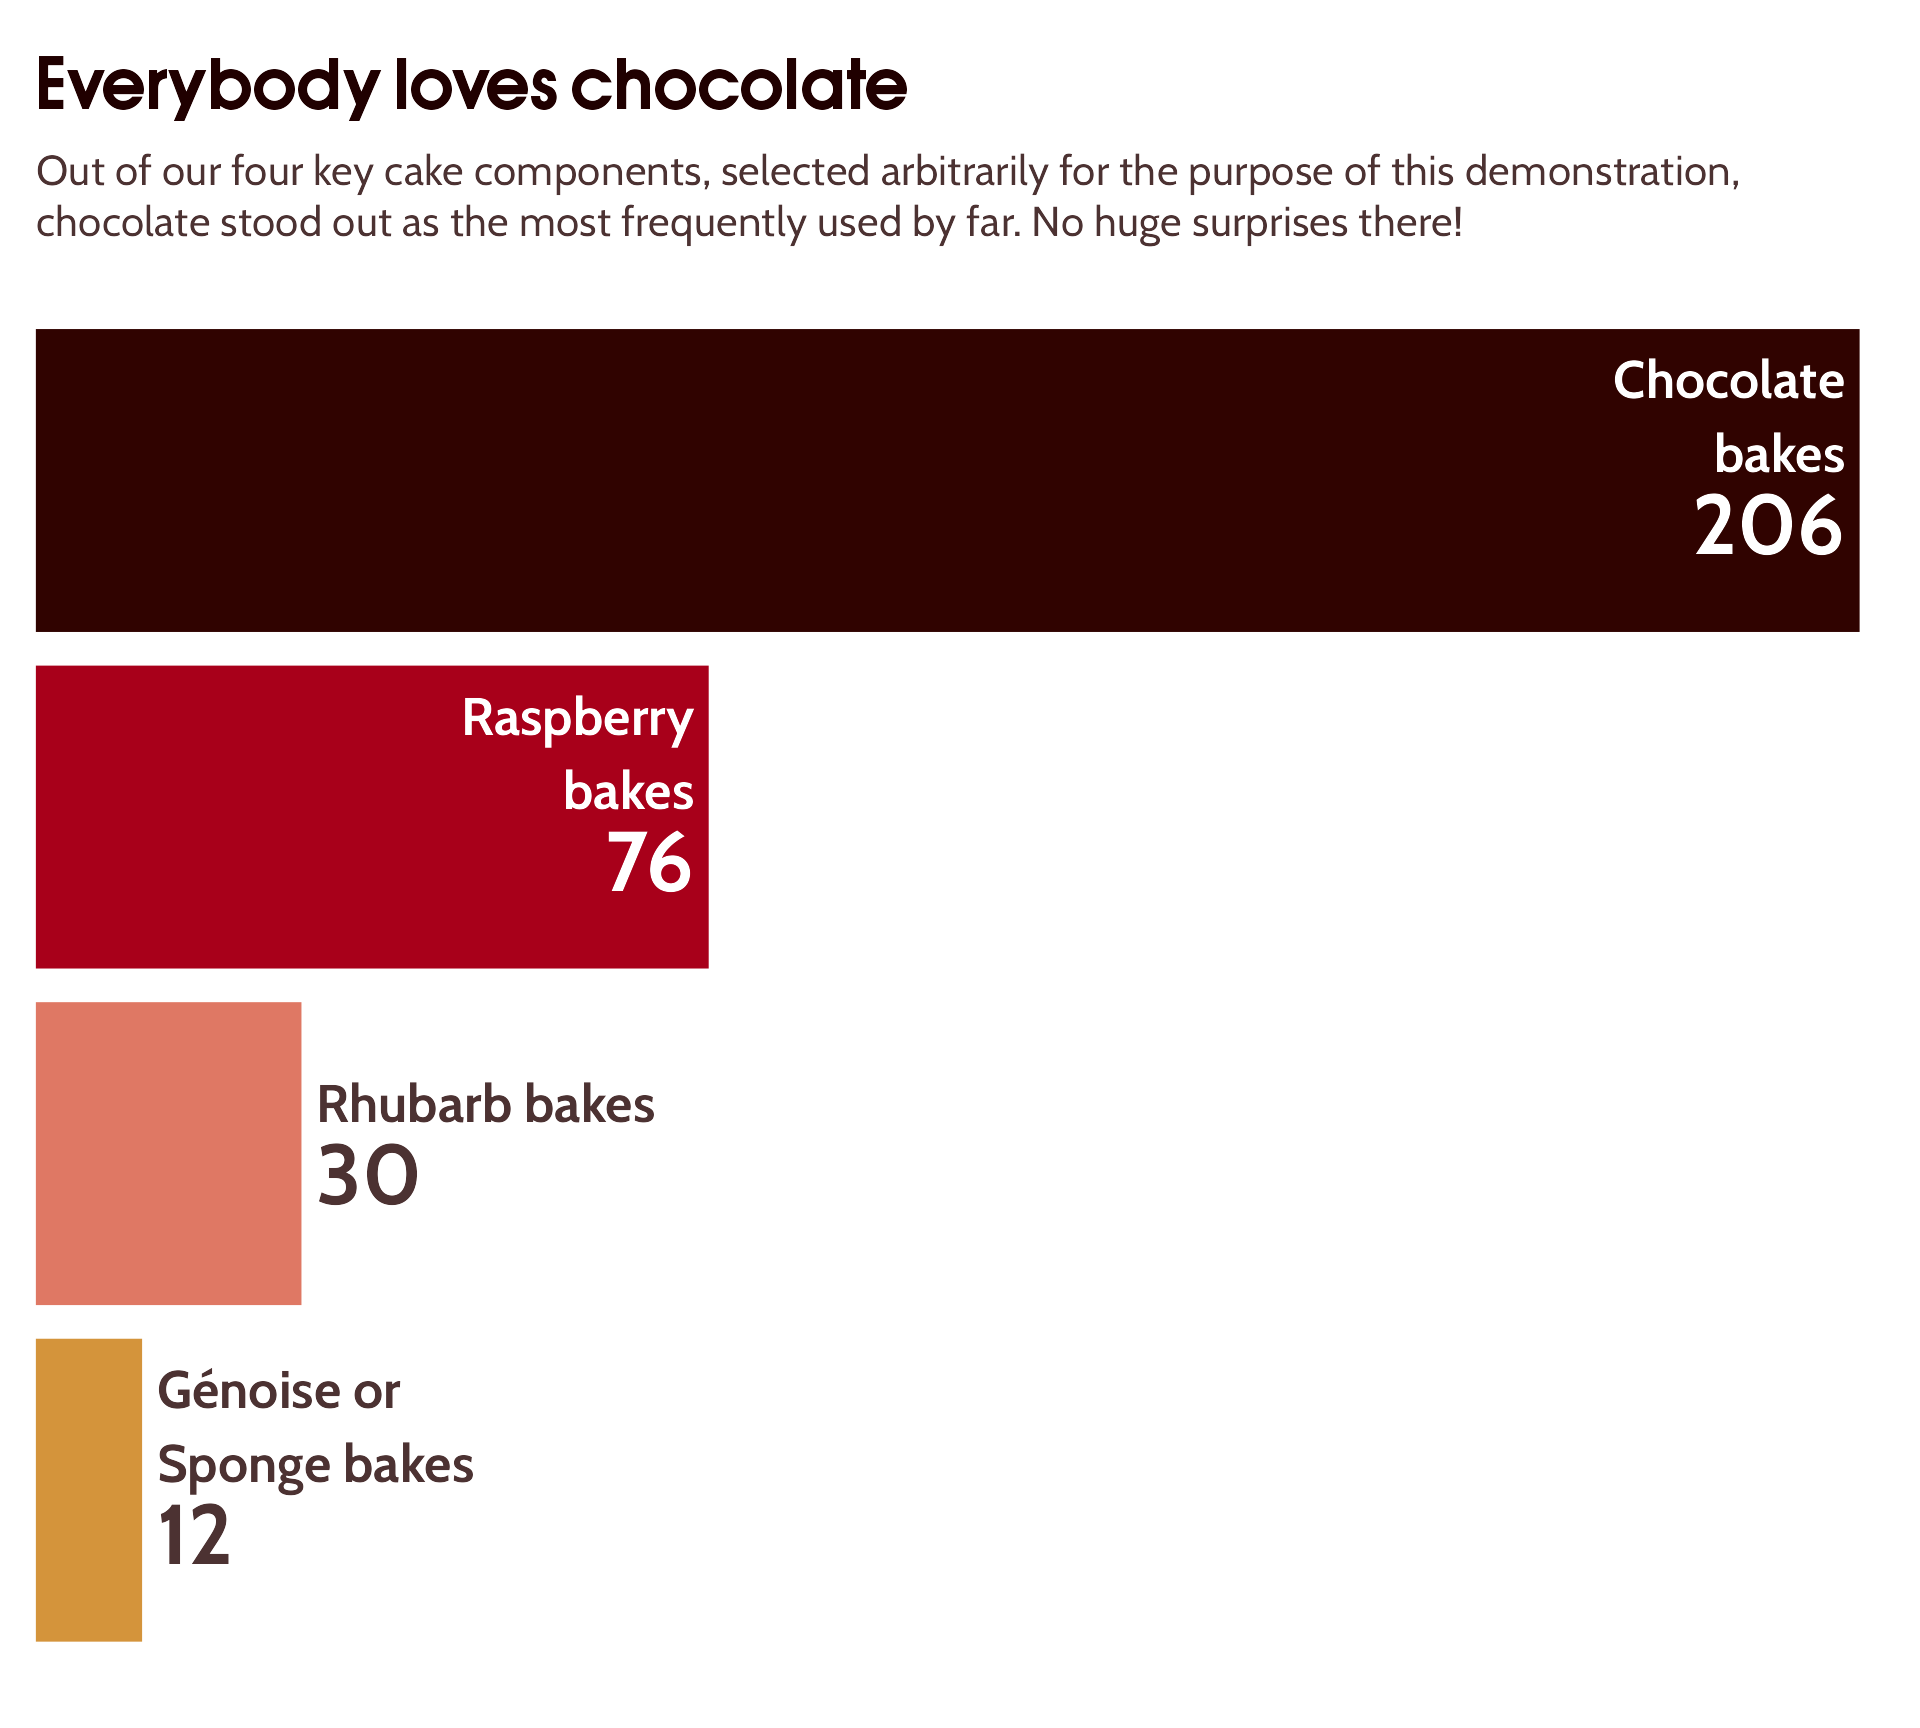
#3 Reduce unnecessary eye movement
How would I actually say that?
bar_plot_text_hierarchy +
scale_y_continuous(expand = expansion(c(0, 0.02))) +
ggtext::geom_textbox(aes(label = paste0("<span style='font-size:32pt'><br>",
count,
"<br></span>",
component, " bakes"),
hjust = case_when(count < 50 ~ 0,
TRUE ~ 1),
halign = case_when(count < 50 ~ 0,
TRUE ~ 1),
colour = case_when(count < 50 ~ "#4C3232",
TRUE ~ "white")),
vjust = 0.45,
fill = NA,
box.colour = NA,
family = "Cabin",
size = 7,
fontface = "bold") +
scale_colour_identity() +
theme(axis.text.y = element_blank(),
plot.title.position = "plot",
axis.text.x = element_blank(),
axis.title.x = element_blank(),
panel.grid = element_blank())
#3 Reduce unnecessary eye movement

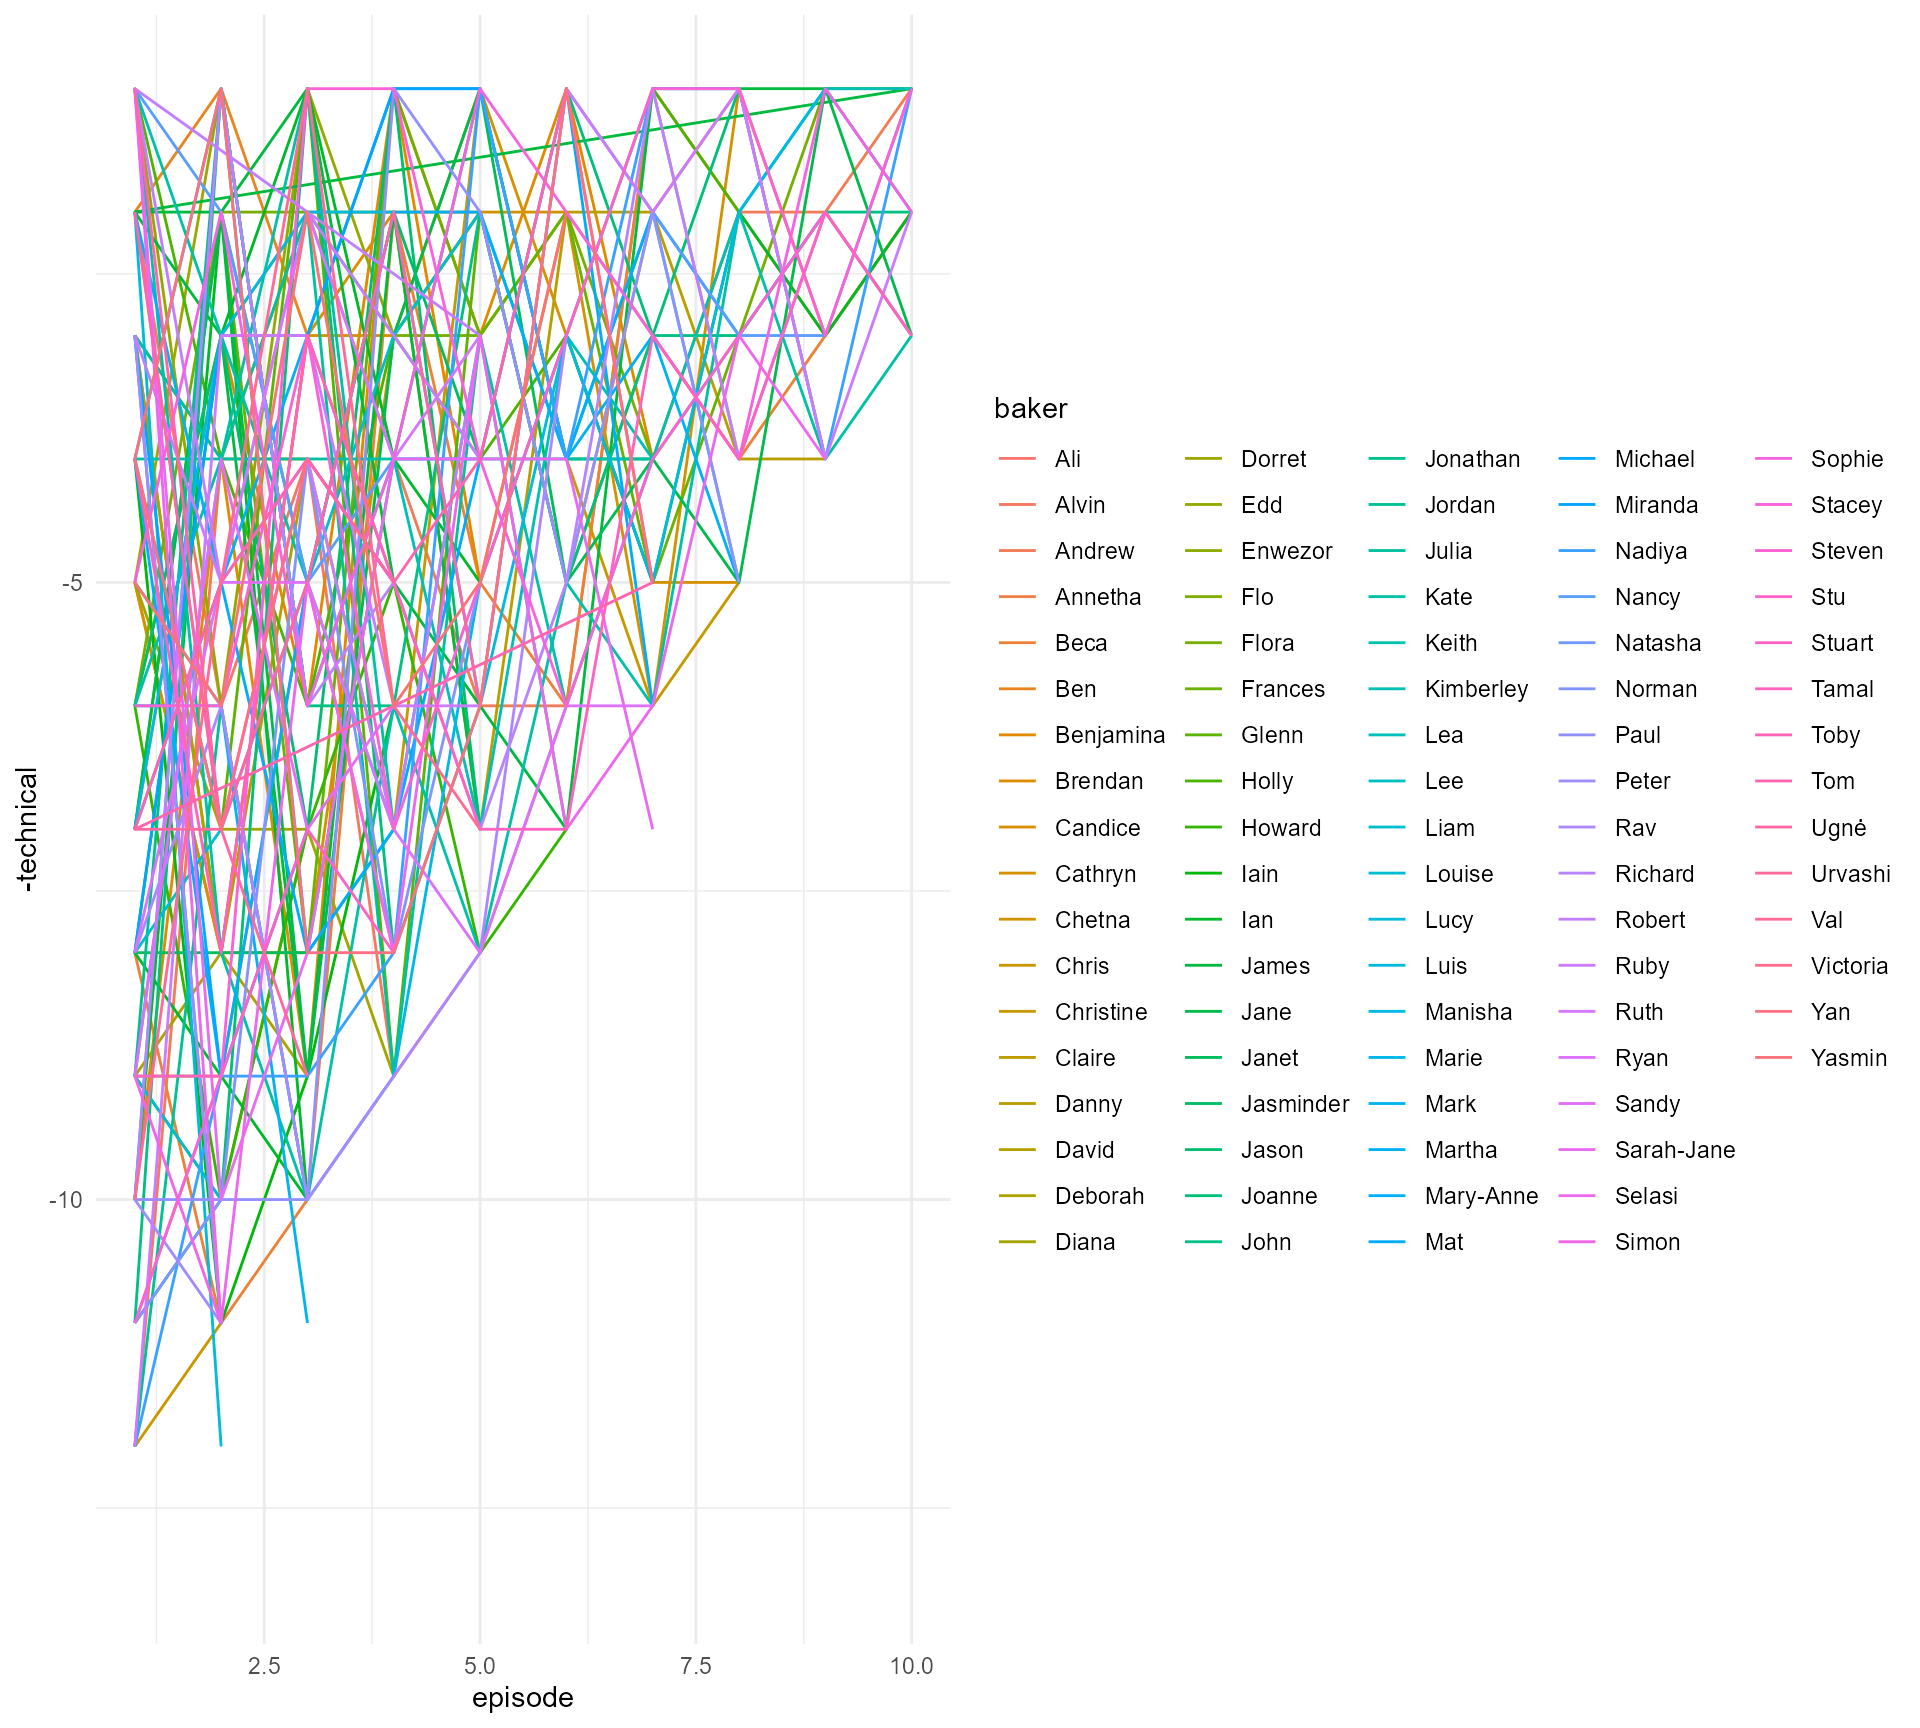
#4 Declutter, declutter, declutter
#4 Declutter, declutter, declutter
#4 Declutter, declutter, declutter
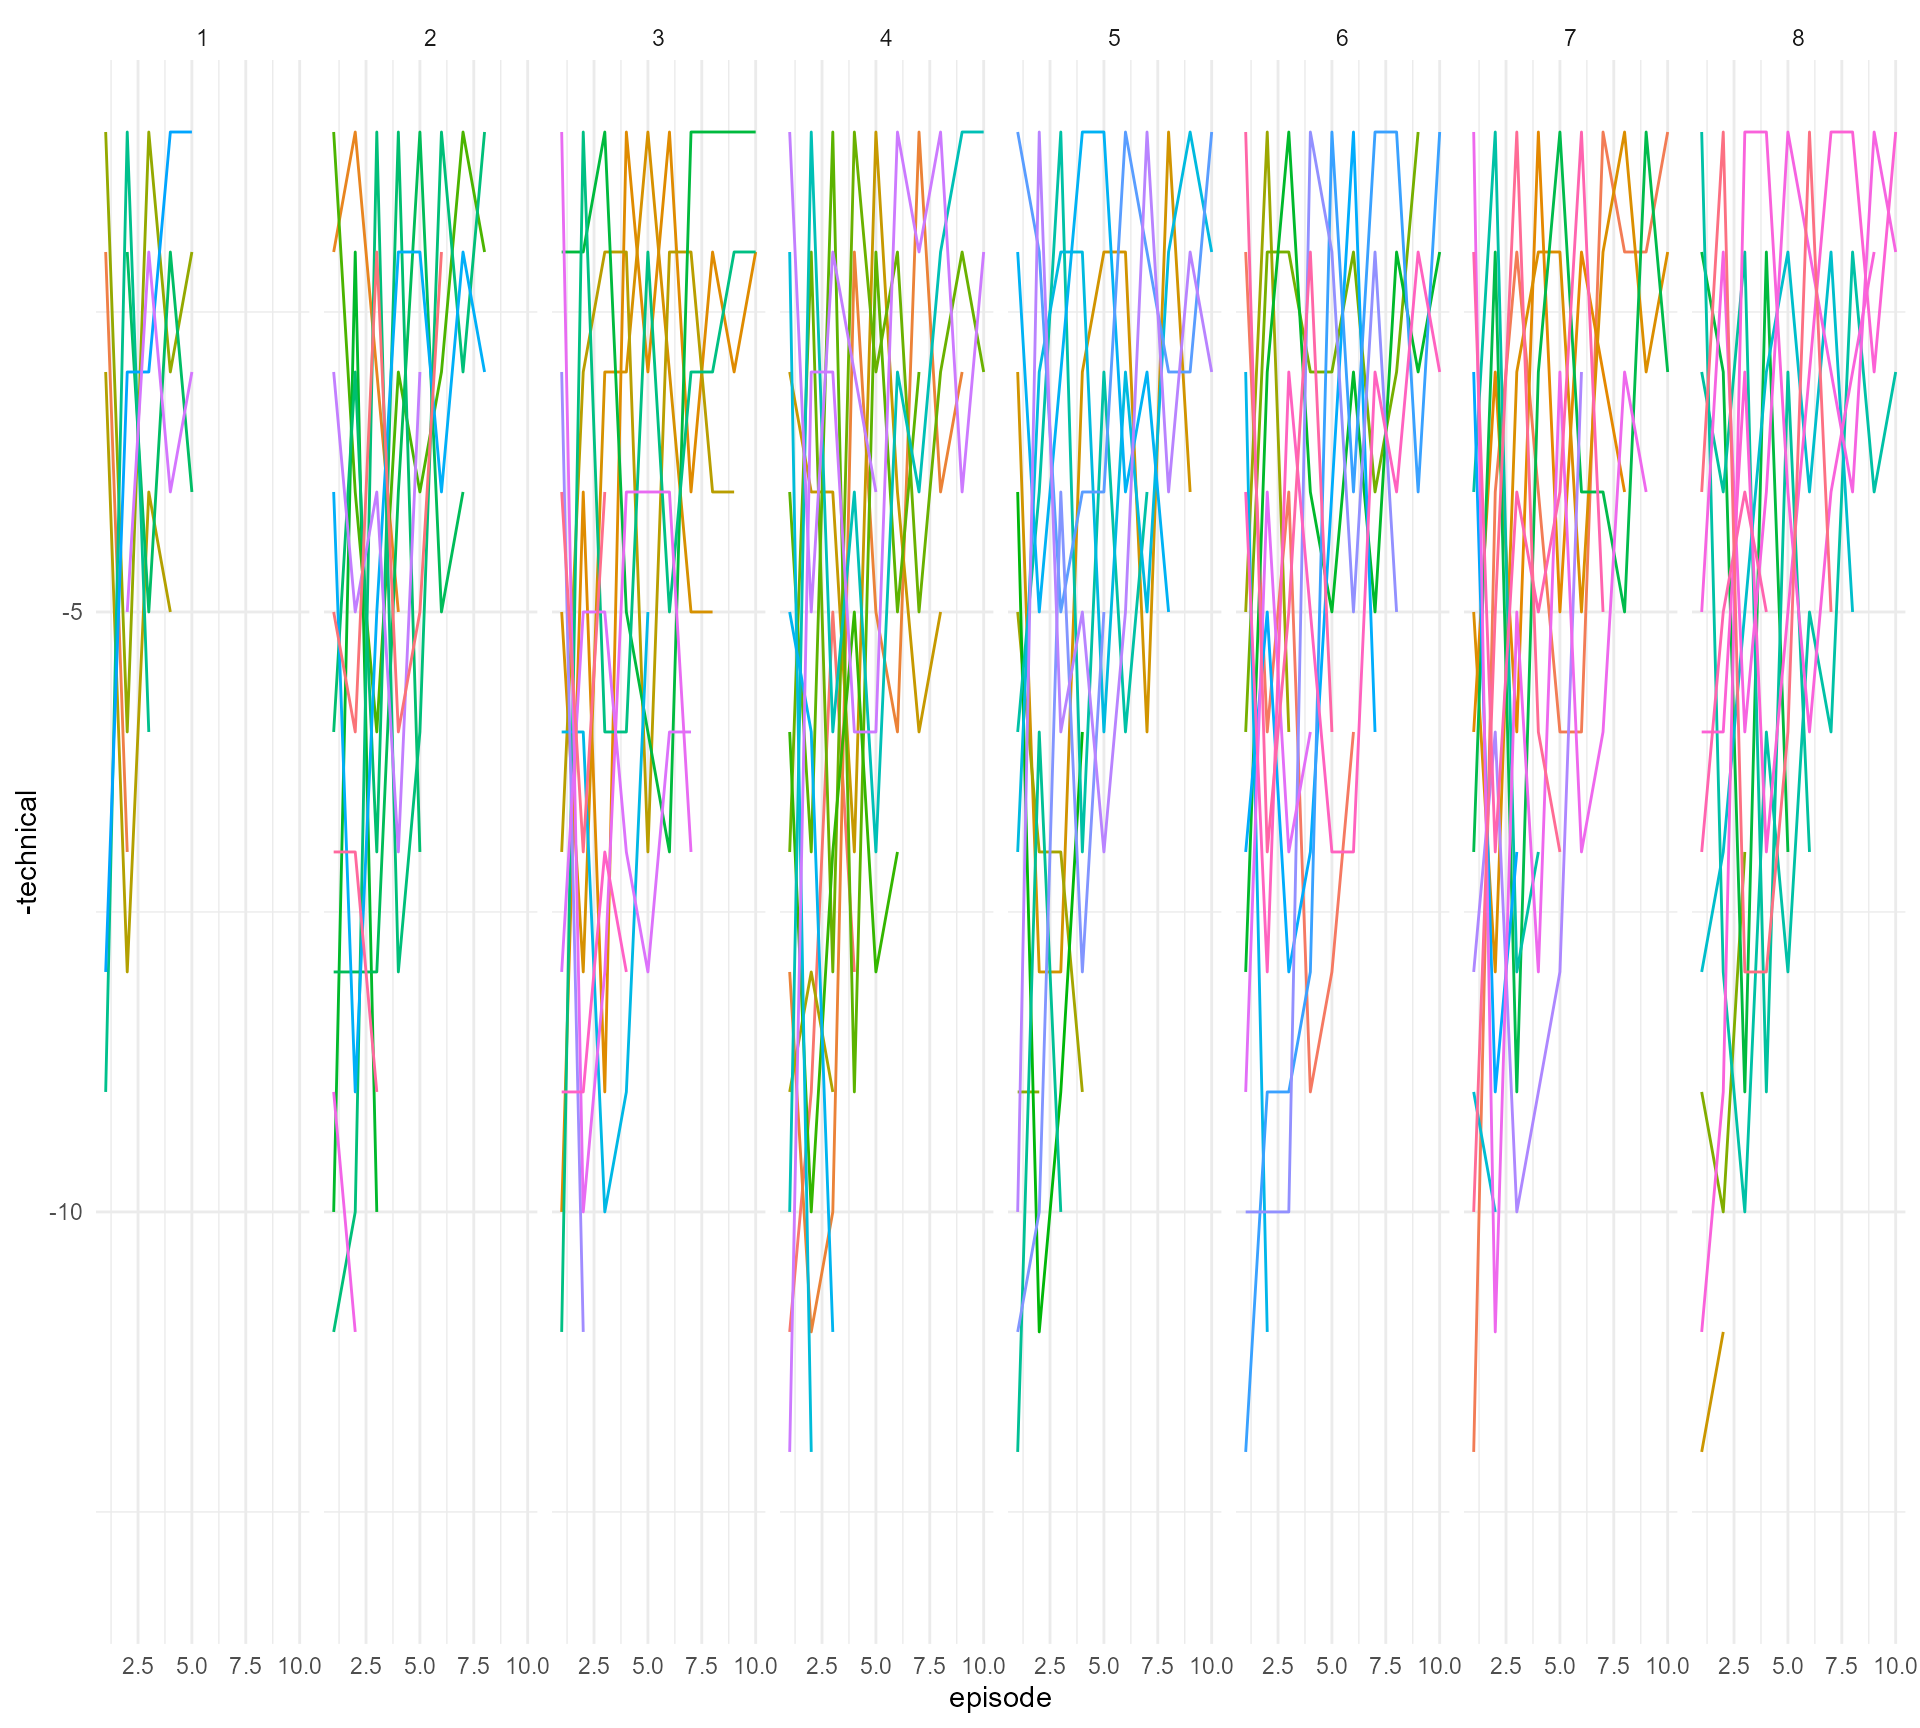
#4 Declutter, declutter, declutter
Try facets on less data?

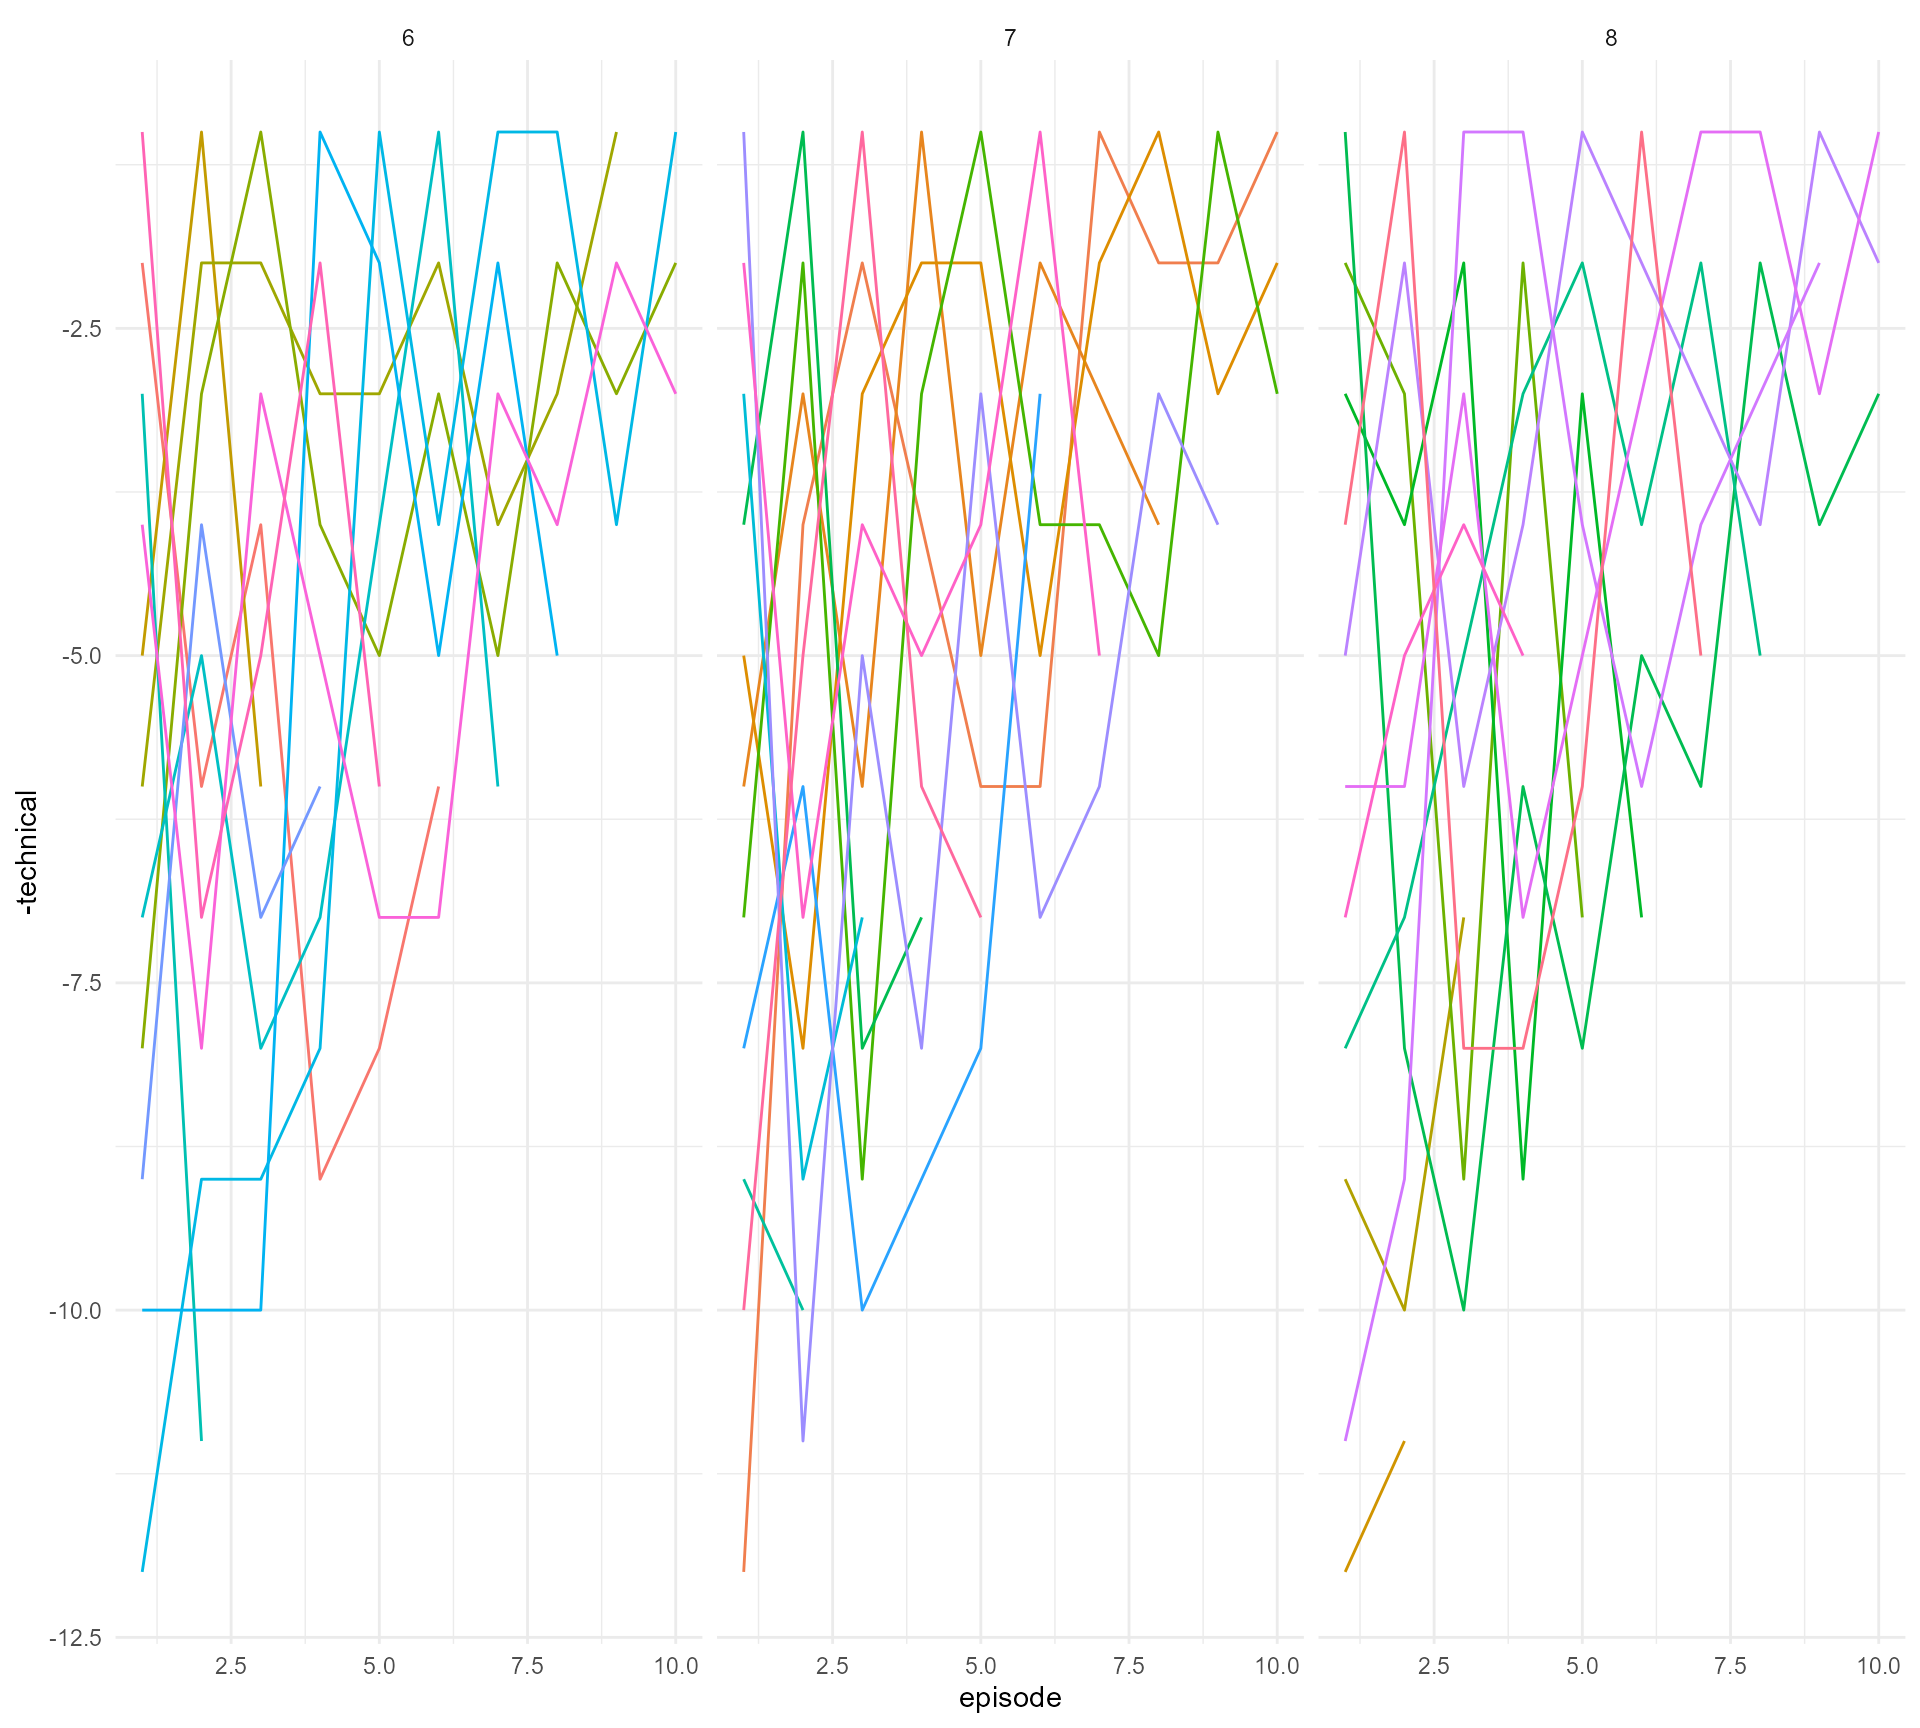
#4 Declutter, declutter, declutter
Enter {gghighlight}
bakeoff::bakes_raw %>%
filter(series %in% c(6:8)) %>%
left_join(bakeoff::bakers %>%
filter(series_winner == 1)) %>%
ggplot(aes(x = episode,
y = -technical)) +
geom_path(aes(colour = baker),
show.legend = FALSE) +
gghighlight::gghighlight(series_winner == 1) +
facet_grid(. ~ series) +
theme_minimal()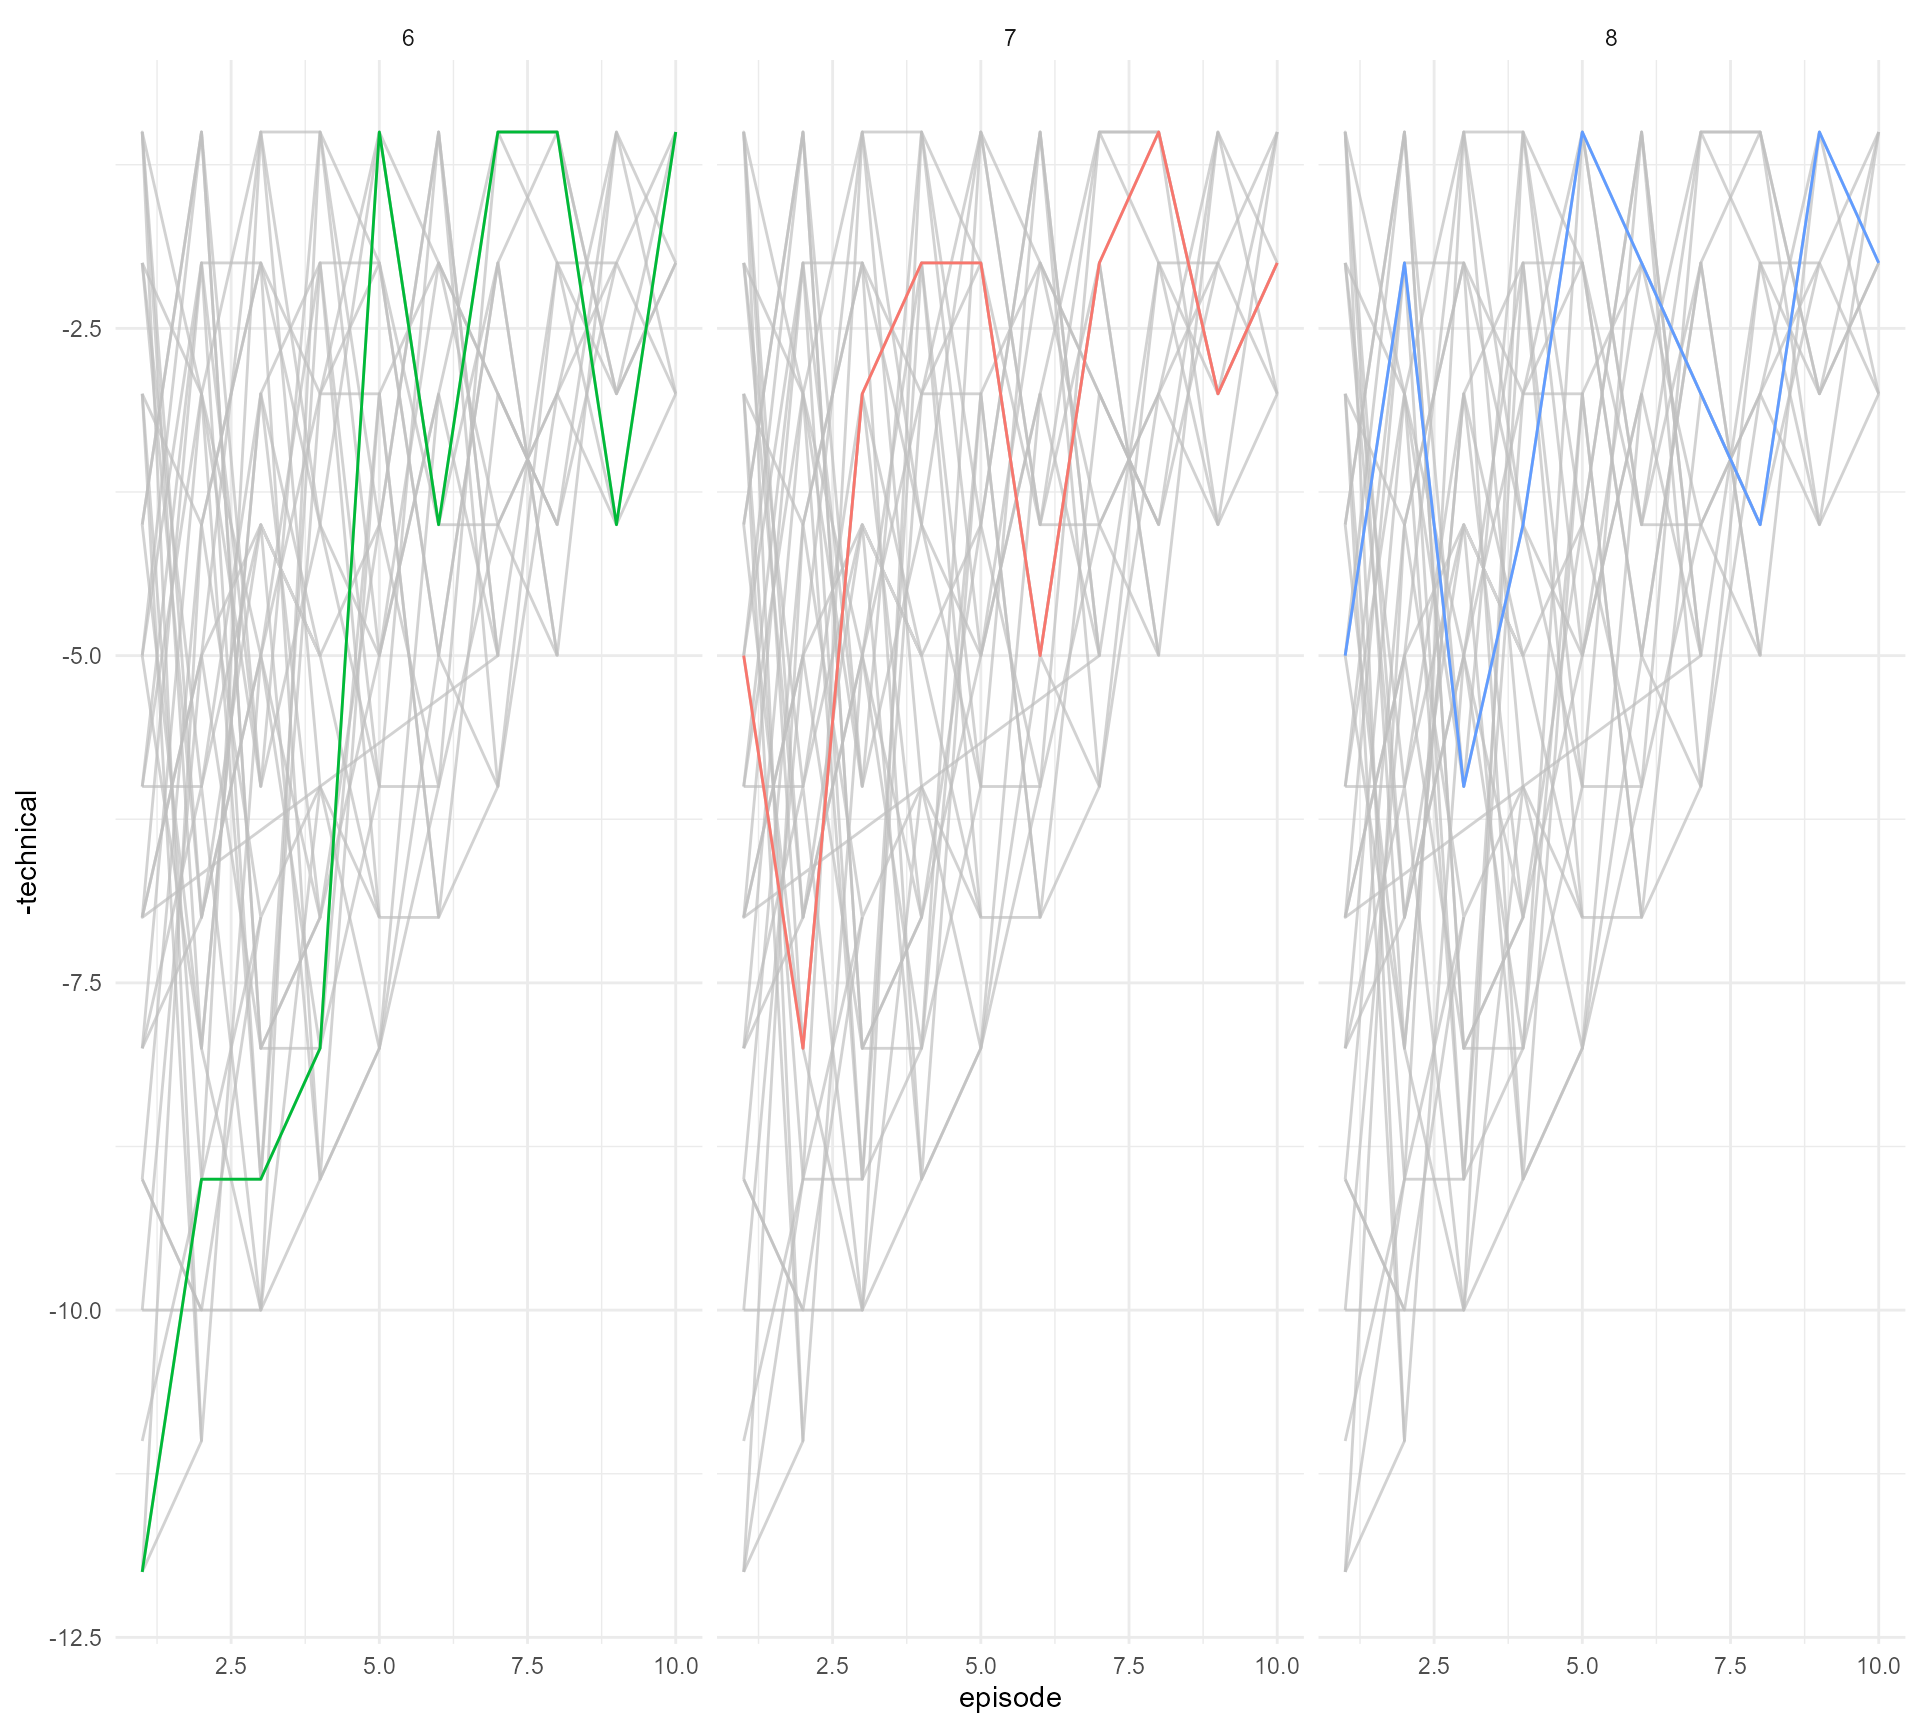
#4 Declutter, declutter, declutter
Enter {gghighlight} - calculate_per_facet
bakeoff::bakes_raw %>%
filter(series %in% c(6:8)) %>%
left_join(bakeoff::bakers %>%
filter(series_winner == 1)) %>%
ggplot(aes(x = episode,
y = -technical)) +
geom_path(aes(colour = baker),
show.legend = FALSE) +
gghighlight::gghighlight(series_winner == 1,
calculate_per_facet = TRUE) +
facet_grid(. ~ series) +
theme_minimal()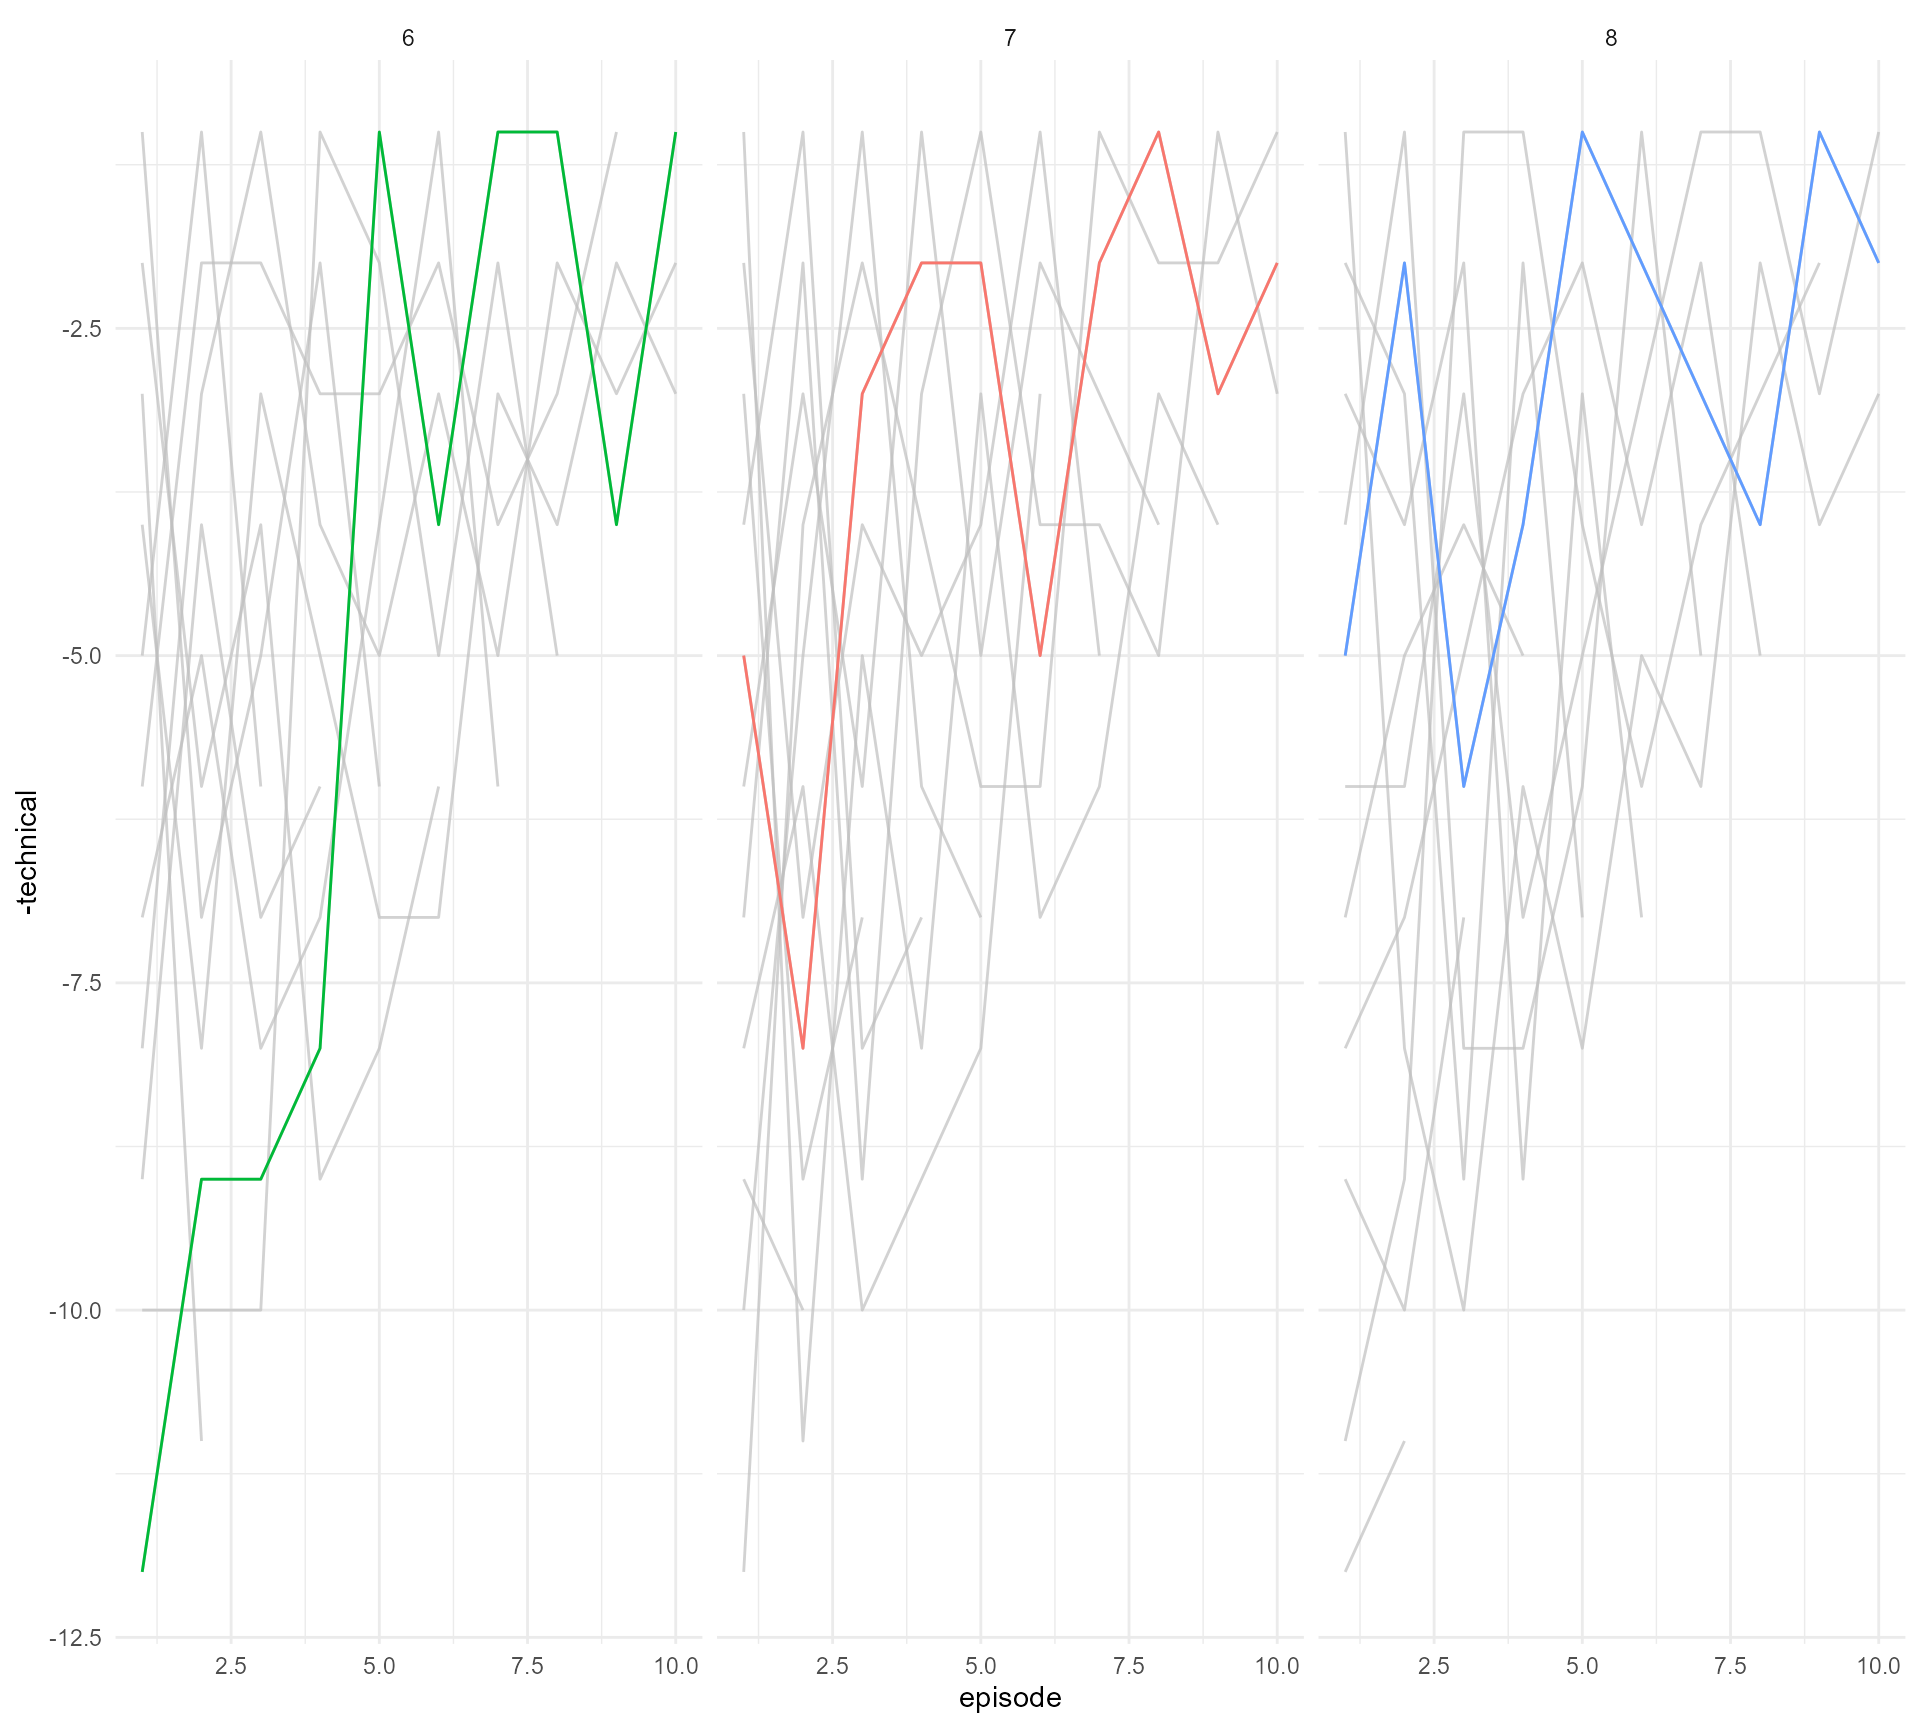
#4 Declutter, declutter, declutter
Enter {gghighlight} - calculate_per_facet
bakeoff::bakes_raw %>%
filter(series %in% c(6:8)) %>%
left_join(bakeoff::bakers %>%
filter(series_winner == 1)) %>%
ggplot(aes(x = episode,
y = -technical)) +
geom_path(aes(colour = series),
show.legend = FALSE) +
gghighlight::gghighlight(series_winner == 1,
calculate_per_facet = TRUE) +
scale_colour_gradient2(low = "#e04121", mid = "#f7238a",
high = "#ed9e00", midpoint = 7) +
facet_grid(. ~ series) +
theme_minimal()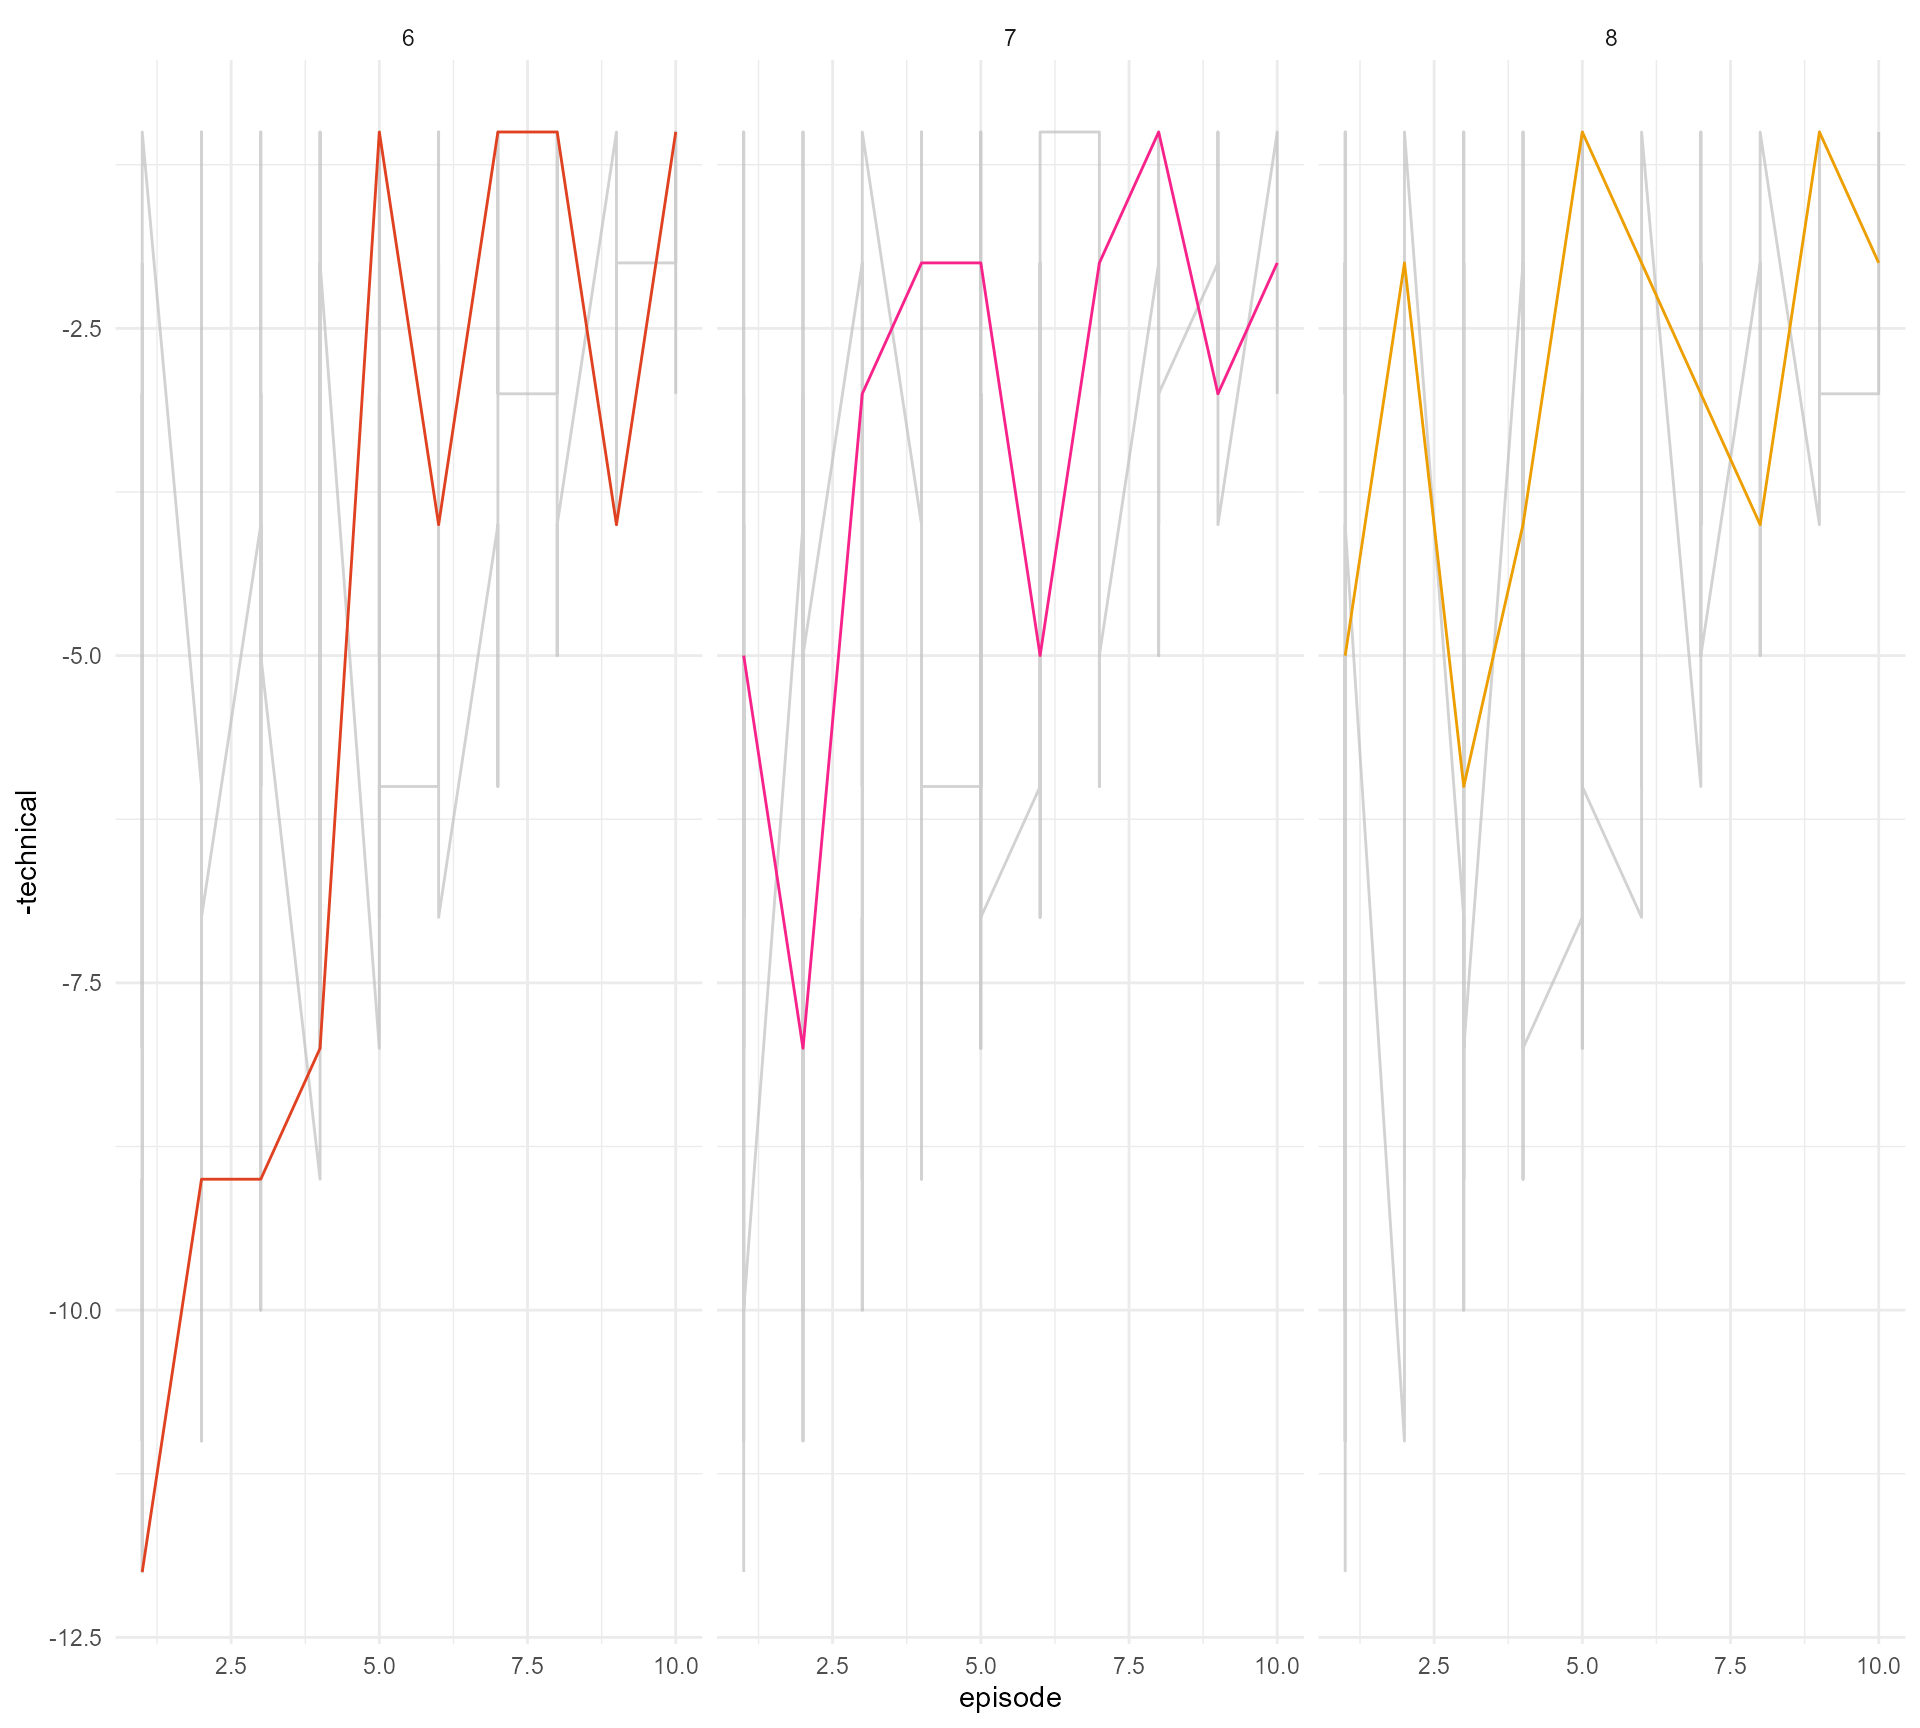
#4 Declutter, declutter, declutter
I ❤️ {geomtextpath}
bakeoff::bakes_raw %>%
filter(series %in% c(6:8)) %>%
left_join(bakeoff::bakers %>%
filter(series_winner == 1)) %>%
ggplot(aes(x = episode,
y = -technical)) +
geom_path(aes(colour = series),
show.legend = FALSE) +
gghighlight::gghighlight(series_winner == 1,
calculate_per_facet = TRUE) +
scale_colour_gradient2(low = "#e04121", mid = "#f7238a",
high = "#ed9e00", midpoint = 7.1) +
facet_grid(. ~ series) +
geomtextpath::geom_textpath(aes(label = baker),
vjust = -0.2,
text_only = TRUE,
hjust = 0.3) +
theme_minimal()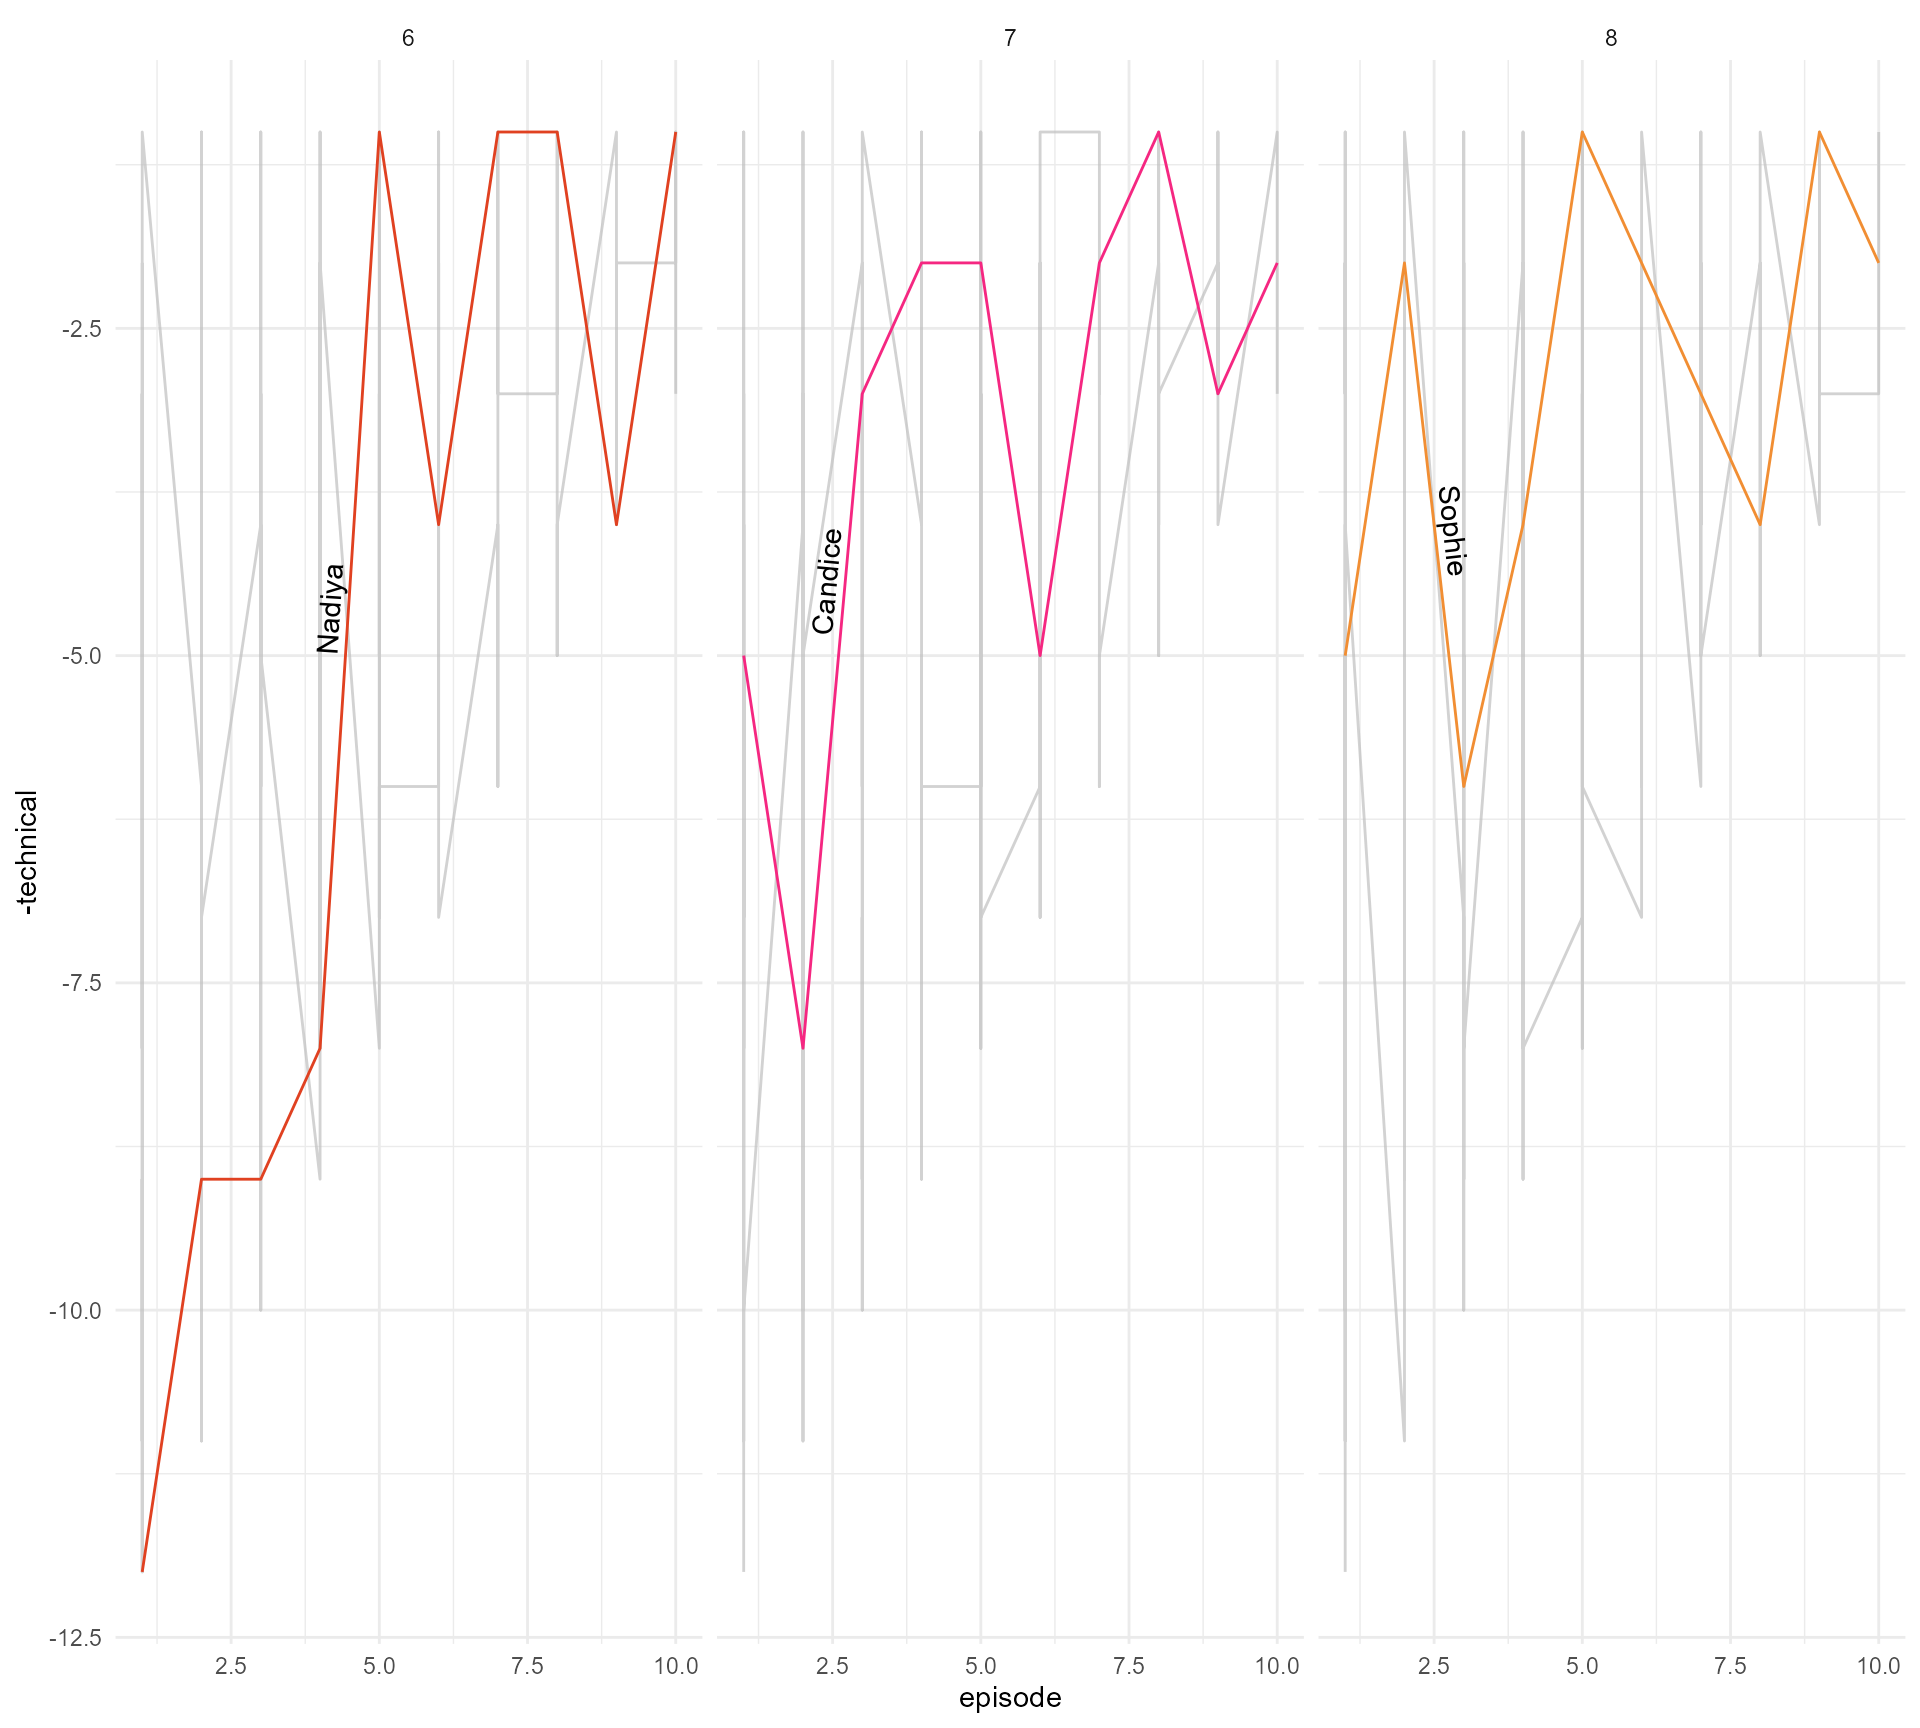
#4 Declutter, declutter, declutter
And some more {ggtext} fun!
bakeoff::bakes_raw %>%
filter(series %in% c(6:8)) %>%
left_join(bakeoff::bakers %>%
filter(series_winner == 1)) %>%
ggplot(aes(x = episode,
y = -technical)) +
geom_path(aes(colour = series),
show.legend = FALSE) +
gghighlight::gghighlight(series_winner == 1,
calculate_per_facet = TRUE) +
scale_colour_gradient2(low = "#e04121", mid = "#f7238a",
high = "#ed9e00", midpoint = 7.1) +
facet_grid(. ~ series) +
geomtextpath::geom_textpath(aes(label = baker),
vjust = -0.2,text_only = TRUE,
hjust = 0.3) +
ggtext::geom_textbox(data = bakeoff::bakes_raw %>%
filter(series %in% c(6:8)) %>%
left_join(bakeoff::bakers %>%
filter(series_winner == 1)) %>%
filter(series_winner == 1,
episode %in% c(1, 10)),
aes(label = technical)) +
theme_minimal()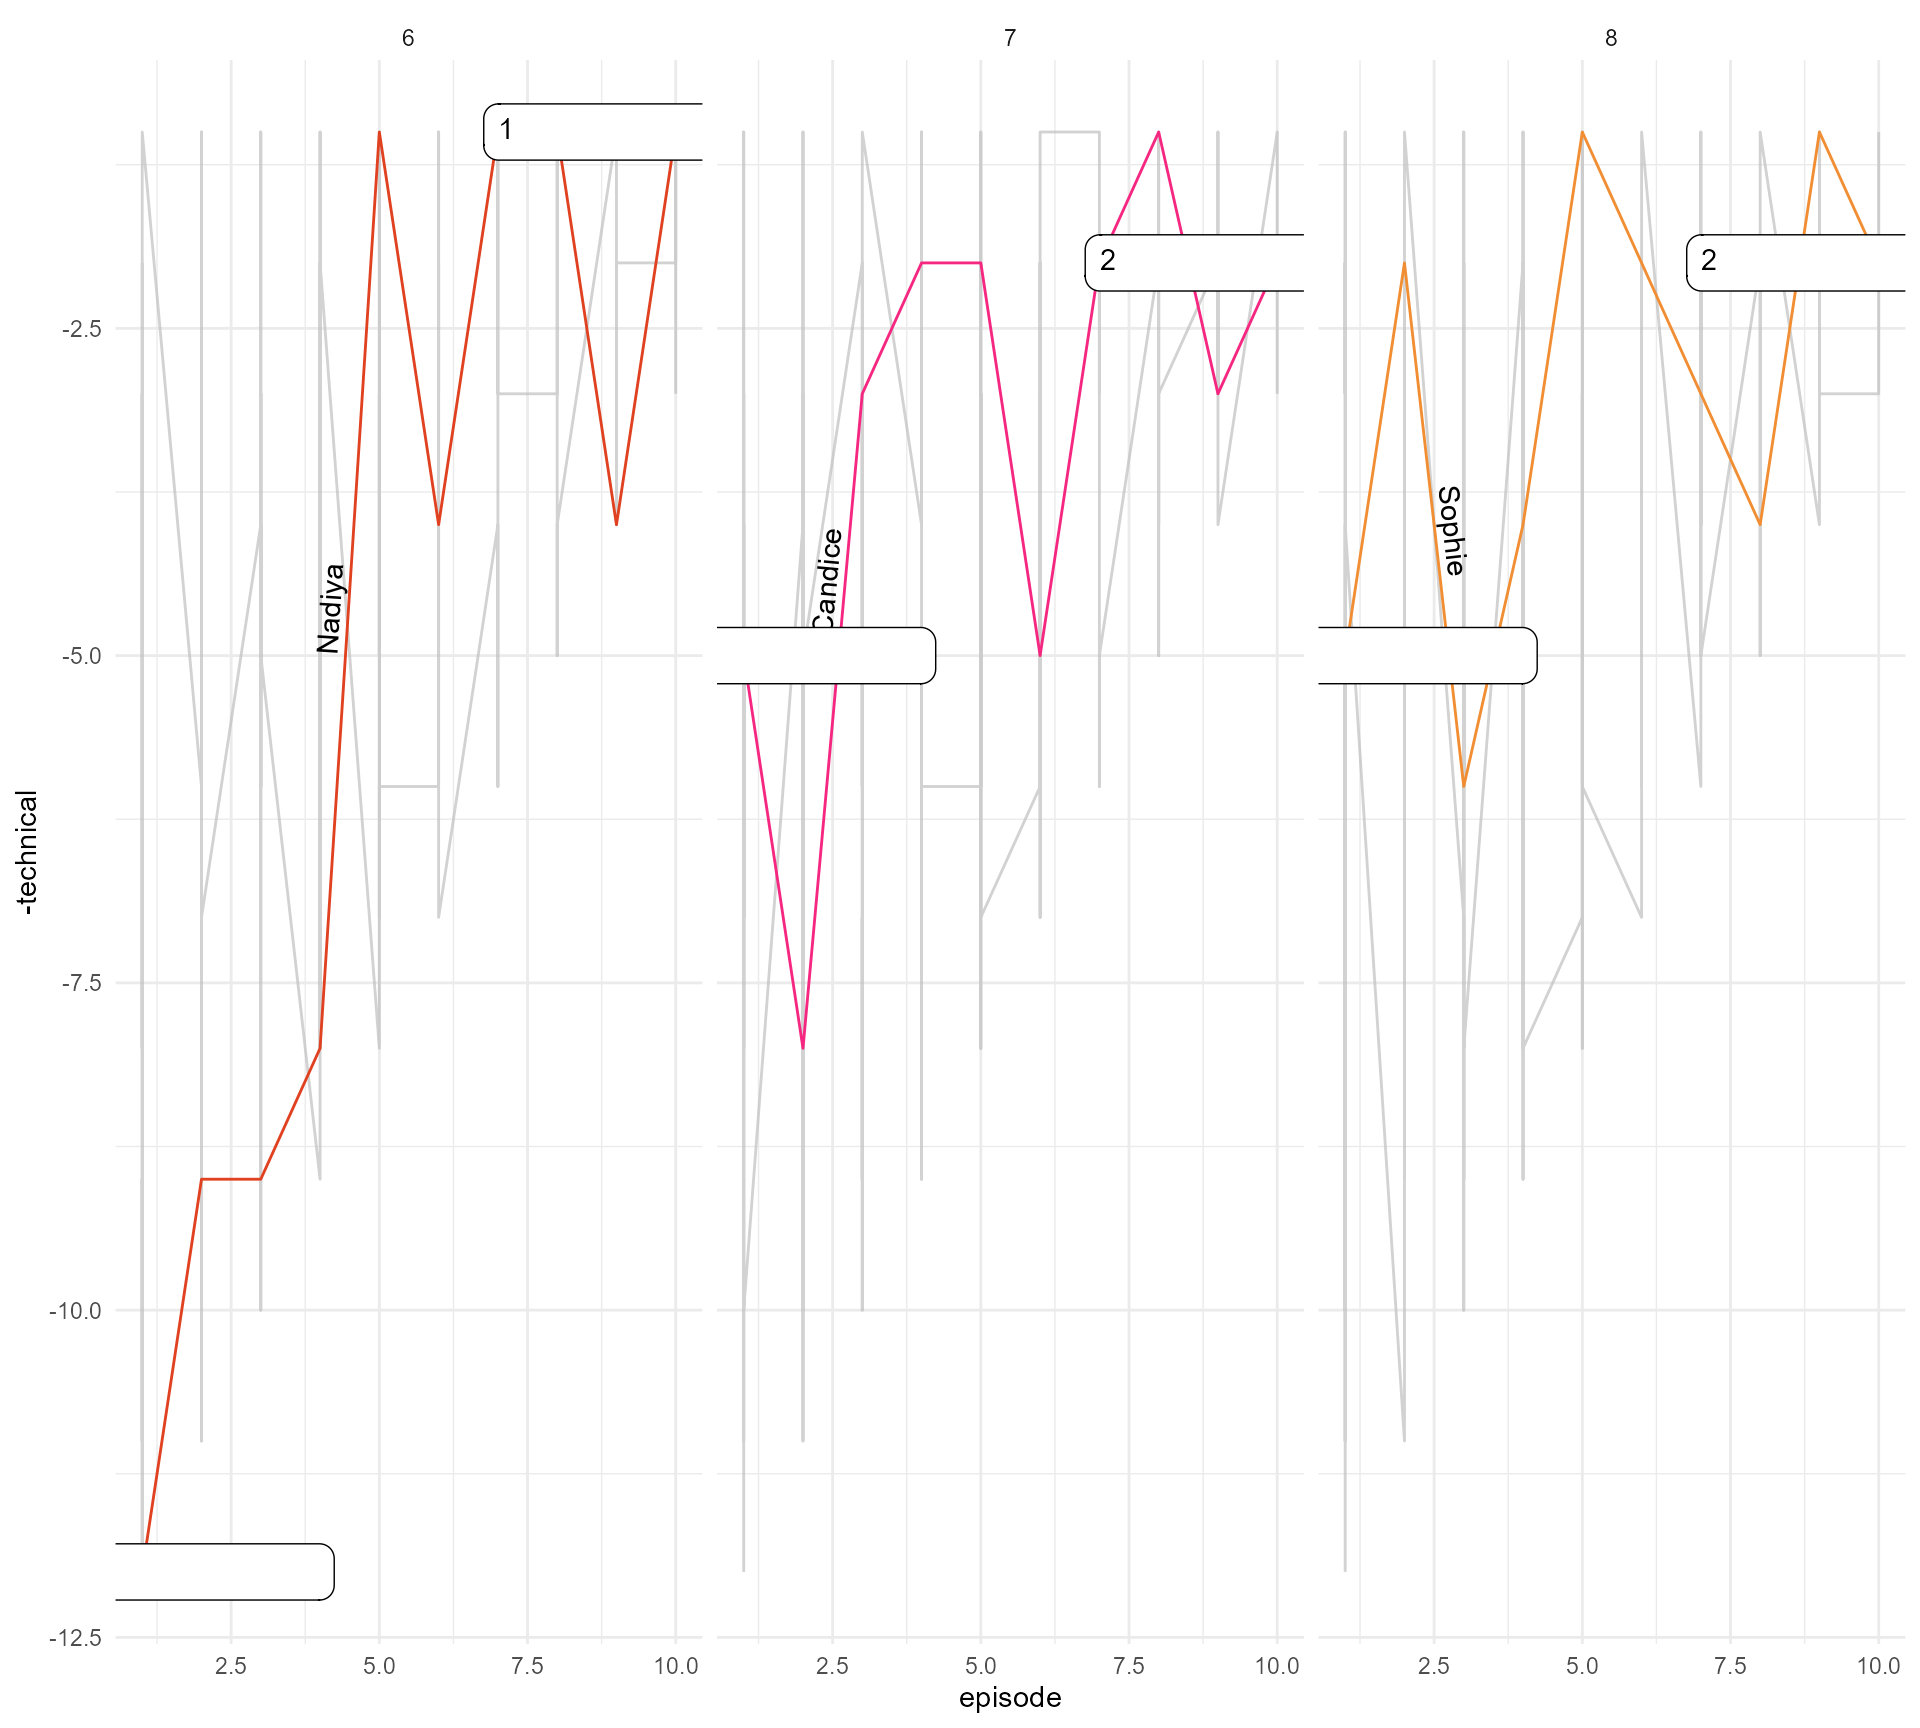
#4 Declutter, declutter, declutter
And some more {ggtext} fun!
bakeoff::bakes_raw %>%
filter(series %in% c(6:8)) %>%
left_join(bakeoff::bakers %>%
filter(series_winner == 1)) %>%
ggplot(aes(x = episode,
y = -technical)) +
geom_path(aes(colour = series),
show.legend = FALSE) +
gghighlight::gghighlight(series_winner == 1,
calculate_per_facet = TRUE) +
scale_colour_gradient2(low = "#e04121", mid = "#f7238a",
high = "#ed9e00", midpoint = 7.1) +
facet_grid(. ~ series) +
geomtextpath::geom_textpath(aes(label = baker),
vjust = -0.2,text_only = TRUE,
hjust = 0.3) +
ggtext::geom_textbox(data = bakeoff::bakes_raw %>%
filter(series %in% c(6:8)) %>%
left_join(bakeoff::bakers %>%
filter(series_winner == 1)) %>%
filter(series_winner == 1,
episode %in% c(1, 10)),
aes(label = technical,
hjust = case_when(episode == 1 ~ 1,
TRUE ~ 0),
halign = case_when(episode == 1 ~ 1,
TRUE ~ 0))) +
theme_minimal()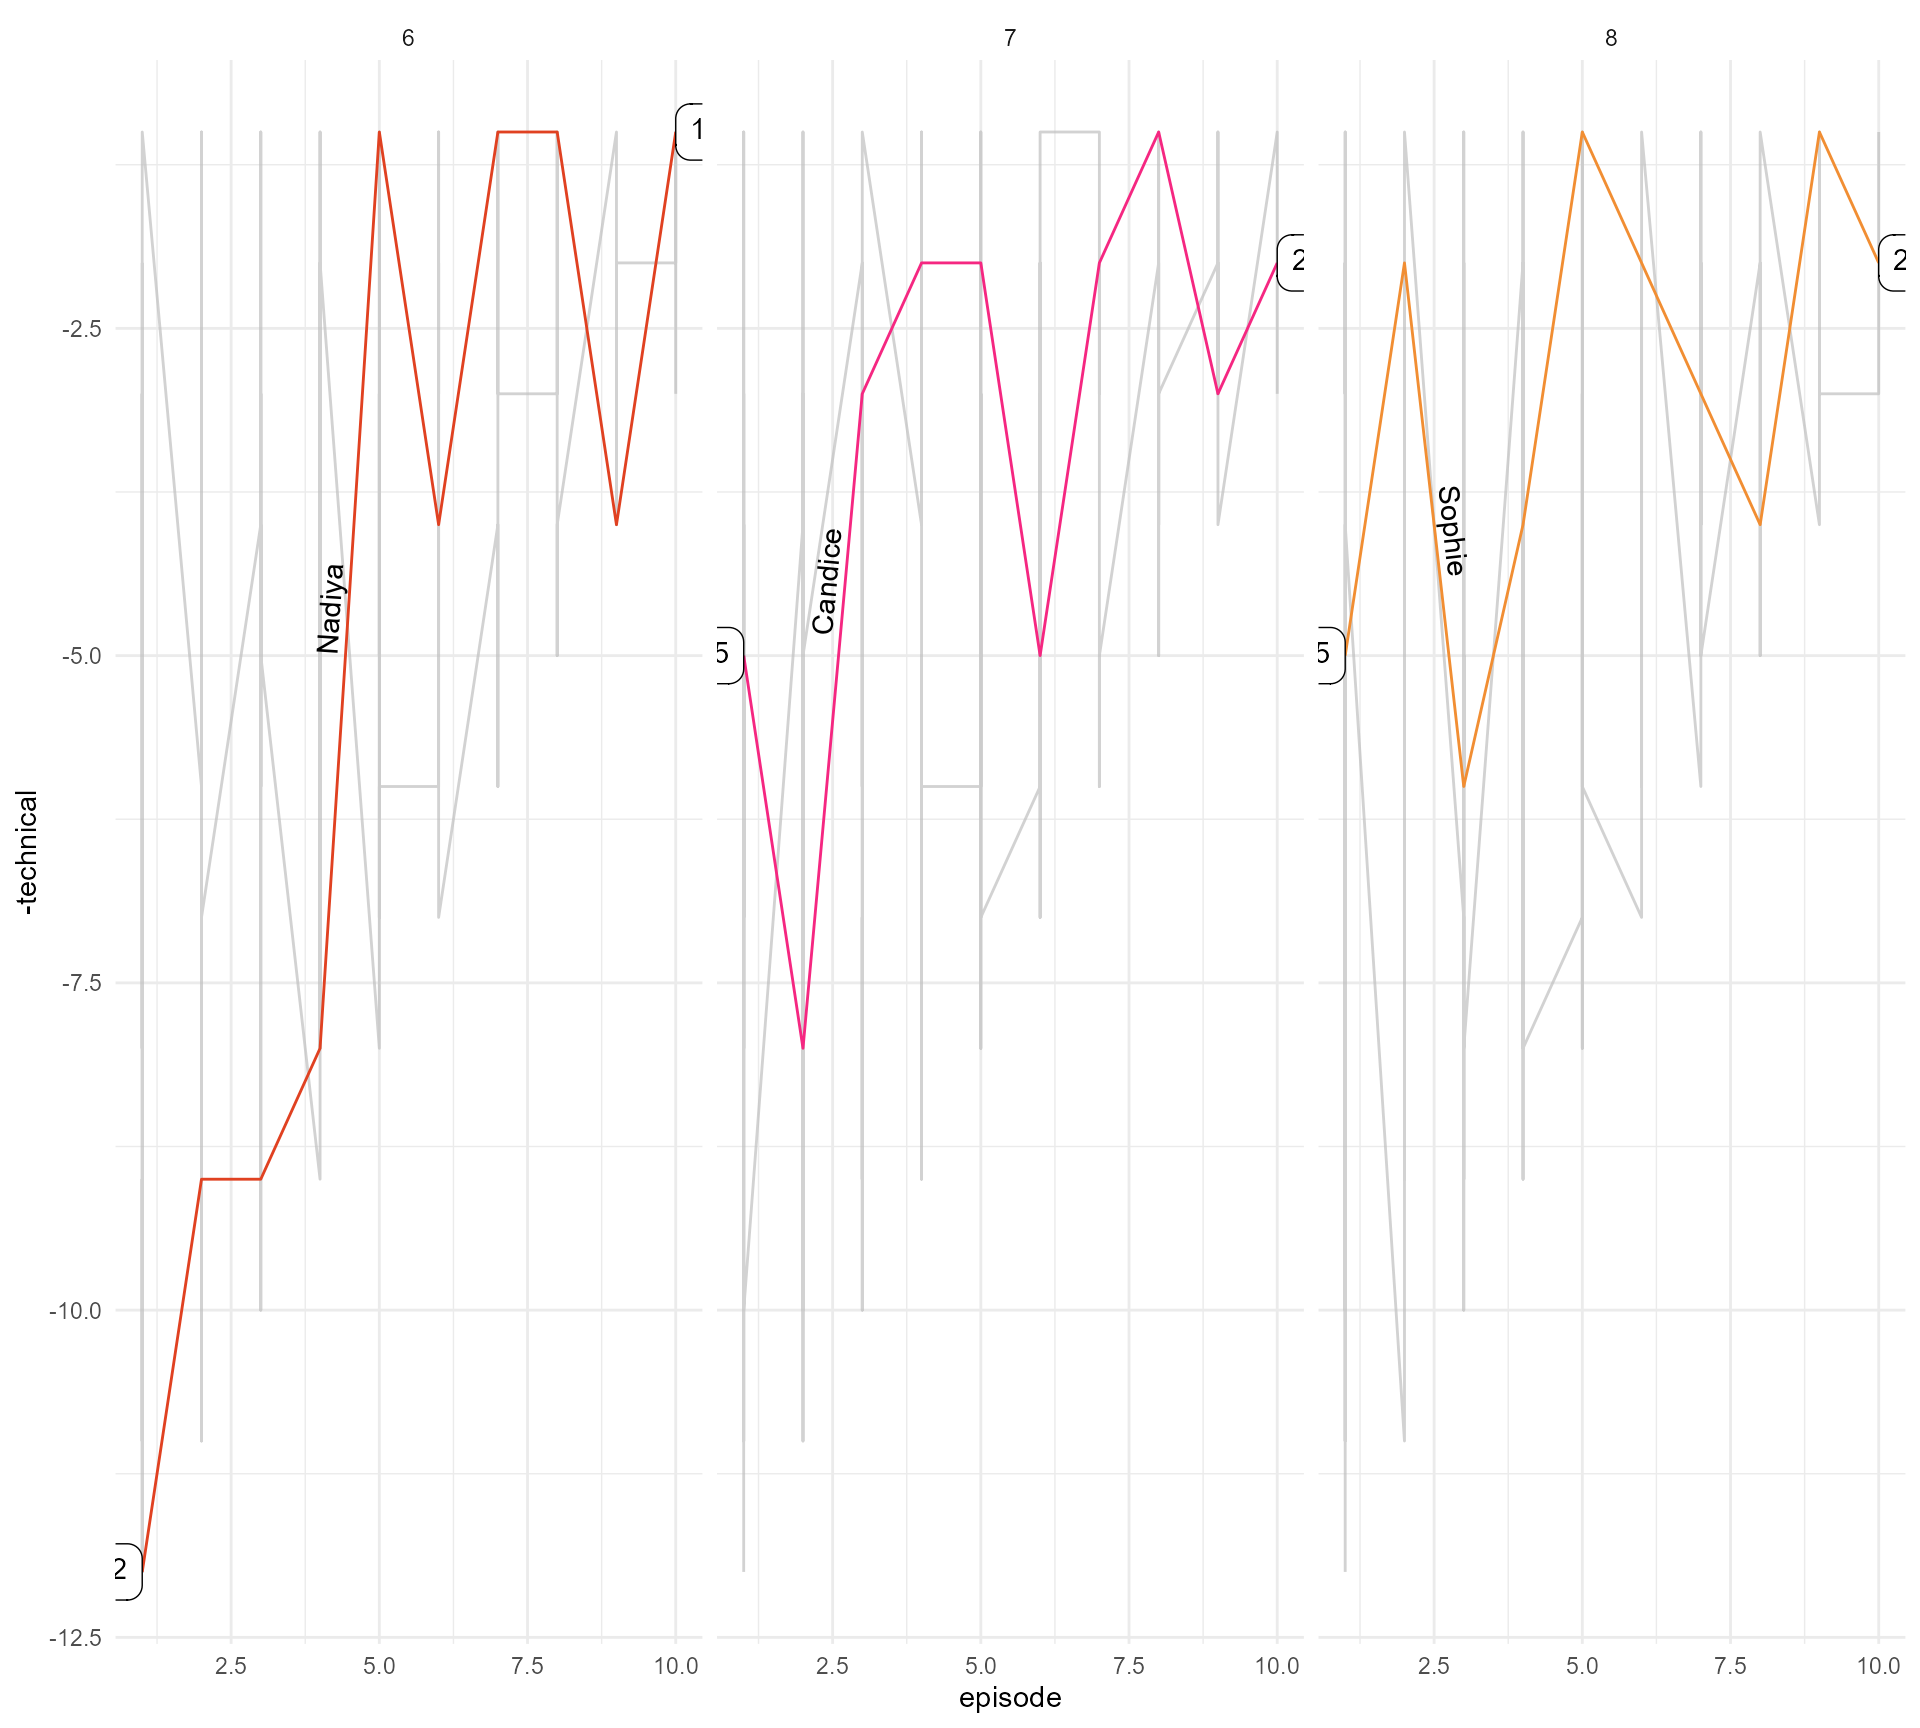
#4 Declutter, declutter, declutter
And some more {ggtext} fun!
bakeoff::bakes_raw %>%
filter(series %in% c(6:8)) %>%
left_join(bakeoff::bakers %>%
filter(series_winner == 1)) %>%
ggplot(aes(x = episode,
y = -technical)) +
geom_path(aes(colour = series),
show.legend = FALSE) +
gghighlight::gghighlight(series_winner == 1,
calculate_per_facet = TRUE) +
scale_colour_gradient2(low = "#e04121", mid = "#f7238a",
high = "#ed9e00", midpoint = 7.1) +
facet_grid(. ~ series) +
geomtextpath::geom_textpath(aes(label = baker),
vjust = -0.2,text_only = TRUE,
hjust = 0.3) +
ggtext::geom_textbox(data = bakeoff::bakes_raw %>%
filter(series %in% c(6:8)) %>%
left_join(bakeoff::bakers %>%
filter(series_winner == 1)) %>%
filter(series_winner == 1,
episode %in% c(1, 10)),
aes(label = paste0("#", technical),
hjust = case_when(episode == 1 ~ 1,
TRUE ~ 0),
halign = case_when(episode == 1 ~ 1,
TRUE ~ 0)),
box.colour = NA,
fill = NA) +
scale_x_continuous(expand = expansion(0.2)) +
theme_minimal()
#4 Declutter, declutter, declutter
And some more {ggtext} fun!
bakeoff::bakes_raw %>%
filter(series %in% c(6:8)) %>%
left_join(bakeoff::bakers %>%
filter(series_winner == 1)) %>%
ggplot(aes(x = episode,
y = -technical)) +
geom_path(aes(colour = series),
show.legend = FALSE) +
gghighlight::gghighlight(series_winner == 1,
calculate_per_facet = TRUE) +
scale_colour_gradient2(low = "#e04121", mid = "#f7238a",
high = "#ed9e00", midpoint = 7.1) +
facet_grid(. ~ series) +
geomtextpath::geom_textpath(aes(label = baker),
vjust = -0.2,text_only = TRUE,
hjust = 0.3,
family = "Cabin") +
ggtext::geom_textbox(data = bakeoff::bakes_raw %>%
filter(series %in% c(6:8)) %>%
left_join(bakeoff::bakers %>%
filter(series_winner == 1)) %>%
filter(series_winner == 1,
episode %in% c(1, 10)),
aes(label = paste0("#", technical),
hjust = case_when(episode == 1 ~ 1,
TRUE ~ 0),
halign = case_when(episode == 1 ~ 1,
TRUE ~ 0)),
box.colour = NA,
family = "Cabin",
fill = NA) +
scale_x_continuous(expand = expansion(0.2)) +
theme_minimal()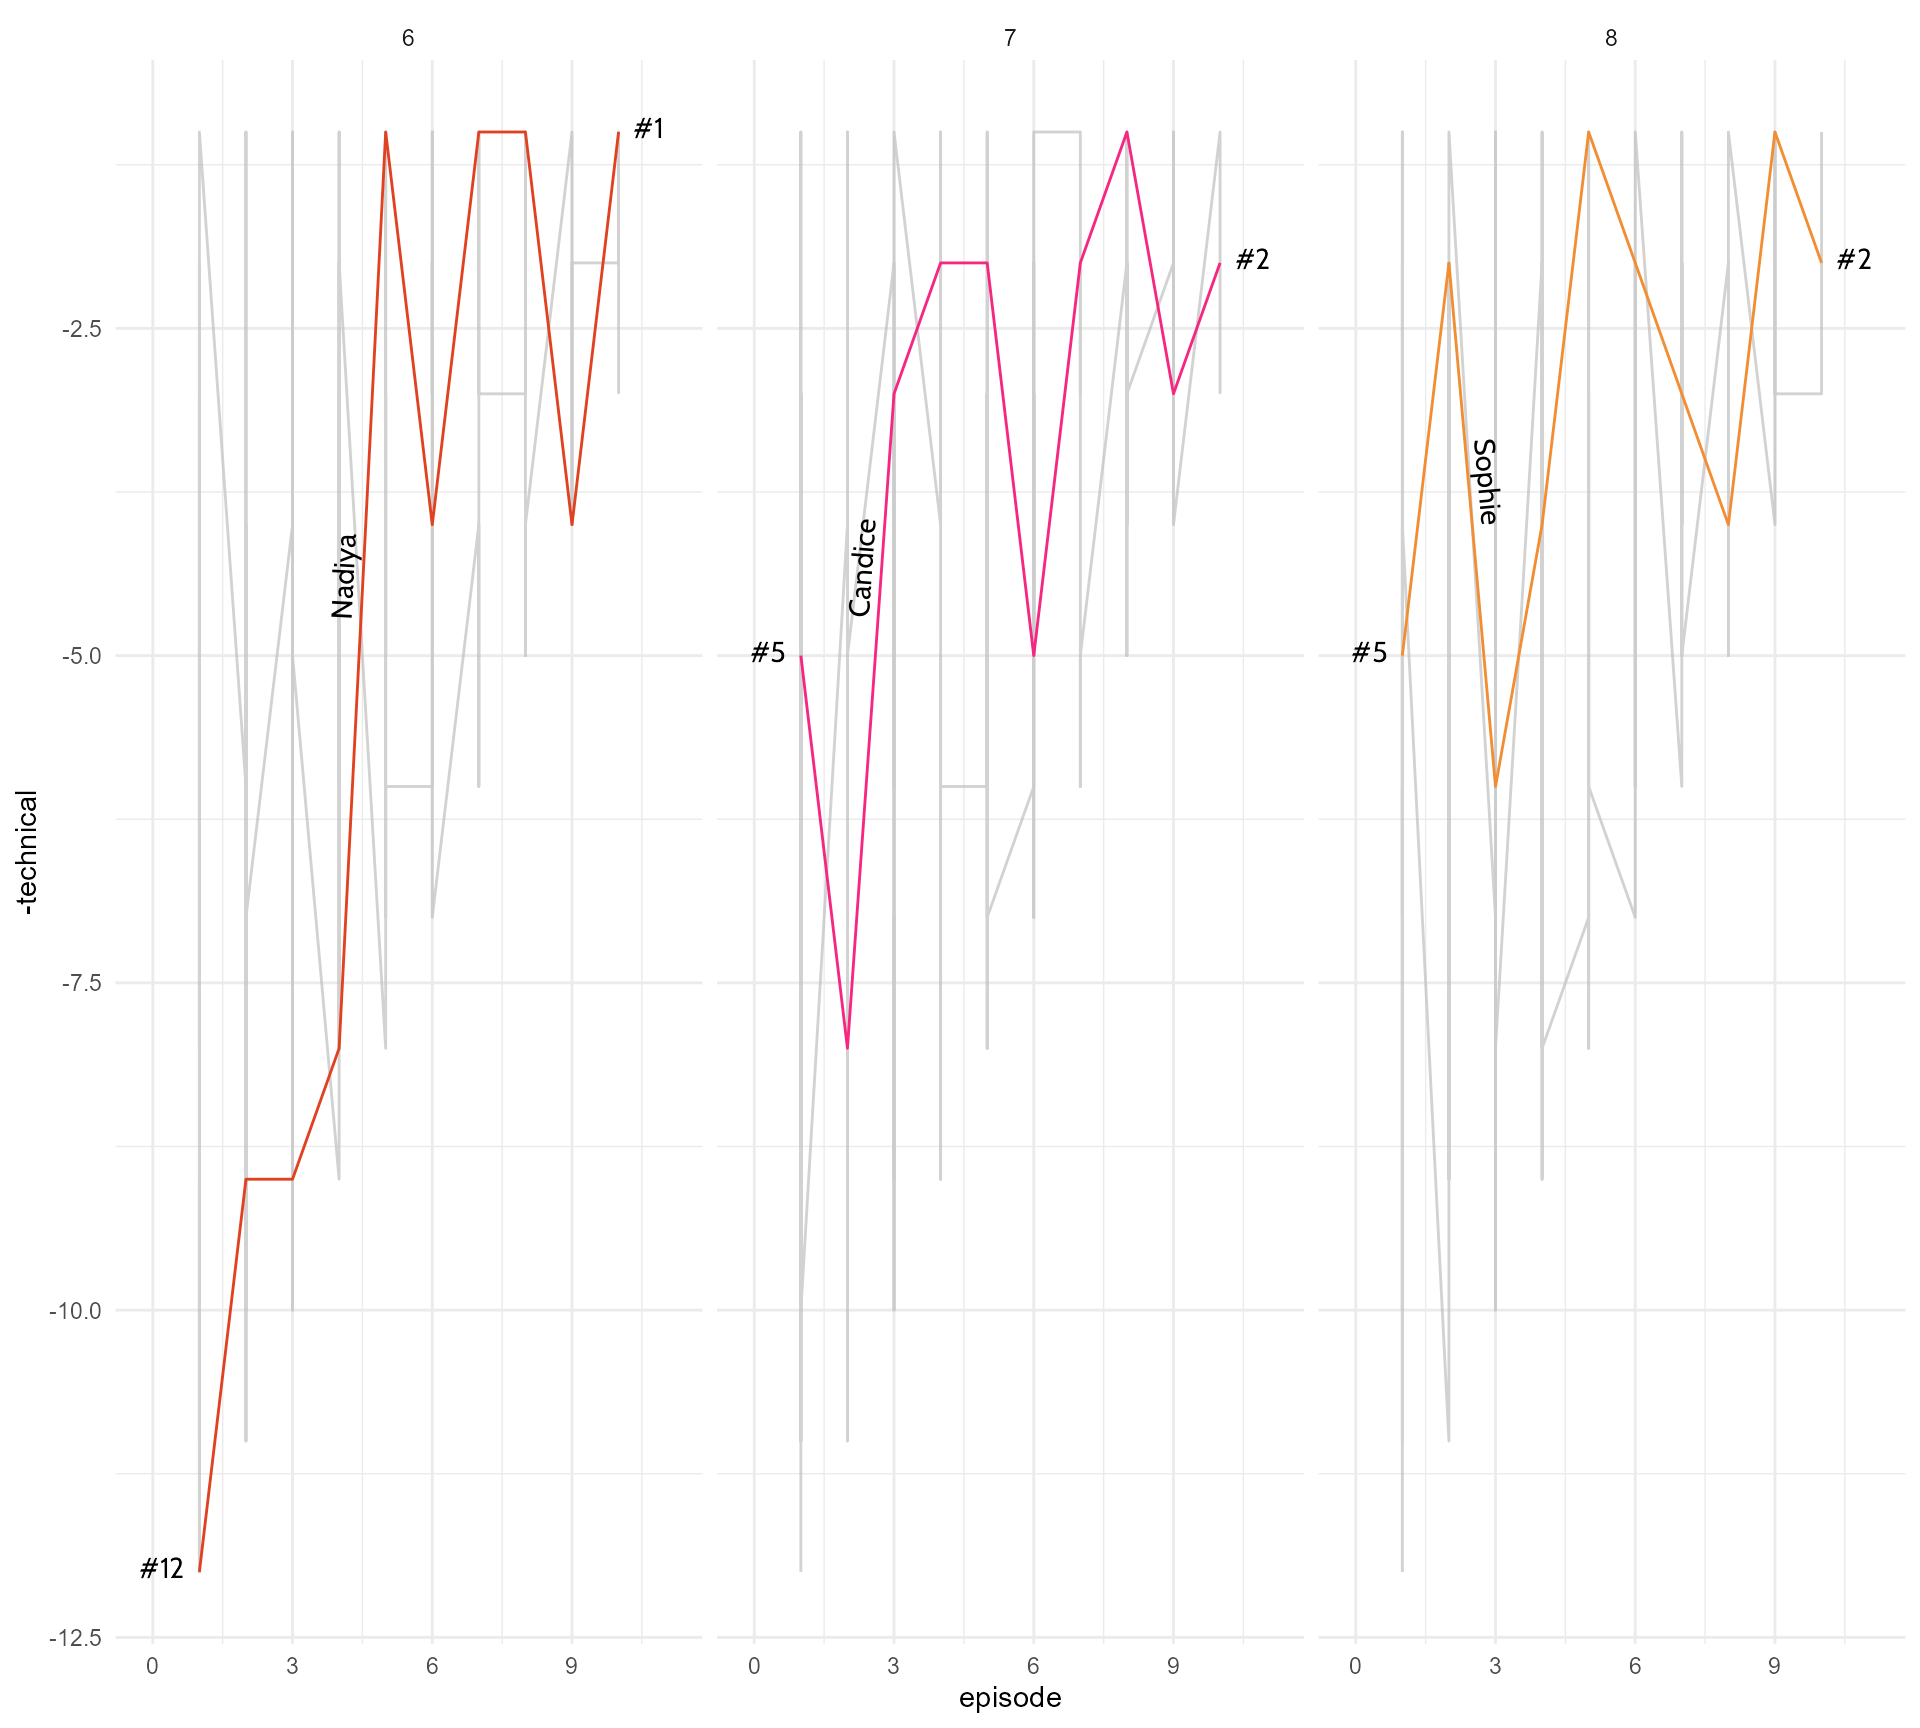
#4 Declutter, declutter, declutter
Format the facet titles
bakeoff::bakes_raw %>%
filter(series %in% c(6:8)) %>%
left_join(bakeoff::bakers %>%
filter(series_winner == 1)) %>%
ggplot(aes(x = episode,
y = -technical)) +
geom_path(aes(colour = series),
show.legend = FALSE) +
gghighlight::gghighlight(series_winner == 1,
calculate_per_facet = TRUE) +
scale_colour_gradient2(low = "#e04121", mid = "#f7238a",
high = "#ed9e00", midpoint = 7.1) +
facet_grid(. ~ series,
labeller = as_labeller(function(x)
paste("Series", x))) +
geomtextpath::geom_textpath(aes(label = baker),
vjust = -0.2,text_only = TRUE,
hjust = 0.3,
family = "Cabin") +
ggtext::geom_textbox(data = bakeoff::bakes_raw %>%
filter(series %in% c(6:8)) %>%
left_join(bakeoff::bakers %>%
filter(series_winner == 1)) %>%
filter(series_winner == 1,
episode %in% c(1, 10)),
aes(label = paste0("#", technical),
hjust = case_when(episode == 1 ~ 1,
TRUE ~ 0),
halign = case_when(episode == 1 ~ 1,
TRUE ~ 0)),
box.colour = NA,
family = "Cabin",
fill = NA) +
scale_x_continuous(expand = expansion(0.2)) +
theme_void() +
theme(strip.text = element_text(family = "Cabin", colour = "#200000",
size = 16))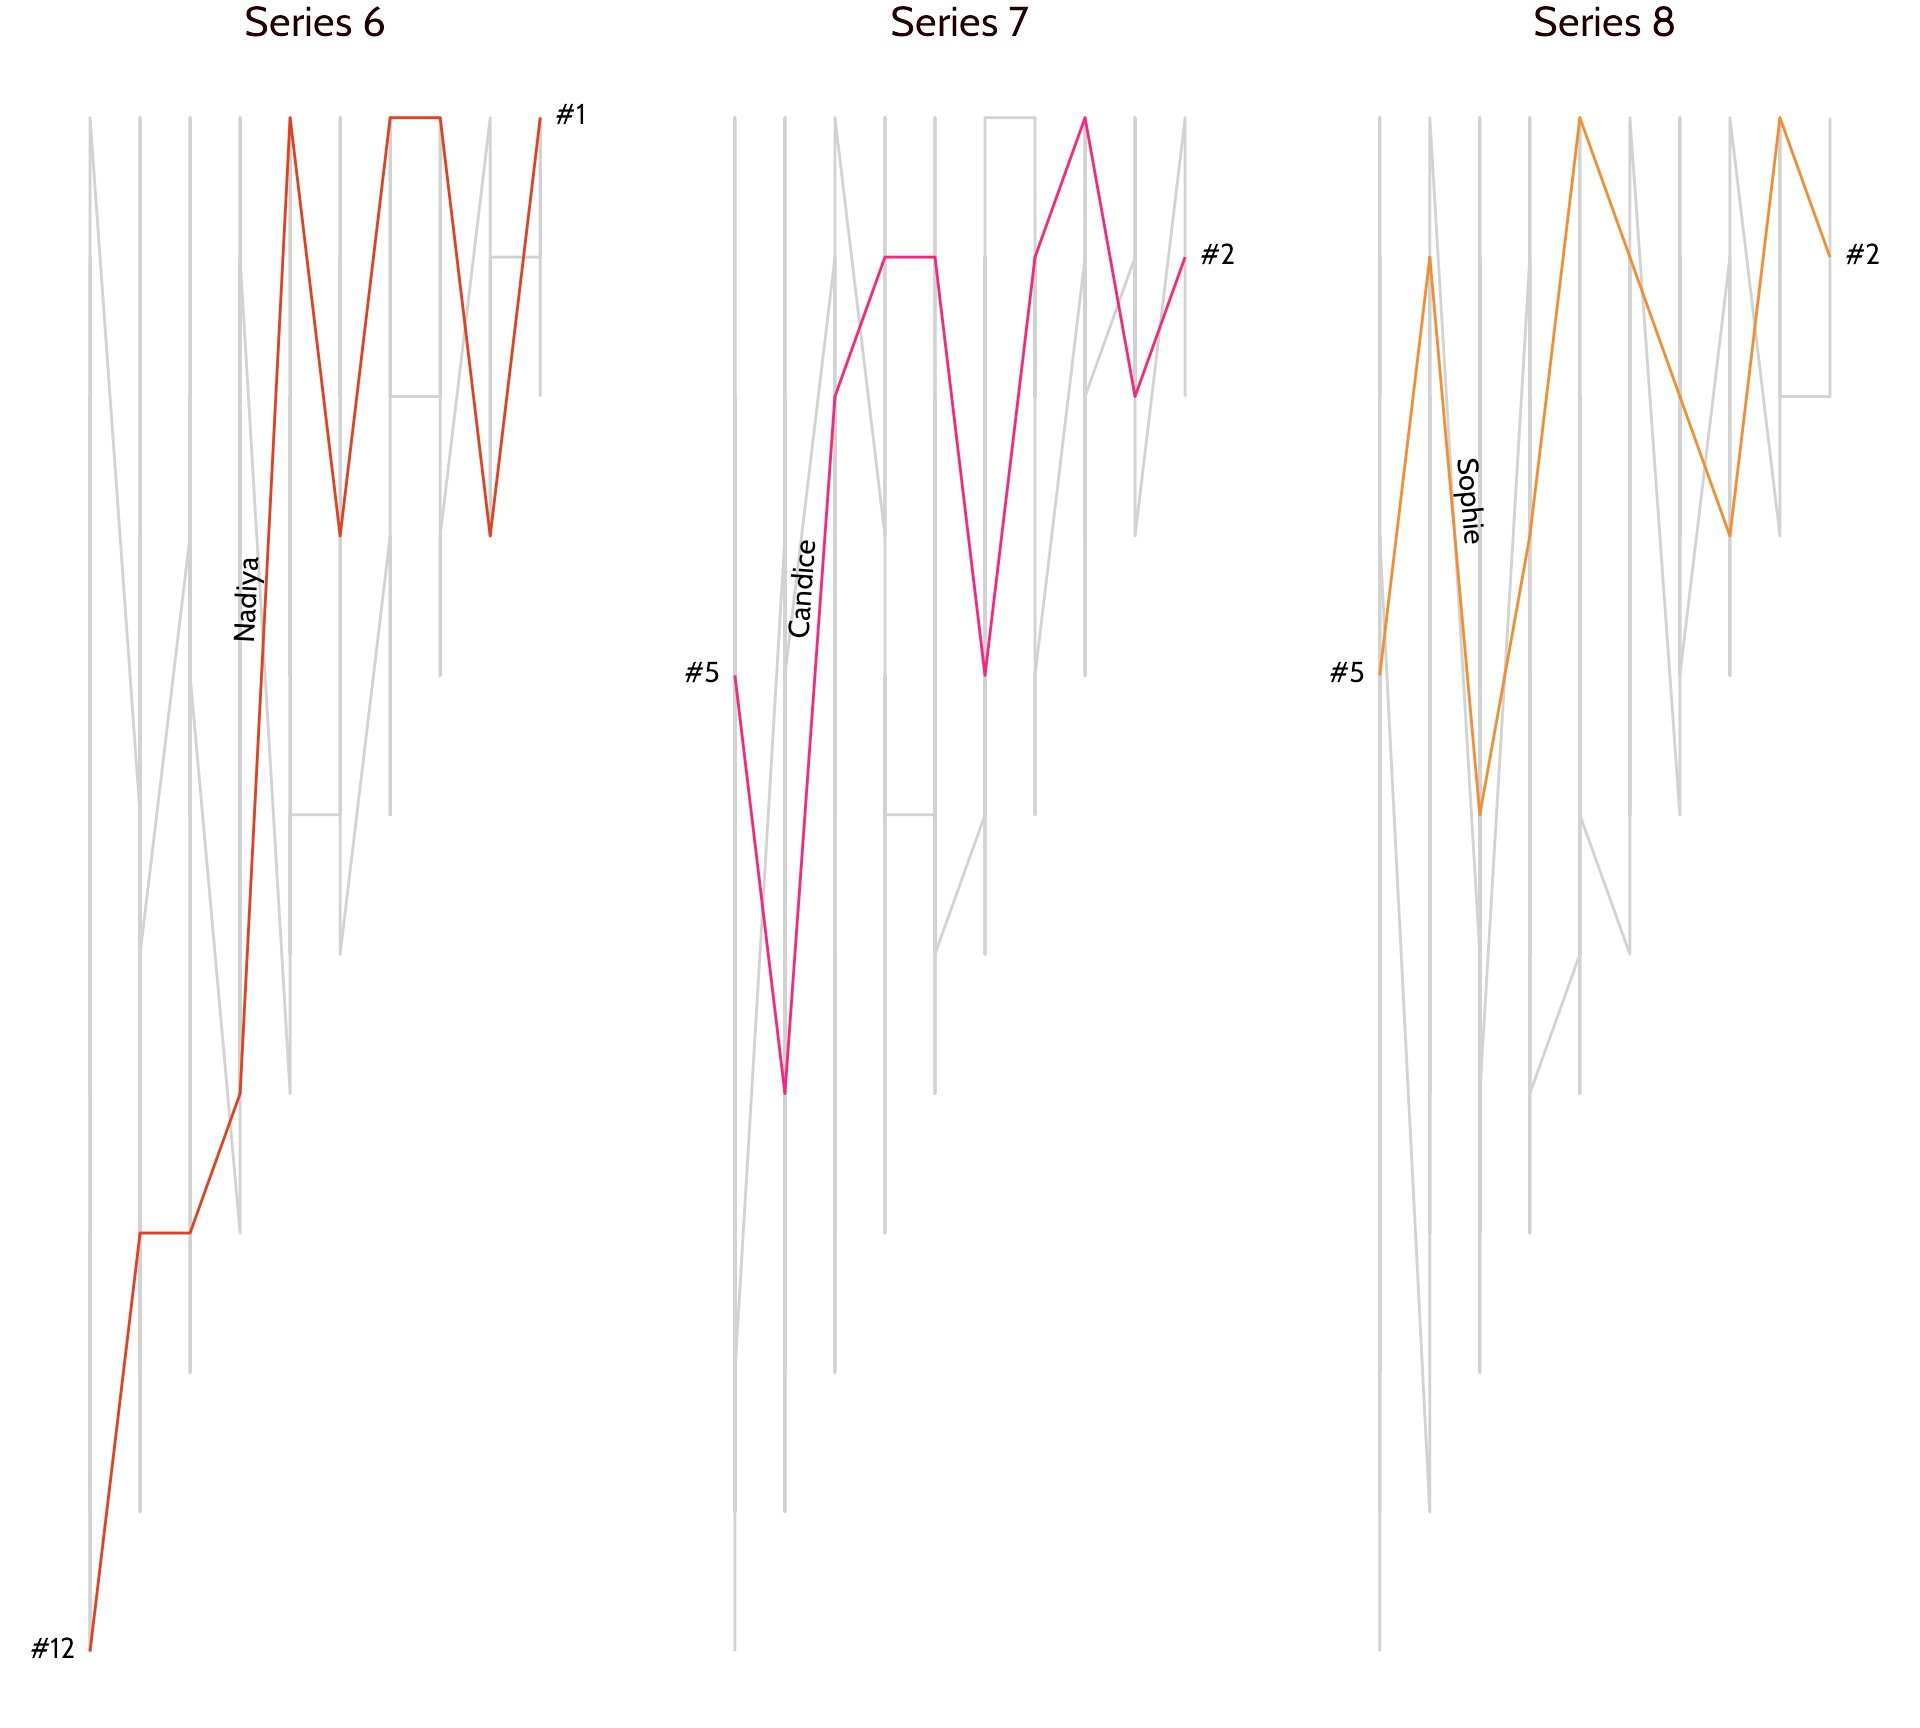
#4 Declutter, declutter, declutter
Format the facet titles
bakeoff::bakes_raw %>%
filter(series %in% c(6:8)) %>%
left_join(bakeoff::bakers %>%
filter(series_winner == 1)) %>%
ggplot(aes(x = episode,
y = -technical)) +
geom_path(aes(colour = series),
show.legend = FALSE) +
gghighlight::gghighlight(series_winner == 1,
calculate_per_facet = TRUE) +
scale_colour_gradient2(low = "#e04121", mid = "#f7238a",
high = "#ed9e00", midpoint = 7.1) +
facet_grid(. ~ series, labeller = as_labeller(function(x) paste("Series", x))) +
geomtextpath::geom_textpath(aes(label = baker),
vjust = -0.2,text_only = TRUE,
hjust = 0.3,
family = "Cabin") +
ggtext::geom_textbox(data = bakeoff::bakes_raw %>%
filter(series %in% c(6:8)) %>%
left_join(bakeoff::bakers %>%
filter(series_winner == 1)) %>%
filter(series_winner == 1,
episode %in% c(1, 10)),
aes(label = paste0("#", technical),
hjust = case_when(episode == 1 ~ 1,
TRUE ~ 0),
halign = case_when(episode == 1 ~ 1,
TRUE ~ 0)),
box.colour = NA,
family = "Cabin",
fill = NA) +
scale_x_continuous(expand = expansion(0.2)) +
theme_void() +
theme(strip.text = element_text(family = "Cabin", colour = "#200000",
size = 16,
margin = margin(c(16, 0, 0, 0))))
#4 Declutter, declutter, declutter
Very subtle decluttering - NA colours!
bakeoff::bakes_raw %>%
filter(series %in% c(6:8)) %>%
left_join(bakeoff::bakers %>%
filter(series_winner == 1)) %>%
ggplot(aes(x = episode,
y = -technical)) +
geom_path(aes(colour = series),
show.legend = FALSE) +
gghighlight::gghighlight(series_winner == 1,
calculate_per_facet = TRUE,
unhighlighted_params =
list(color = "#D2CCCC")) +
scale_colour_gradient2(low = "#e04121", mid = "#f7238a",
high = "#ed9e00", midpoint = 7.1) +
facet_grid(. ~ series, labeller = as_labeller(function(x) paste("Series", x))) +
geomtextpath::geom_textpath(aes(label = baker),
vjust = -0.2,text_only = TRUE,
hjust = 0.3,
family = "Cabin") +
ggtext::geom_textbox(data = bakeoff::bakes_raw %>%
filter(series %in% c(6:8)) %>%
left_join(bakeoff::bakers %>%
filter(series_winner == 1)) %>%
filter(series_winner == 1,
episode %in% c(1, 10)),
aes(label = paste0("#", technical),
hjust = case_when(episode == 1 ~ 1,
TRUE ~ 0),
halign = case_when(episode == 1 ~ 1,
TRUE ~ 0)),
box.colour = NA,
family = "Cabin",
fill = NA) +
scale_x_continuous(expand = expansion(0.2)) +
theme_void() +
theme(strip.text = element_text(family = "Cabin", colour = "#200000",
size = 16,
margin = margin(c(16, 0, 0, 0))))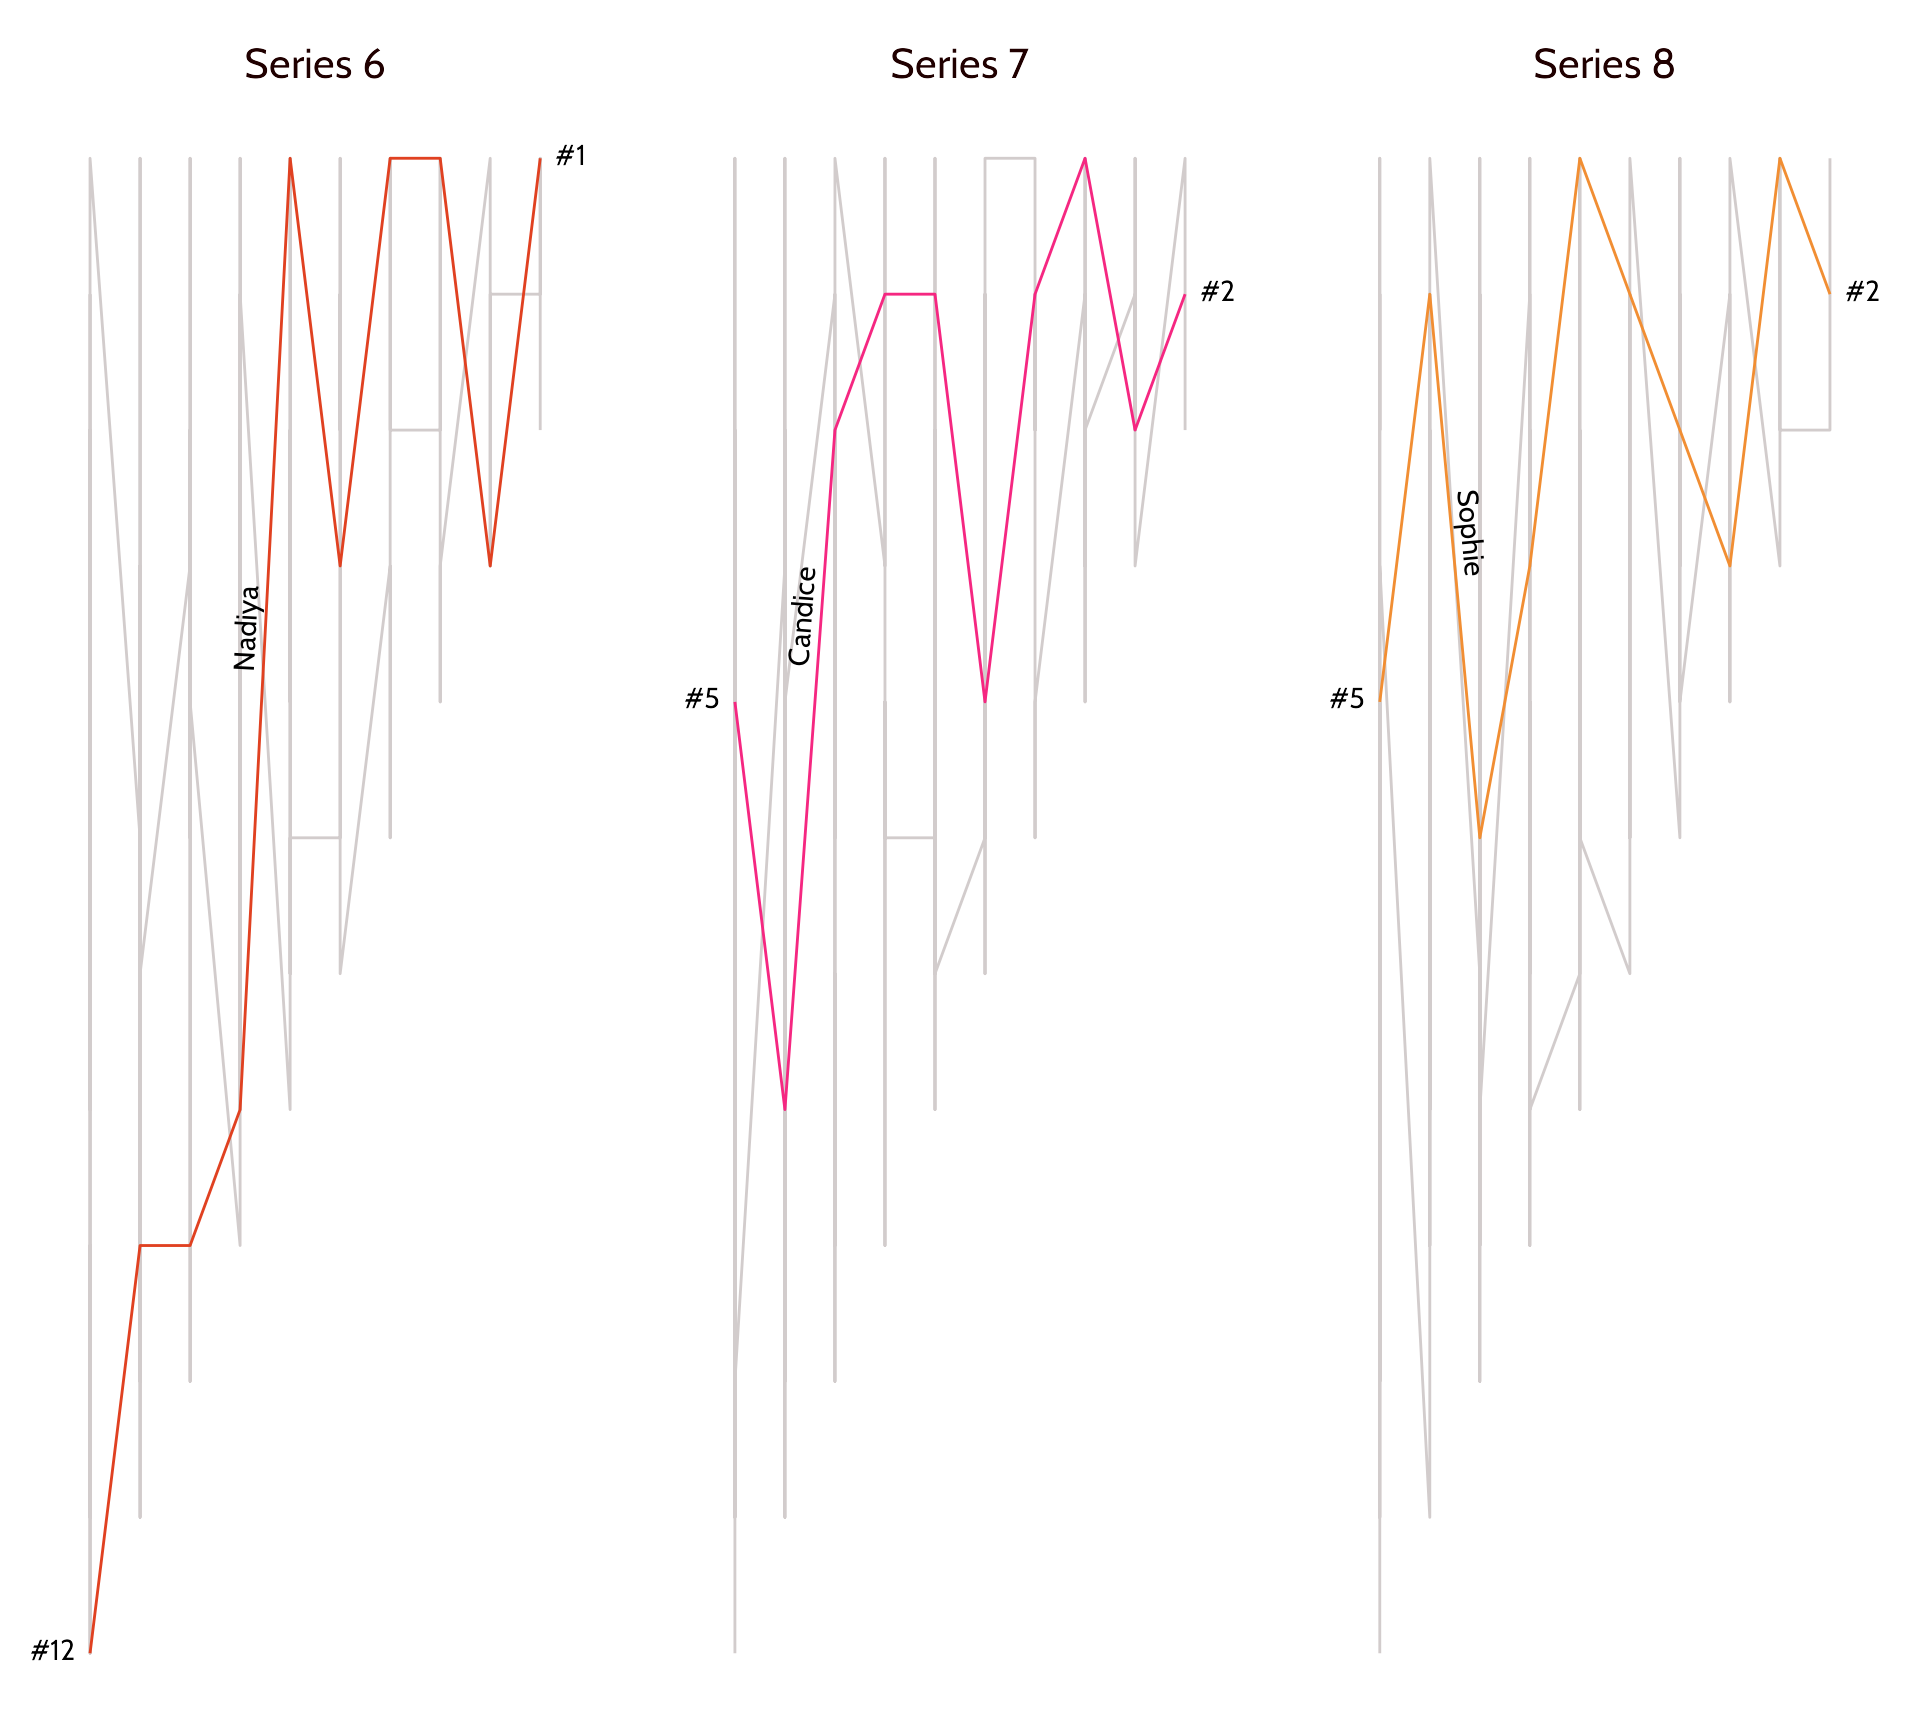
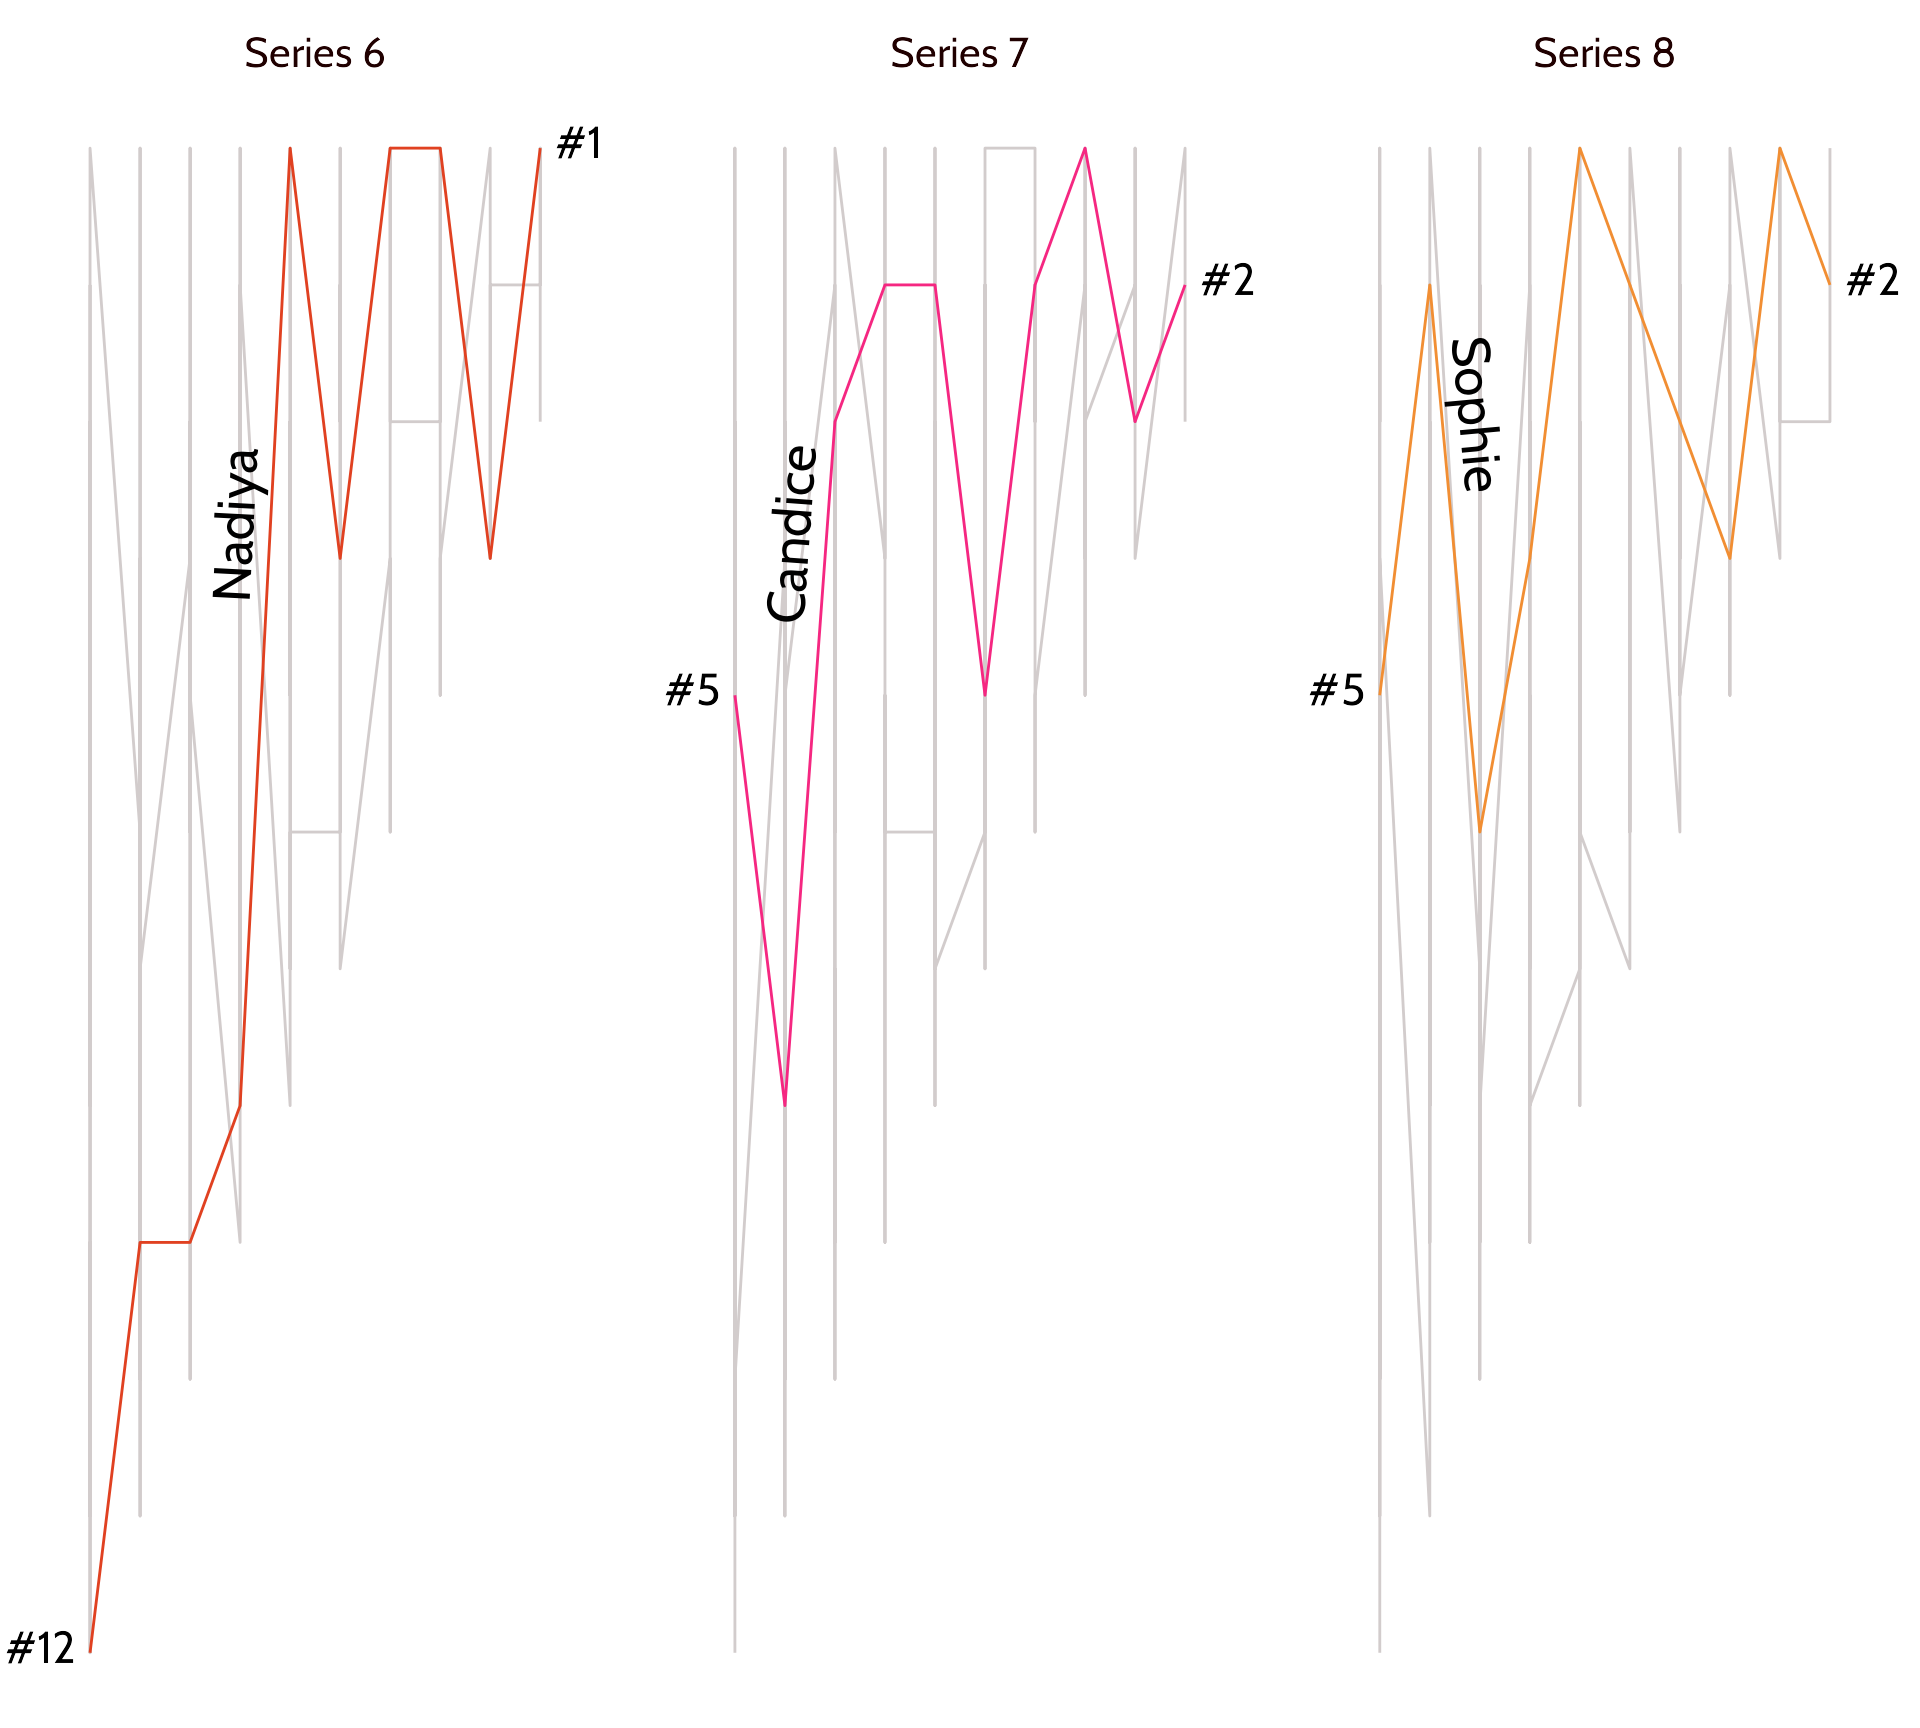
#4 Declutter, declutter, declutter
Adjust text hierarchy
bakeoff::bakes_raw %>%
filter(series %in% c(6:8)) %>%
left_join(bakeoff::bakers %>%
filter(series_winner == 1)) %>%
ggplot(aes(x = episode,
y = -technical)) +
geom_path(aes(colour = series),
show.legend = FALSE) +
gghighlight::gghighlight(series_winner == 1,
calculate_per_facet = TRUE,
unhighlighted_params = list(color = "#D2CCCC")) +
scale_colour_gradient2(low = "#e04121", mid = "#f7238a",
high = "#ed9e00", midpoint = 7.1) +
facet_grid(. ~ series, labeller = as_labeller(function(x) paste("Series", x))) +
geomtextpath::geom_textpath(aes(label = baker),
vjust = -0.2,text_only = TRUE,
hjust = 0.3,
size = 7,
family = "Cabin") +
ggtext::geom_textbox(data = bakeoff::bakes_raw %>%
filter(series %in% c(6:8)) %>%
left_join(bakeoff::bakers %>%
filter(series_winner == 1)) %>%
filter(series_winner == 1,
episode %in% c(1, 10)),
aes(label = paste0("#", technical),
hjust = case_when(episode == 1 ~ 1,
TRUE ~ 0),
halign = case_when(episode == 1 ~ 1,
TRUE ~ 0)),
box.colour = NA,
size = 6,
family = "Cabin",
fill = NA) +
scale_x_continuous(expand = expansion(0.2)) +
theme_void() +
theme(strip.text = element_text(family = "Cabin", colour = "#200000",
size = 16,
margin = margin(c(12, 0, 0, 0))))
#4 Declutter, declutter, declutter
#5 Tie your text to the data
Use colour!
bakeoff::bakes_raw %>%
filter(series %in% c(6:8)) %>%
left_join(bakeoff::bakers %>%
filter(series_winner == 1)) %>%
ggplot(aes(x = episode,
y = -technical)) +
geom_path(aes(colour = series),
show.legend = FALSE) +
gghighlight::gghighlight(series_winner == 1,
calculate_per_facet = TRUE,
unhighlighted_params = list(color = "#D2CCCC")) +
scale_colour_gradient2(low = "#e04121", mid = "#f7238a",
high = "#ed9e00", midpoint = 7.1) +
facet_grid(. ~ series, labeller = as_labeller(function(x) paste("Series", x))) +
geomtextpath::geom_textpath(aes(label = baker),
vjust = -0.2,text_only = TRUE,
hjust = 0.3,
size = 7,
family = "Cabin") +
ggtext::geom_textbox(data = bakeoff::bakes_raw %>%
filter(series %in% c(6:8)) %>%
left_join(bakeoff::bakers %>%
filter(series_winner == 1)) %>%
filter(series_winner == 1,
episode %in% c(1, 10)),
aes(label = paste0("#", technical),
hjust = case_when(episode == 1 ~ 1,
TRUE ~ 0),
halign = case_when(episode == 1 ~ 1,
TRUE ~ 0)),
box.colour = NA,
size = 6,
family = "Cabin",
fill = NA) +
scale_x_continuous(expand = expansion(0.2)) +
theme_void() +
theme(strip.text = element_text(family = "Cabin", colour = "#200000",
size = 16,
margin = margin(c(12, 0, 0, 0))))
#5 Tie your text to the data
Use colour!
bakeoff::bakes_raw %>%
filter(series %in% c(6:8)) %>%
left_join(bakeoff::bakers %>%
filter(series_winner == 1)) %>%
ggplot(aes(x = episode,
y = -technical)) +
geom_path(aes(colour = series),
show.legend = FALSE) +
gghighlight::gghighlight(series_winner == 1,
calculate_per_facet = TRUE,
unhighlighted_params = list(color = "#D2CCCC")) +
scale_colour_gradient2(low = "#e04121", mid = "#f7238a",
high = "#ed9e00", midpoint = 7.1) +
facet_grid(. ~ series, labeller = as_labeller(function(x) paste("Series", x))) +
geomtextpath::geom_textpath(aes(label = baker,
colour = series),
vjust = -0.2,text_only = TRUE,
hjust = 0.3,
size = 7,
family = "Cabin") +
ggtext::geom_textbox(data = bakeoff::bakes_raw %>%
filter(series %in% c(6:8)) %>%
left_join(bakeoff::bakers %>%
filter(series_winner == 1)) %>%
filter(series_winner == 1,
episode %in% c(1, 10)),
aes(label = paste0("#", technical),
hjust = case_when(episode == 1 ~ 1,
TRUE ~ 0),
halign = case_when(episode == 1 ~ 1,
TRUE ~ 0)),
box.colour = NA,
size = 6,
family = "Cabin",
fill = NA) +
scale_x_continuous(expand = expansion(0.2)) +
theme_void() +
theme(strip.text = element_text(family = "Cabin", colour = "#200000",
size = 16,
margin = margin(c(12, 0, 0, 0))))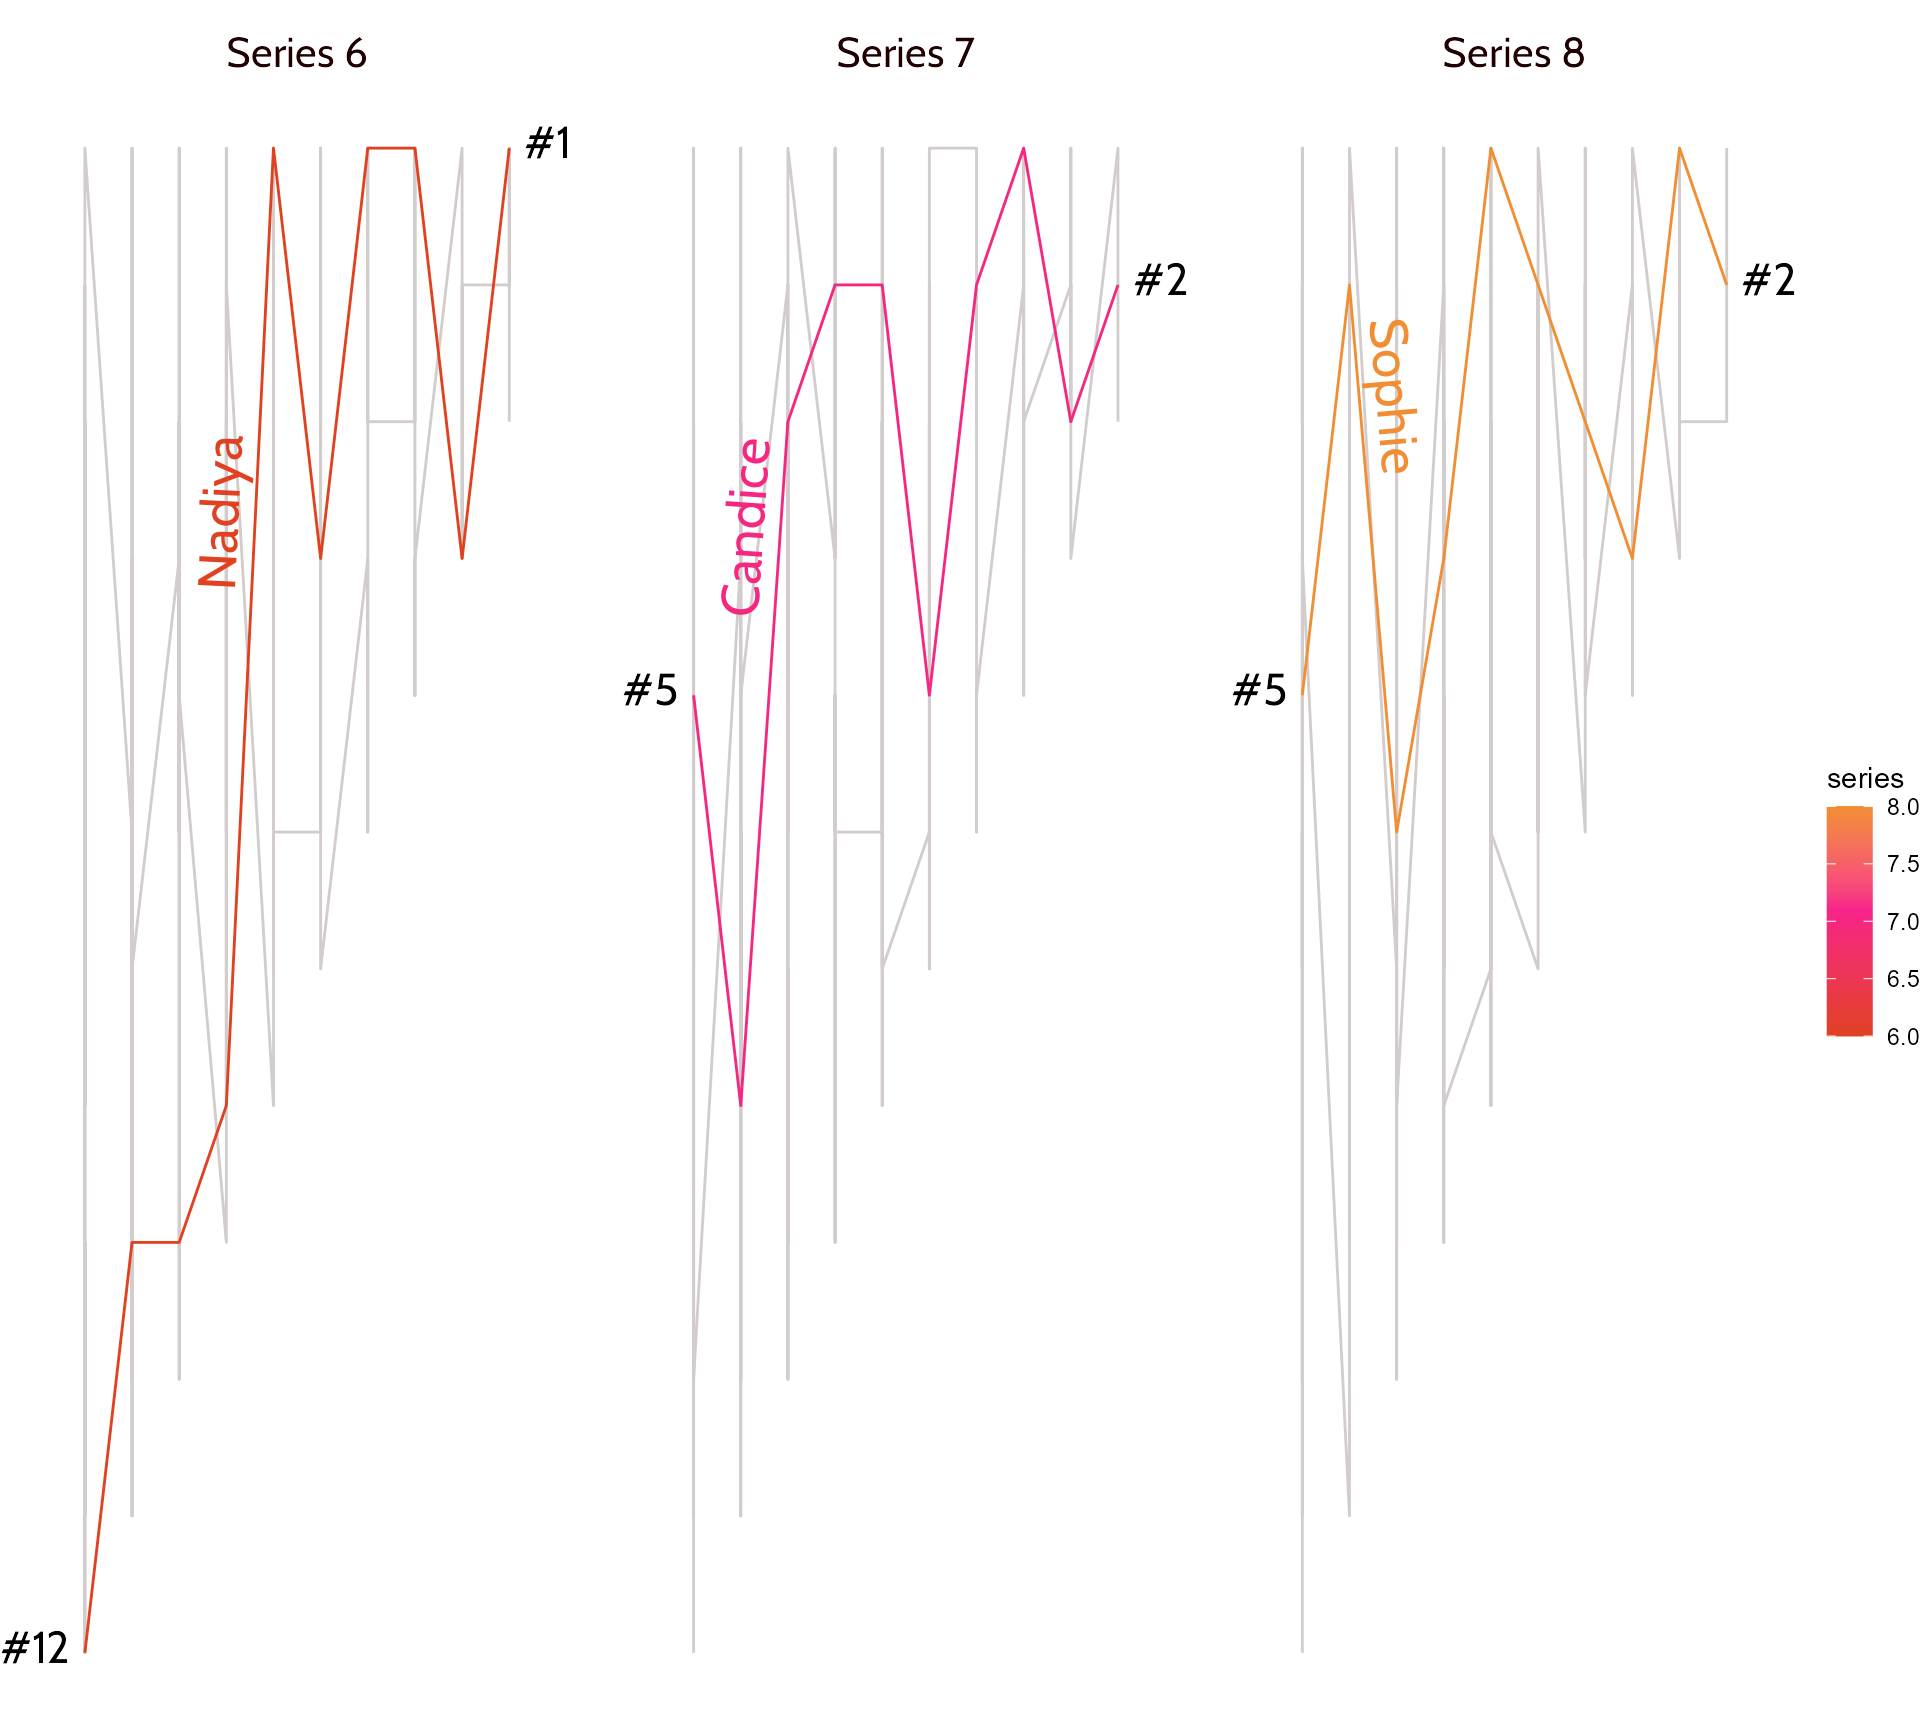
#5 Tie your text to the data
Use colour!
bakeoff::bakes_raw %>%
filter(series %in% c(6:8)) %>%
left_join(bakeoff::bakers %>%
filter(series_winner == 1)) %>%
ggplot(aes(x = episode,
y = -technical)) +
geom_path(aes(colour = series),
show.legend = FALSE) +
gghighlight::gghighlight(series_winner == 1,
calculate_per_facet = TRUE,
unhighlighted_params = list(color = "#D2CCCC")) +
scale_colour_gradient2(low = "#e04121", mid = "#f7238a",
high = "#ed9e00", midpoint = 7.1) +
facet_grid(. ~ series, labeller = as_labeller(function(x) paste("Series", x))) +
geomtextpath::geom_textpath(aes(label = baker,
colour = series),
vjust = -0.2,text_only = TRUE,
hjust = 0.3,
size = 7,
family = "Cabin",
show.legend = FALSE) +
ggtext::geom_textbox(data = bakeoff::bakes_raw %>%
filter(series %in% c(6:8)) %>%
left_join(bakeoff::bakers %>%
filter(series_winner == 1)) %>%
filter(series_winner == 1,
episode %in% c(1, 10)),
aes(label = paste0("#", technical),
hjust = case_when(episode == 1 ~ 1,
TRUE ~ 0),
halign = case_when(episode == 1 ~ 1,
TRUE ~ 0),
colour = series),
box.colour = NA,
size = 6,
family = "Cabin",
fill = NA) +
scale_x_continuous(expand = expansion(0.2)) +
theme_void() +
theme(strip.text = element_text(family = "Cabin", colour = "#200000",
size = 16,
margin = margin(c(12, 0, 0, 0))))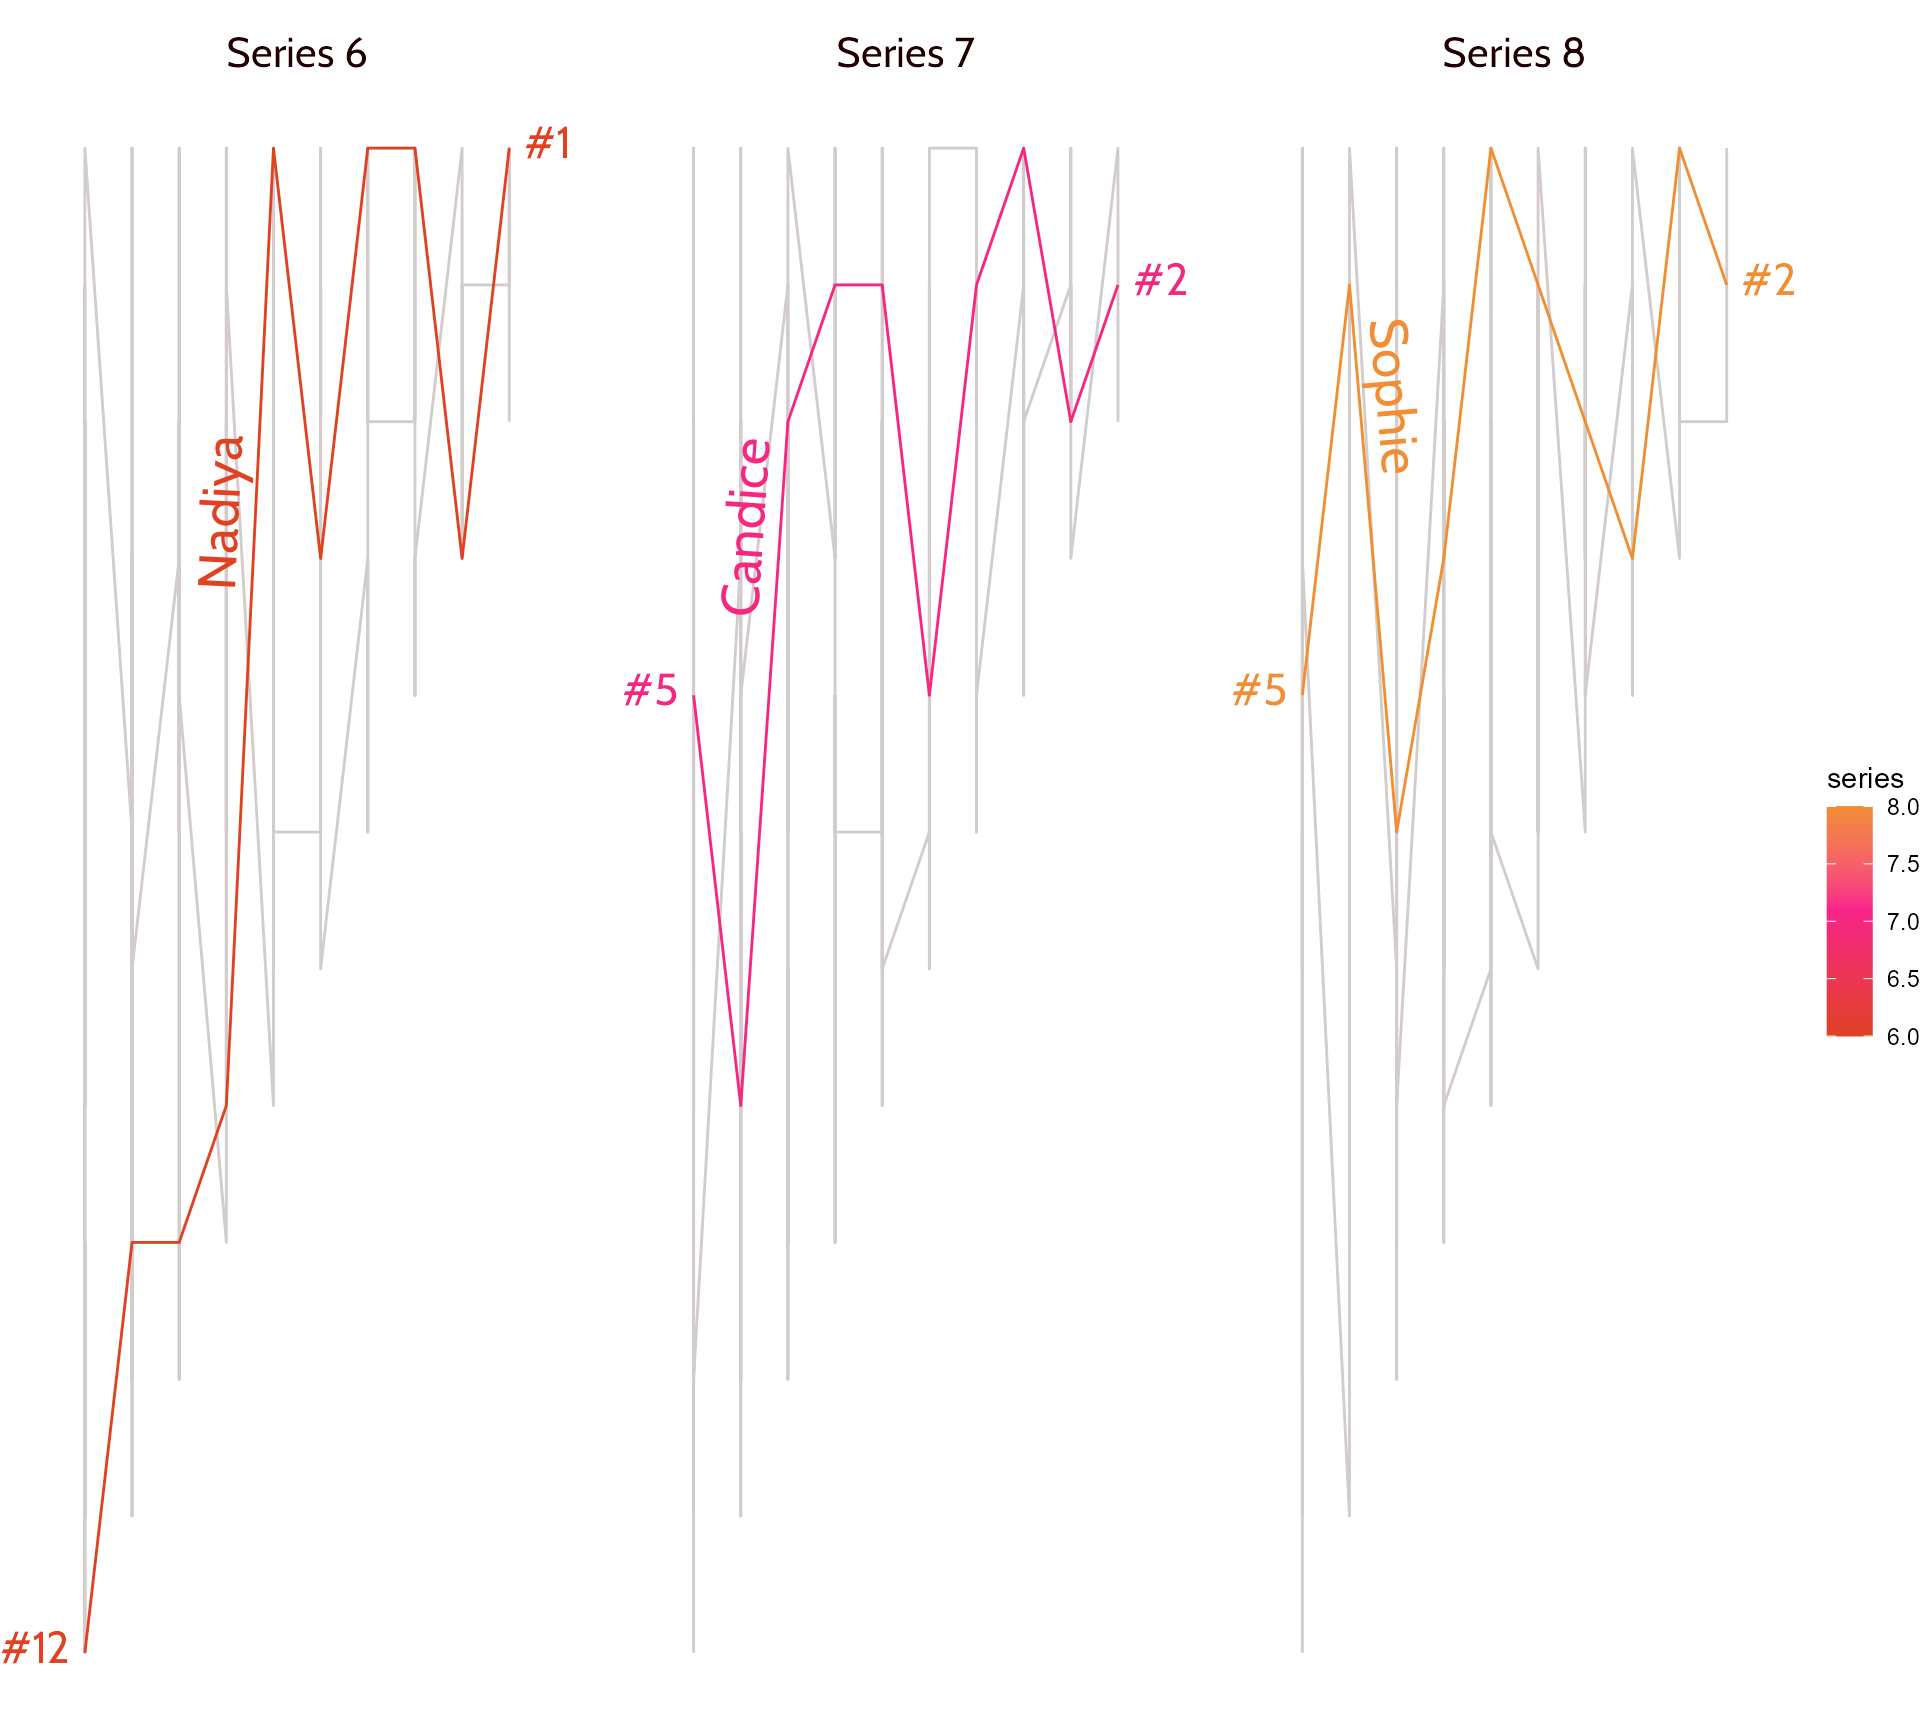
#5 Tie your text to the data
Use colour!
bakeoff::bakes_raw %>%
filter(series %in% c(6:8)) %>%
left_join(bakeoff::bakers %>%
filter(series_winner == 1)) %>%
ggplot(aes(x = episode,
y = -technical)) +
geom_path(aes(colour = series),
show.legend = FALSE) +
gghighlight::gghighlight(series_winner == 1,
calculate_per_facet = TRUE,
unhighlighted_params = list(color = "#D2CCCC")) +
scale_colour_gradient2(low = "#e04121", mid = "#f7238a",
high = "#ed9e00", midpoint = 7.1) +
facet_grid(. ~ series, labeller = as_labeller(function(x) paste("Series", x))) +
geomtextpath::geom_textpath(aes(label = baker,
colour = series),
vjust = -0.2,text_only = TRUE,
hjust = 0.3,
size = 7,
family = "Cabin",
show.legend = FALSE) +
ggtext::geom_textbox(data = bakeoff::bakes_raw %>%
filter(series %in% c(6:8)) %>%
left_join(bakeoff::bakers %>%
filter(series_winner == 1)) %>%
filter(series_winner == 1,
episode %in% c(1, 10)),
aes(label = paste0("#", technical),
hjust = case_when(episode == 1 ~ 1,
TRUE ~ 0),
halign = case_when(episode == 1 ~ 1,
TRUE ~ 0),
colour = series),
box.colour = NA,
size = 6,
family = "Cabin",
fill = NA) +
scale_x_continuous(expand = expansion(0.2)) +
theme_void() +
theme(strip.text = element_text(family = "Cabin", colour = "#200000",
size = 16,
margin = margin(c(12, 0, 0, 0))),
legend.position = "none")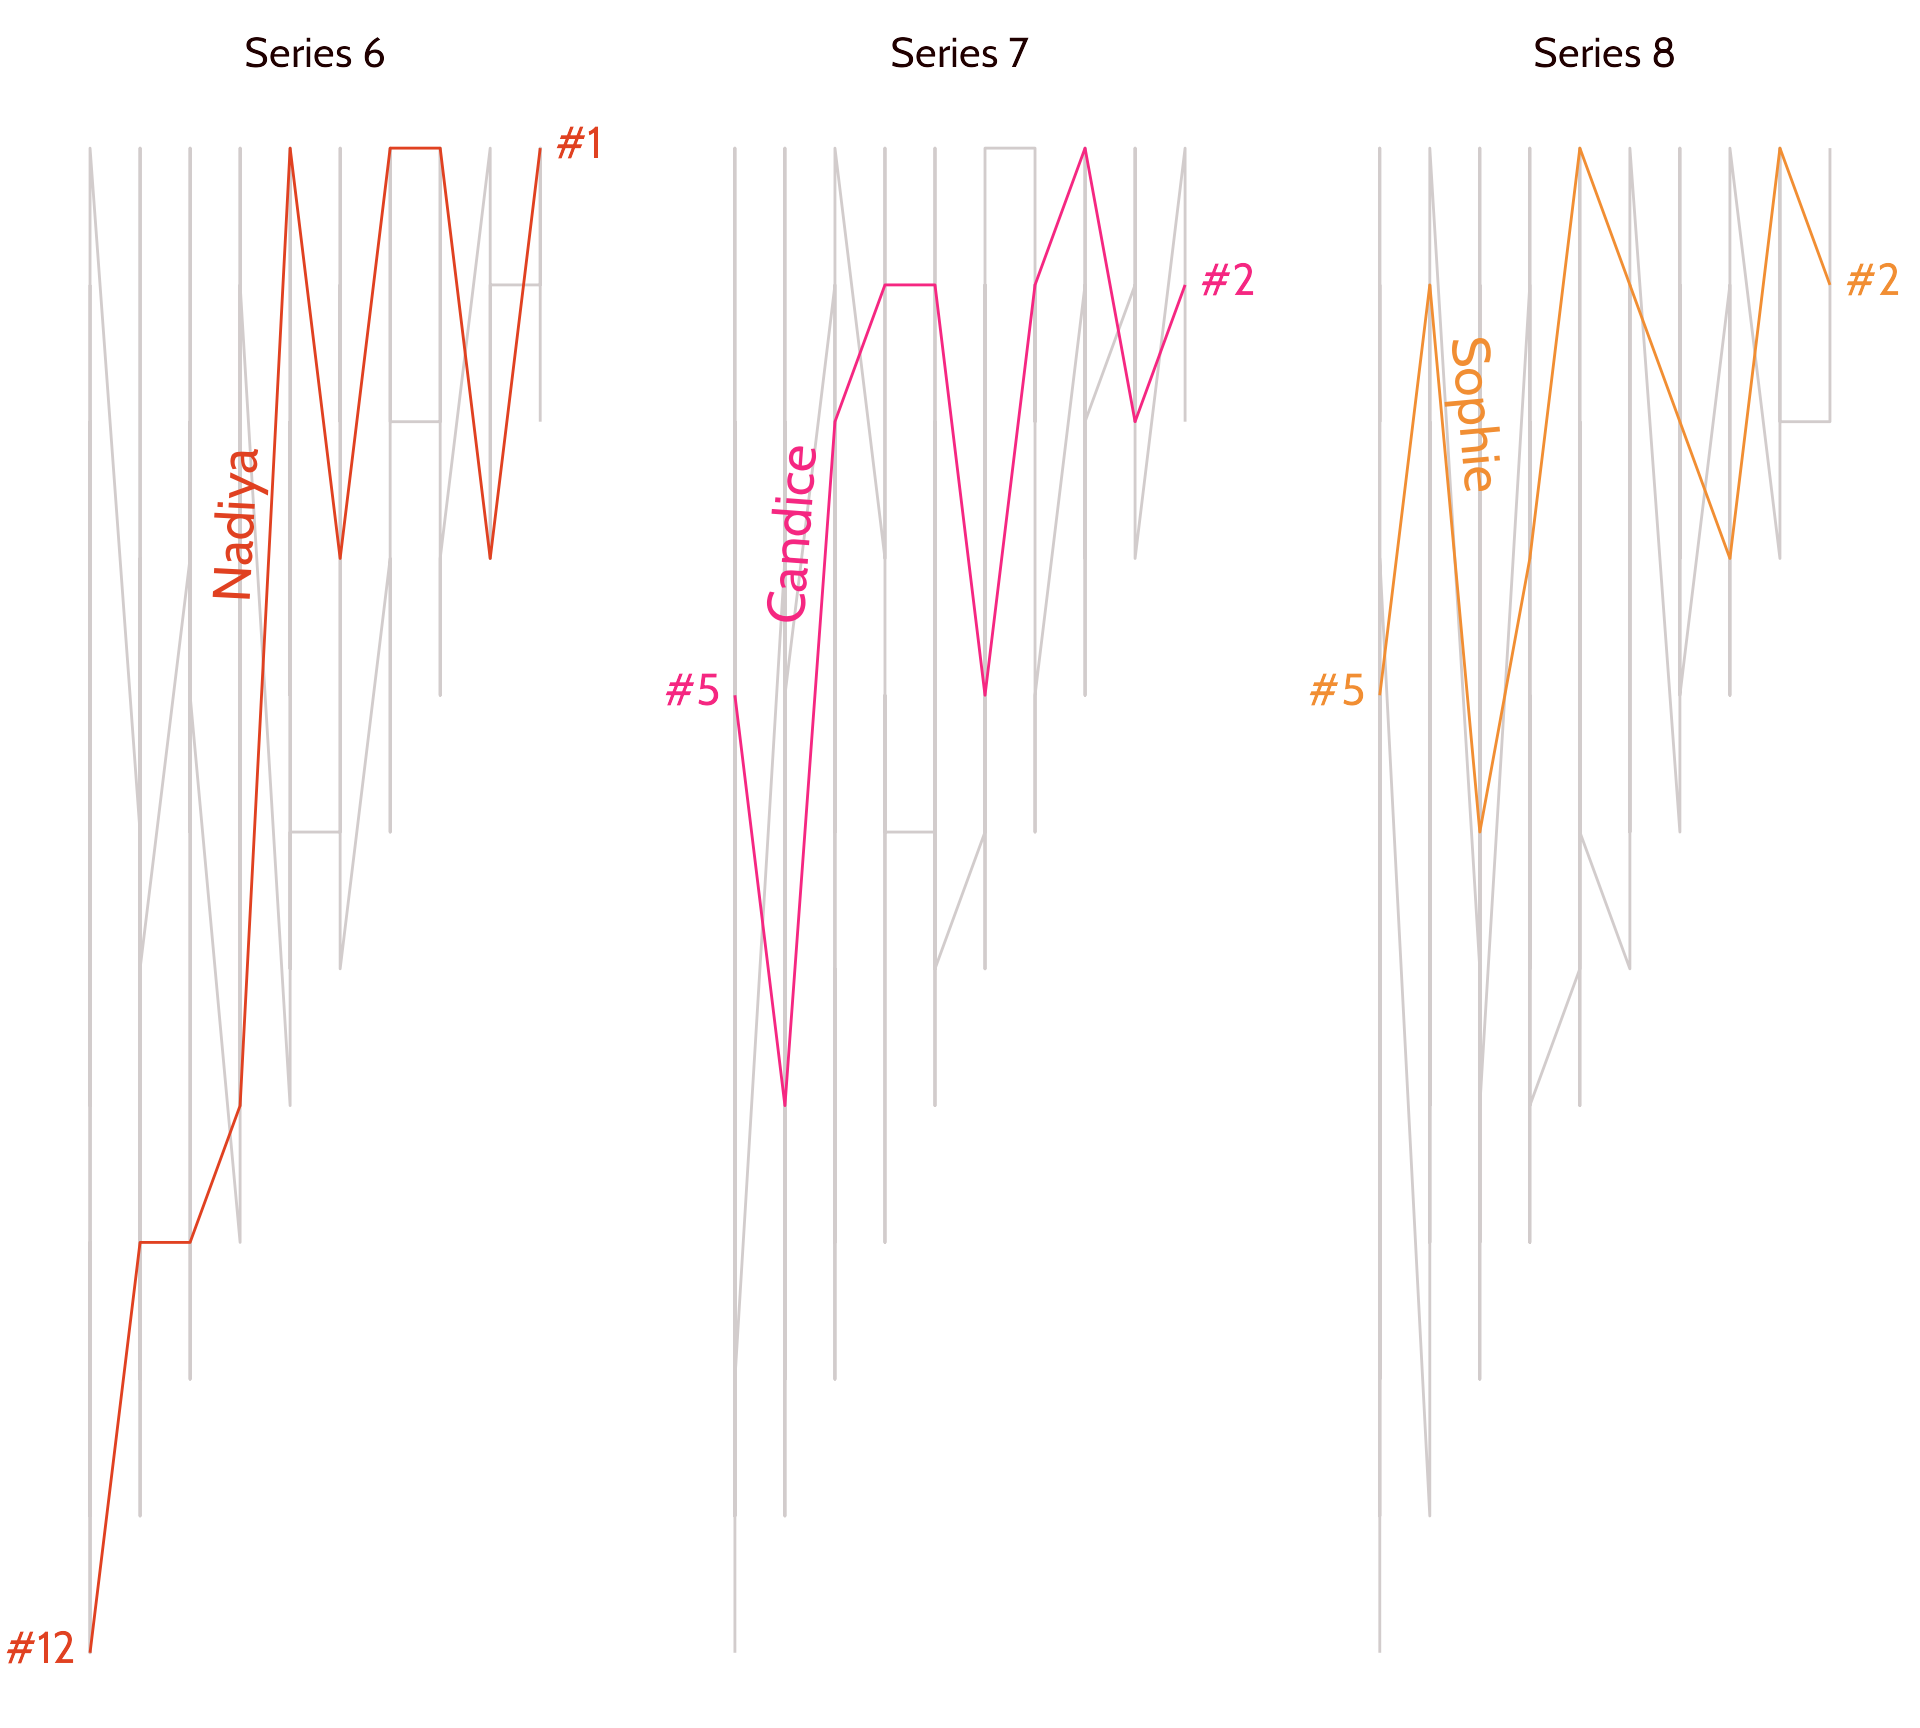
#5 Tie your text to the data


#7 Signpost additional information
Time to get interactive! {ggiraph}

ggiraph::girafe()
- Show the main data story
- Allow people to access the detail they’re interested in
- Show them lots of information about one thing
- … rather than indigestible information about everything
- Keep the ggplot styling you’ve worked hard to get right
- Tweak a few extra things
#7 Signpost additional information
A (relatively easy) technical challenge
bakeoff::challenges %>%
select(-technical) %>%
pivot_longer(c(signature, showstopper)) %>%
mutate(choc_raspberry = case_when(grepl("[Cc]hocolate", value) & grepl("[Rr]aspberr", value) ~ "Both",
grepl("[Cc]hocolate", value) == T ~ "Chocolate",
grepl("[Rr]aspberry", value) == T ~ "Raspberry")) %>%
filter(!is.na(choc_raspberry)) %>%
ggplot() +
geom_rect(aes(xmin = -Inf, ymin = -Inf, xmax = Inf, ymax = Inf), fill = "#300300") +
geom_jitter(aes(x = 1, y = 1),
alpha = 0.7,
shape = 21,
size = 10,
colour = "#ec3f24",
fill = "#b41504") +
coord_polar() +
scale_colour_identity() +
scale_y_discrete(expand = c(0.05, 0)) +
labs(title = "Chocolate & Raspberry Bakes") +
theme_void() +
theme(plot.title = element_text(family = "Cabin", size = 24,
colour = "#200000", hjust = 0.5,
lineheight = 1.3))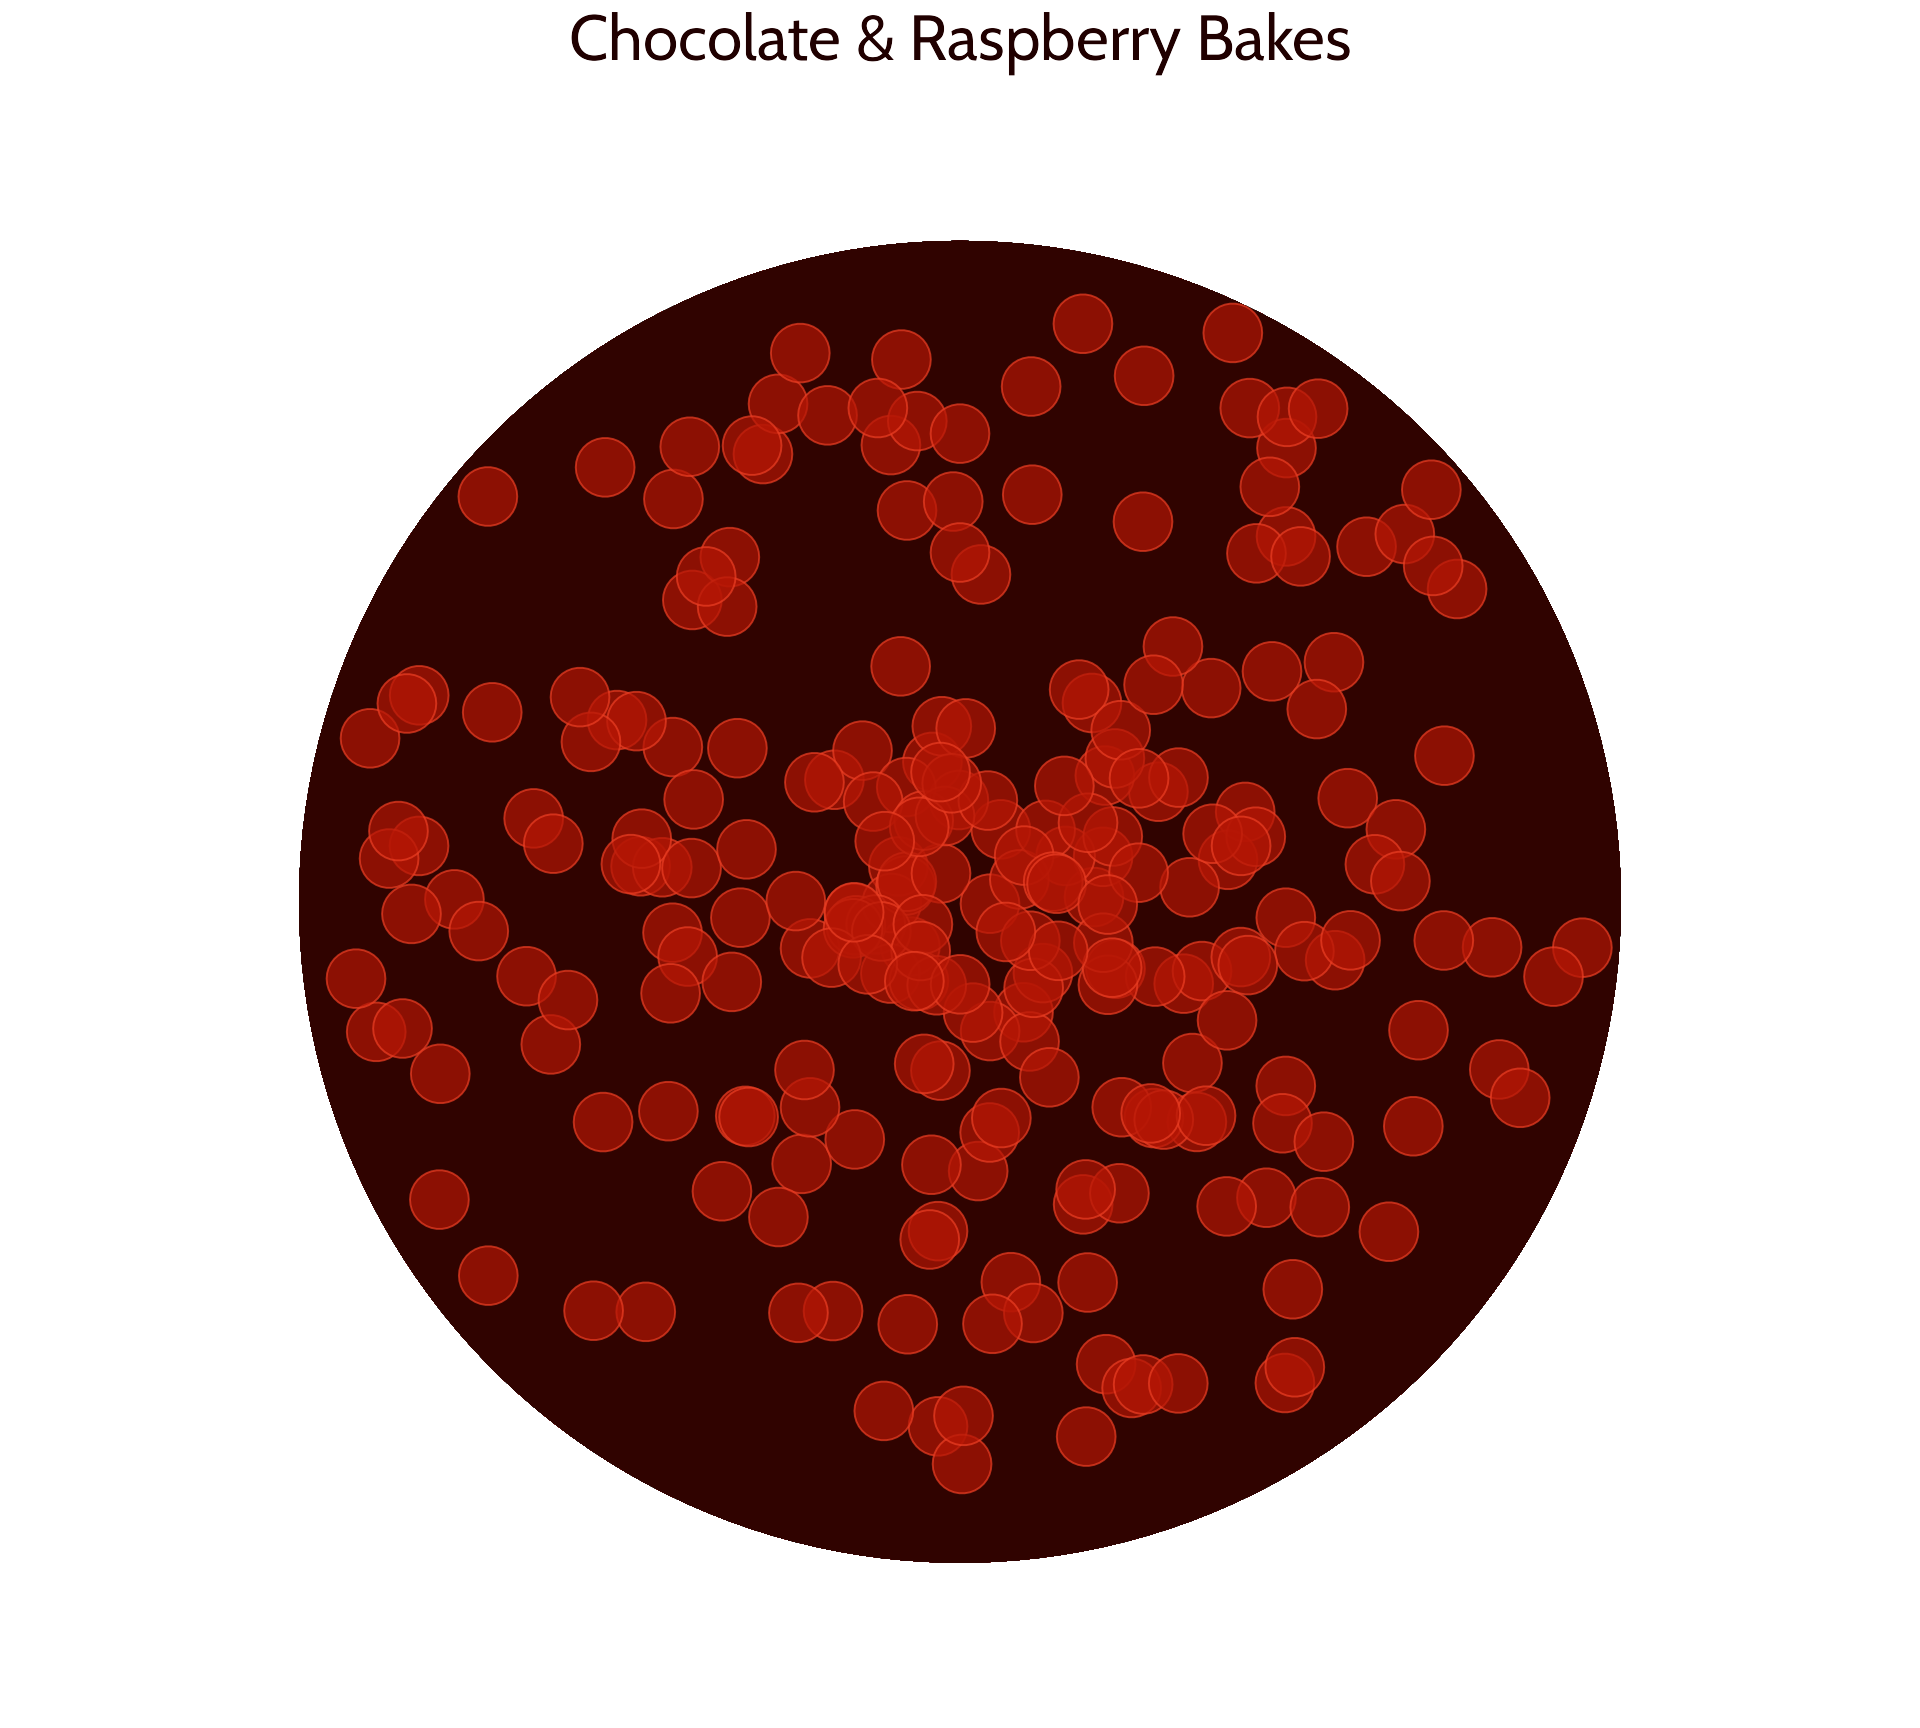
#10 Give everything space to breathe
Back to the start

#10 Give everything space to breathe
Add plot margin

#10 Give everything space to breathe
Increase lineheight

#10 Give everything space to breathe
Add margin under subtitle
#10 Give everything space to breathe

Over to you