Ten tips for better text
R Ladies Rome | Code-along Workshop | 30th November 2023
10 tips for making text better
- Using
{bakeoff}by Alison Presmanes Hill - Namespacing
package::function("blah")
- Choose your own pipe
- I like the old one
- All the code and slides available on my talks page
hello@cararthompson.com
Our starting point
A plot!
Our starting point
Mini tip - theme_minimal()!
Our starting point
Let’s add a bit of text…
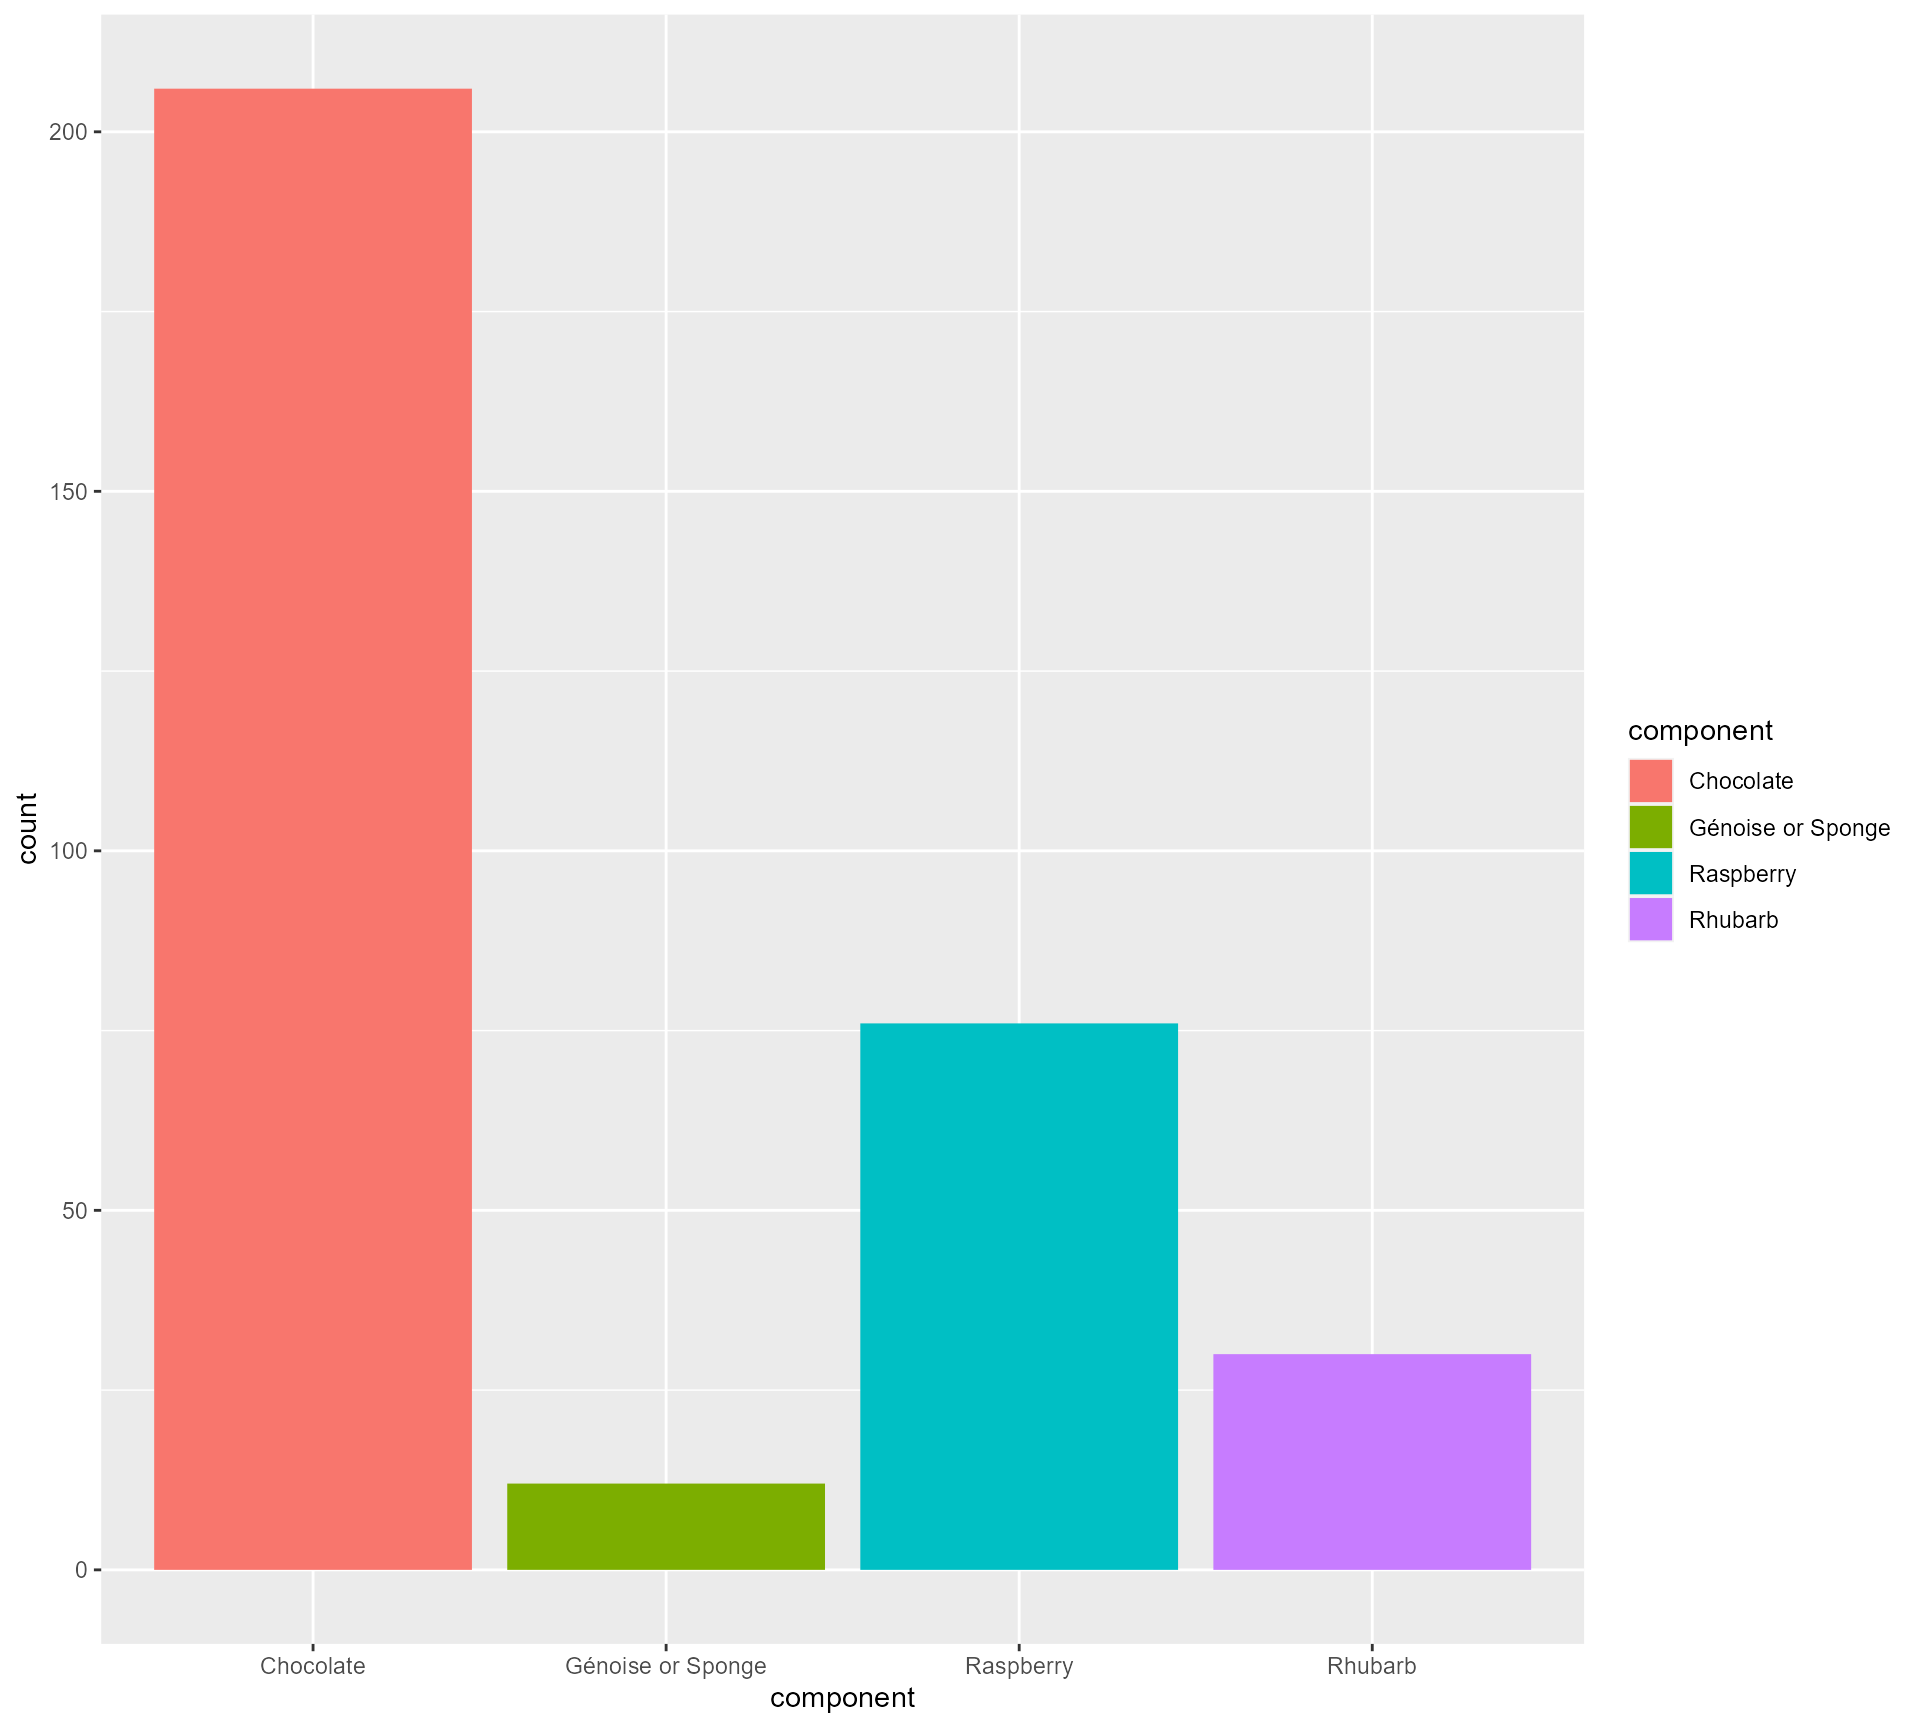
key_components %>%
ggplot(aes(x = component,
y = count,
fill = component)) +
geom_bar(stat = "identity") +
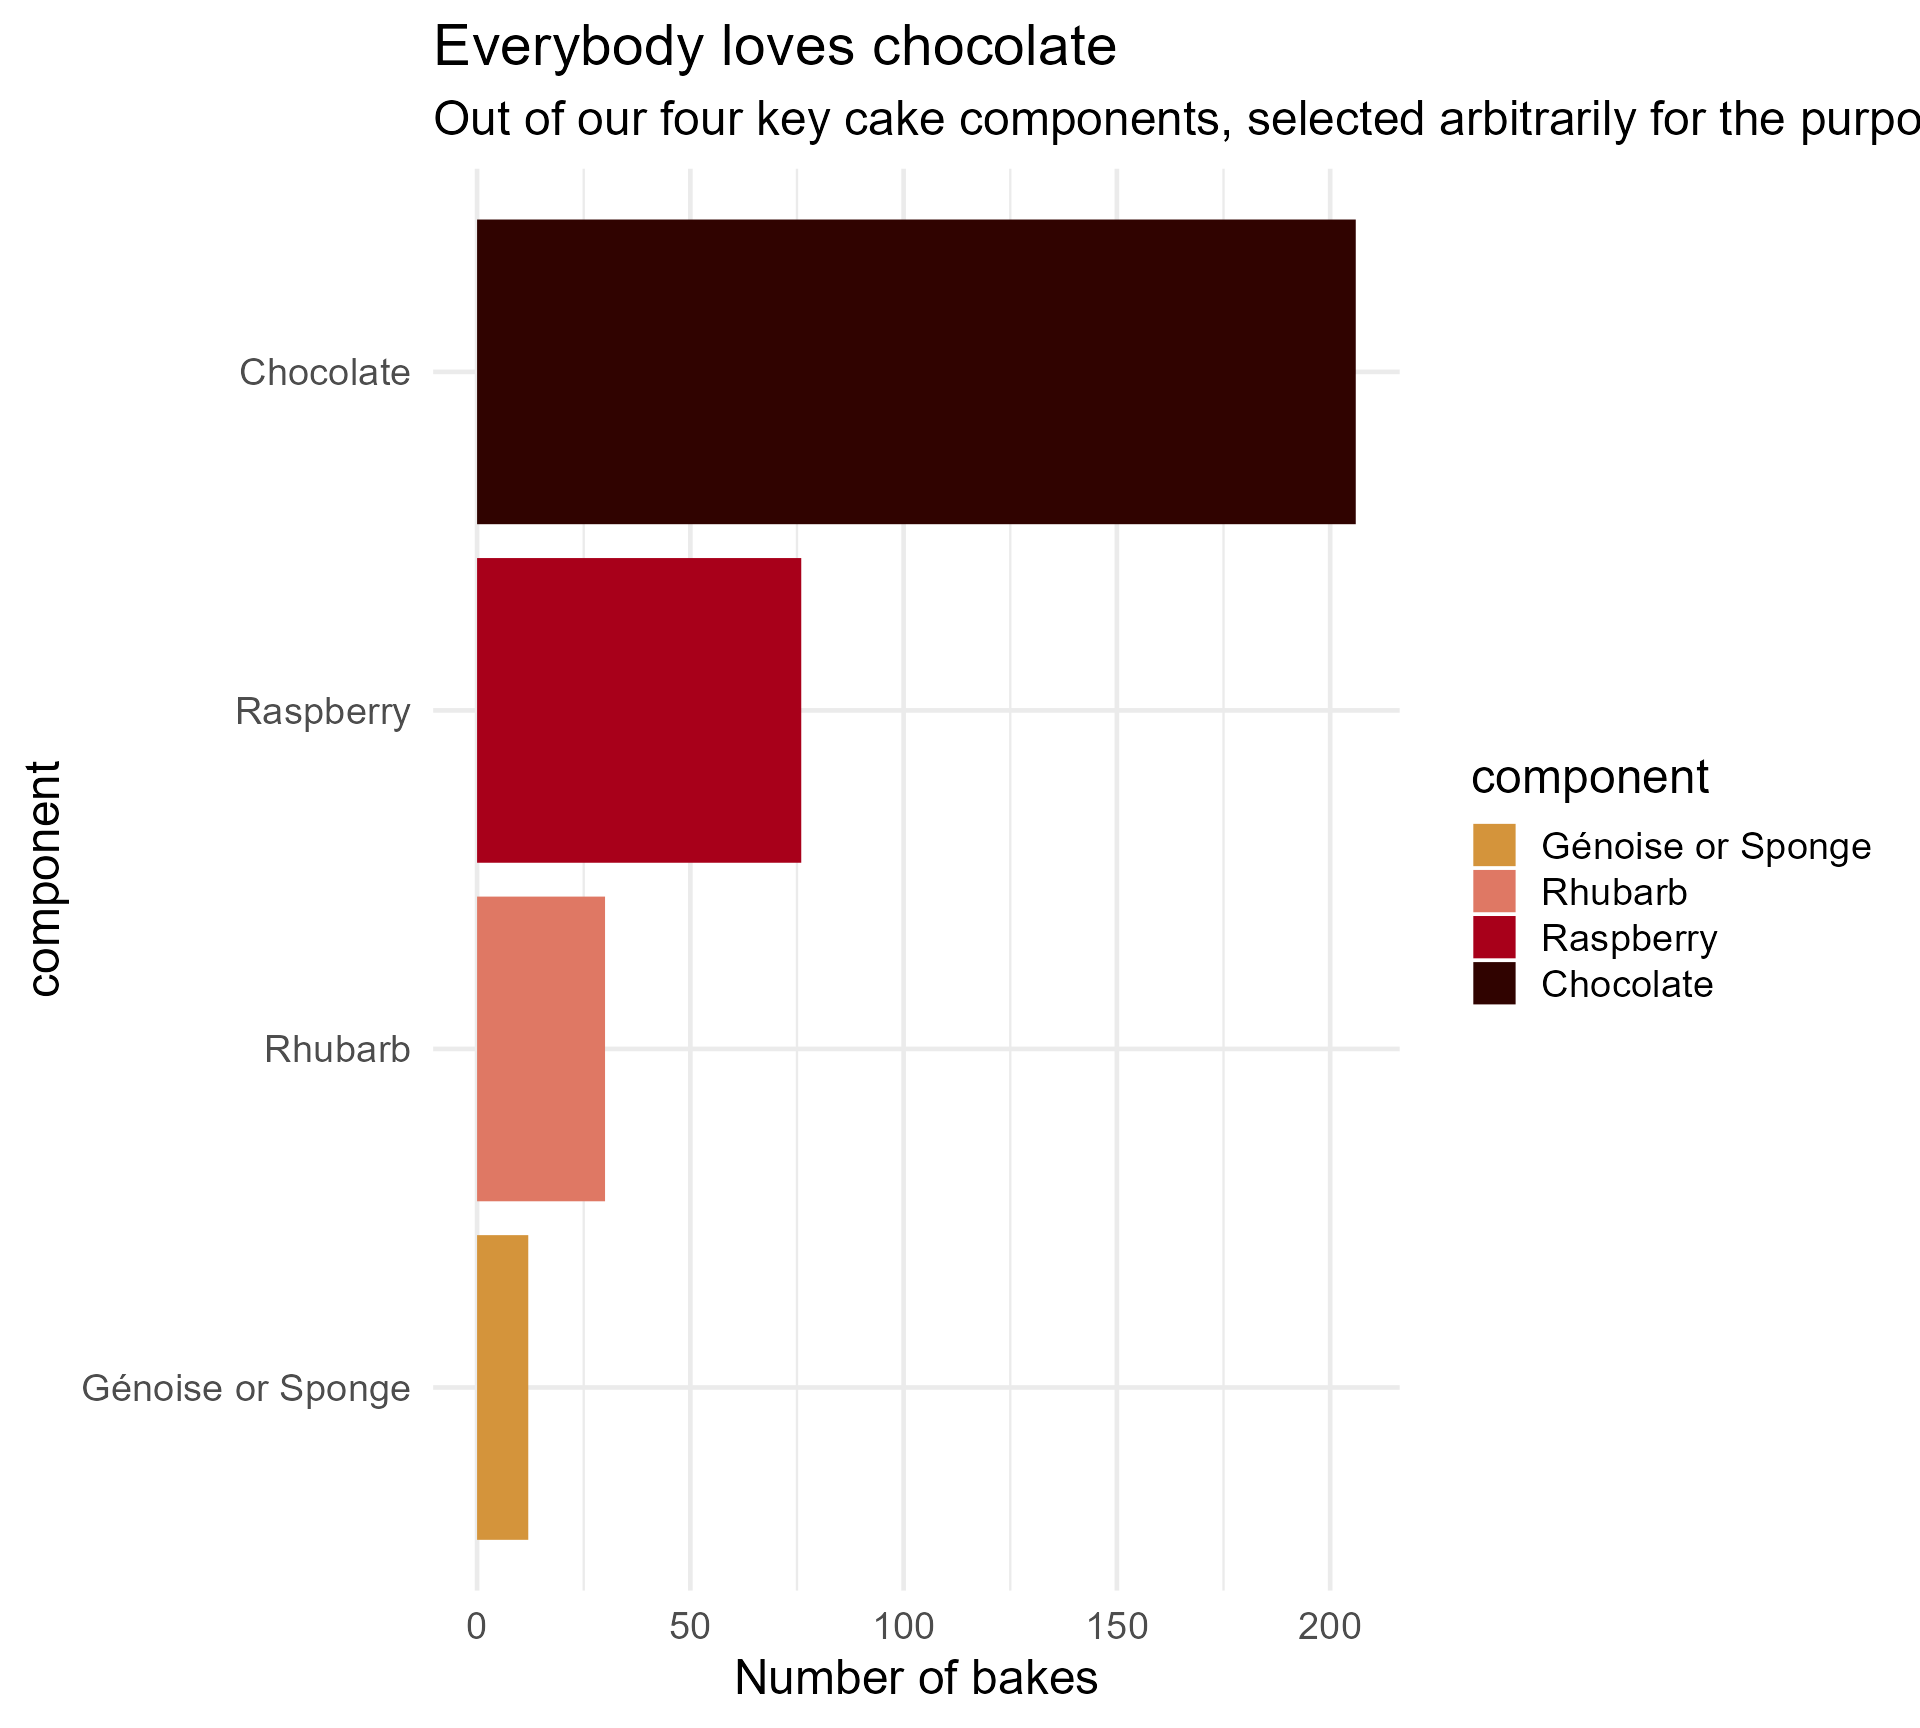
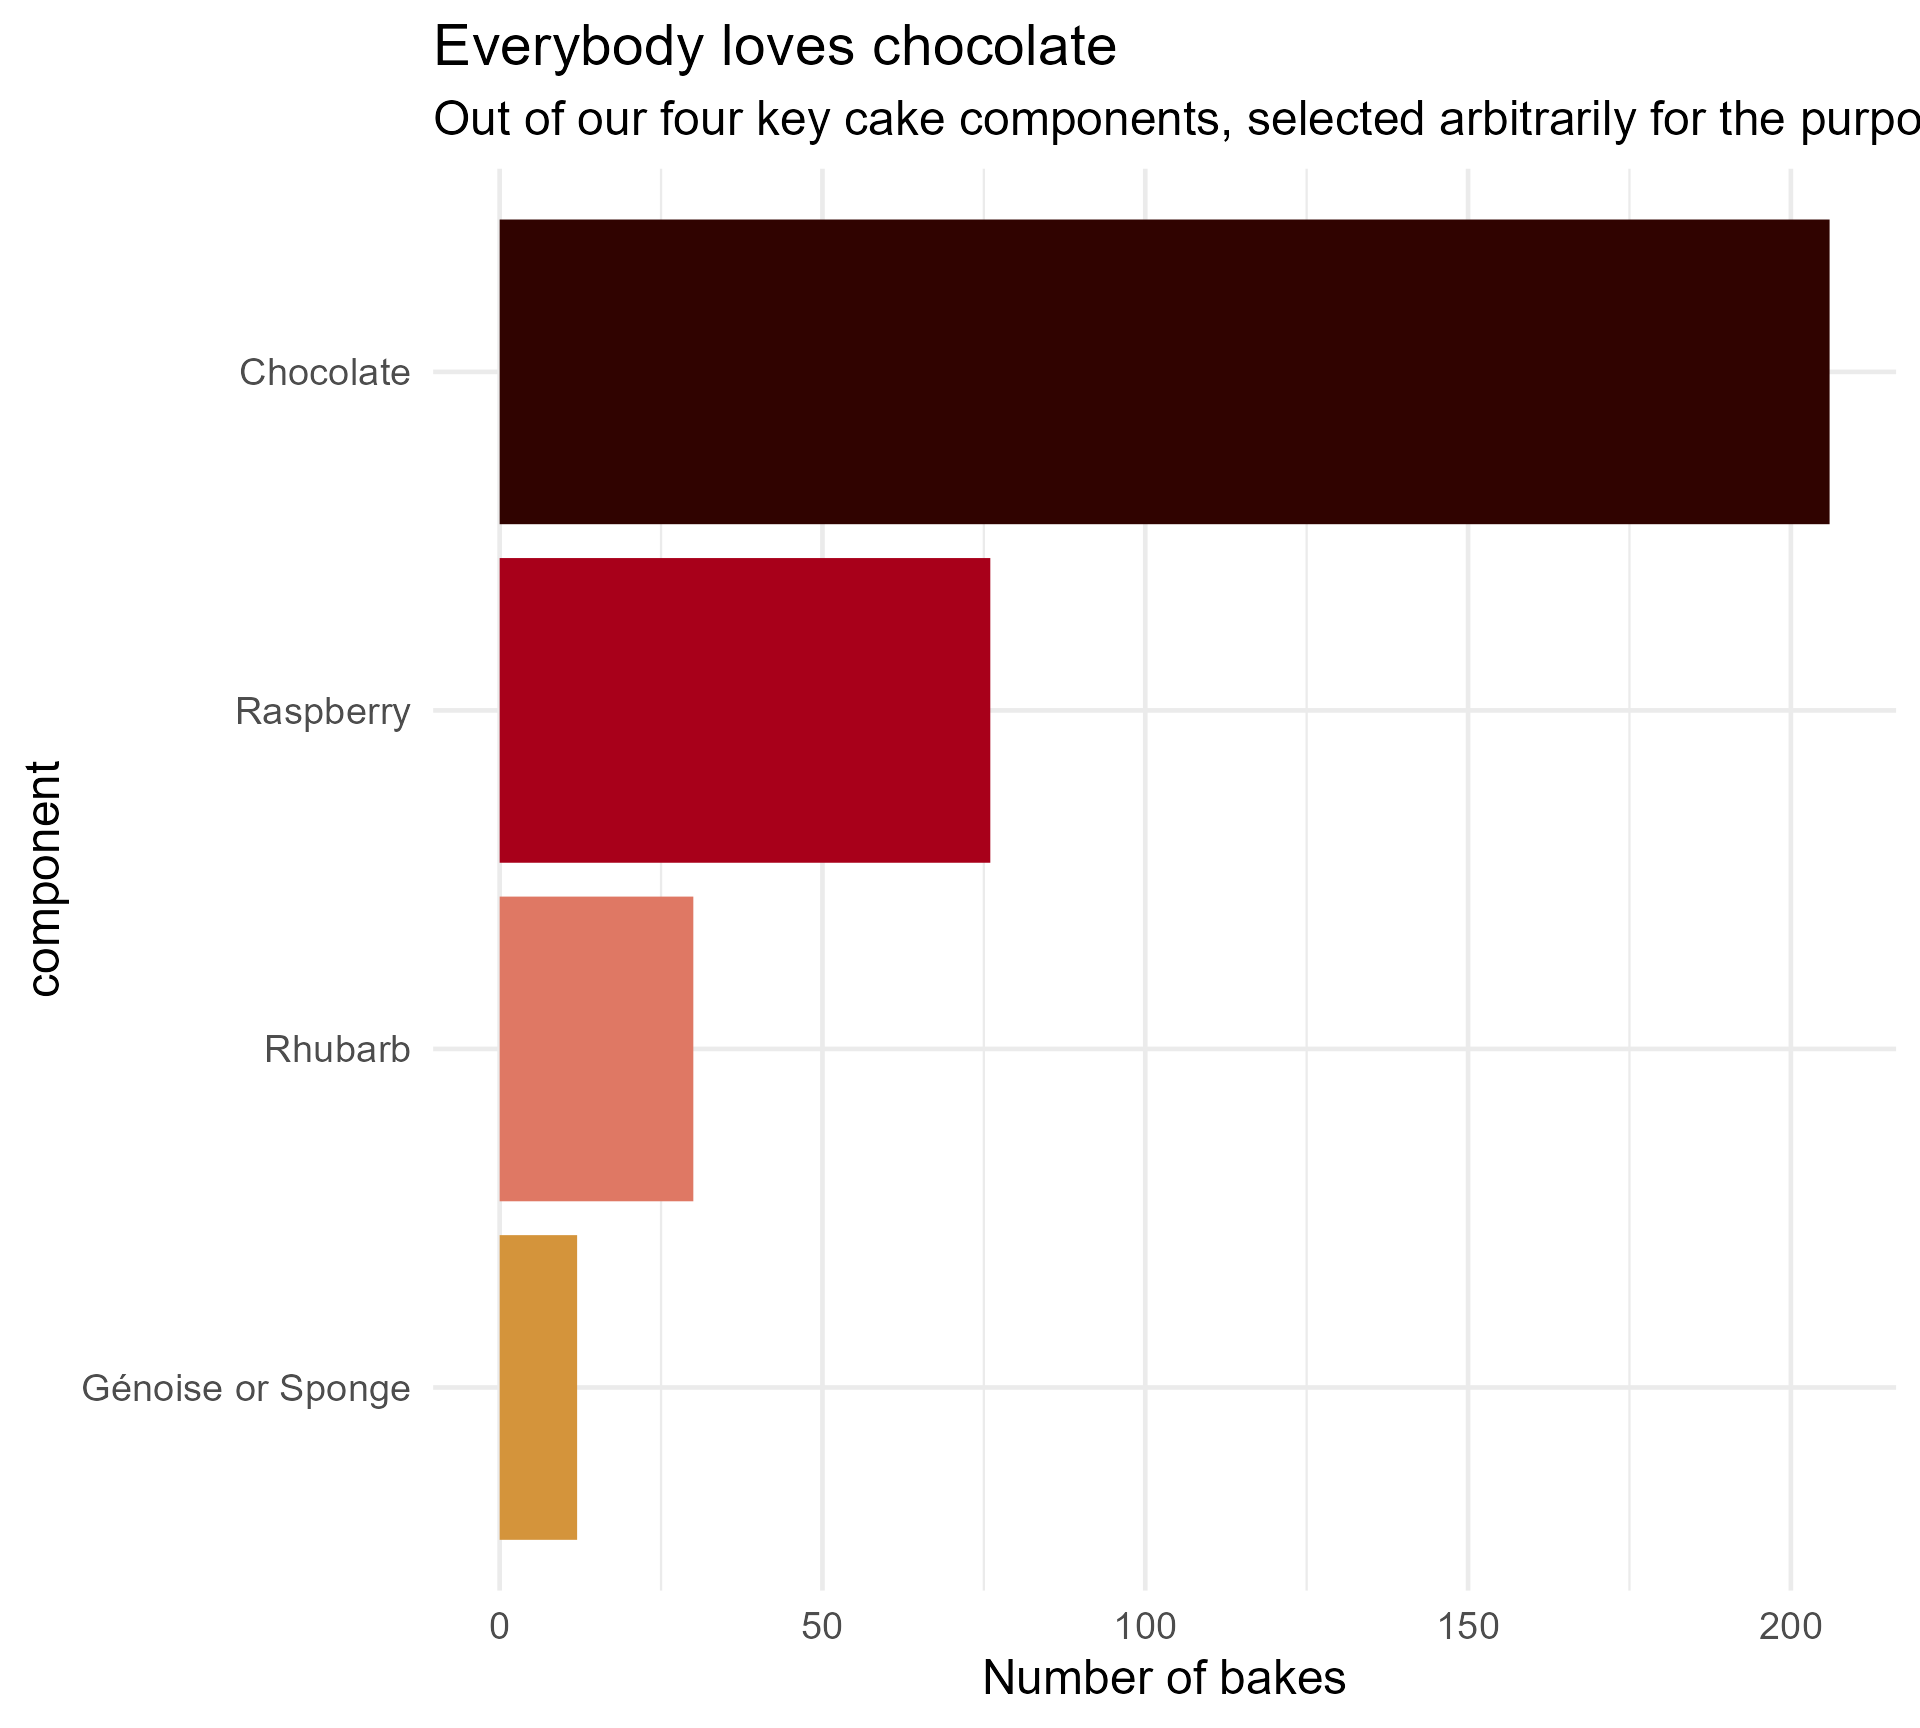
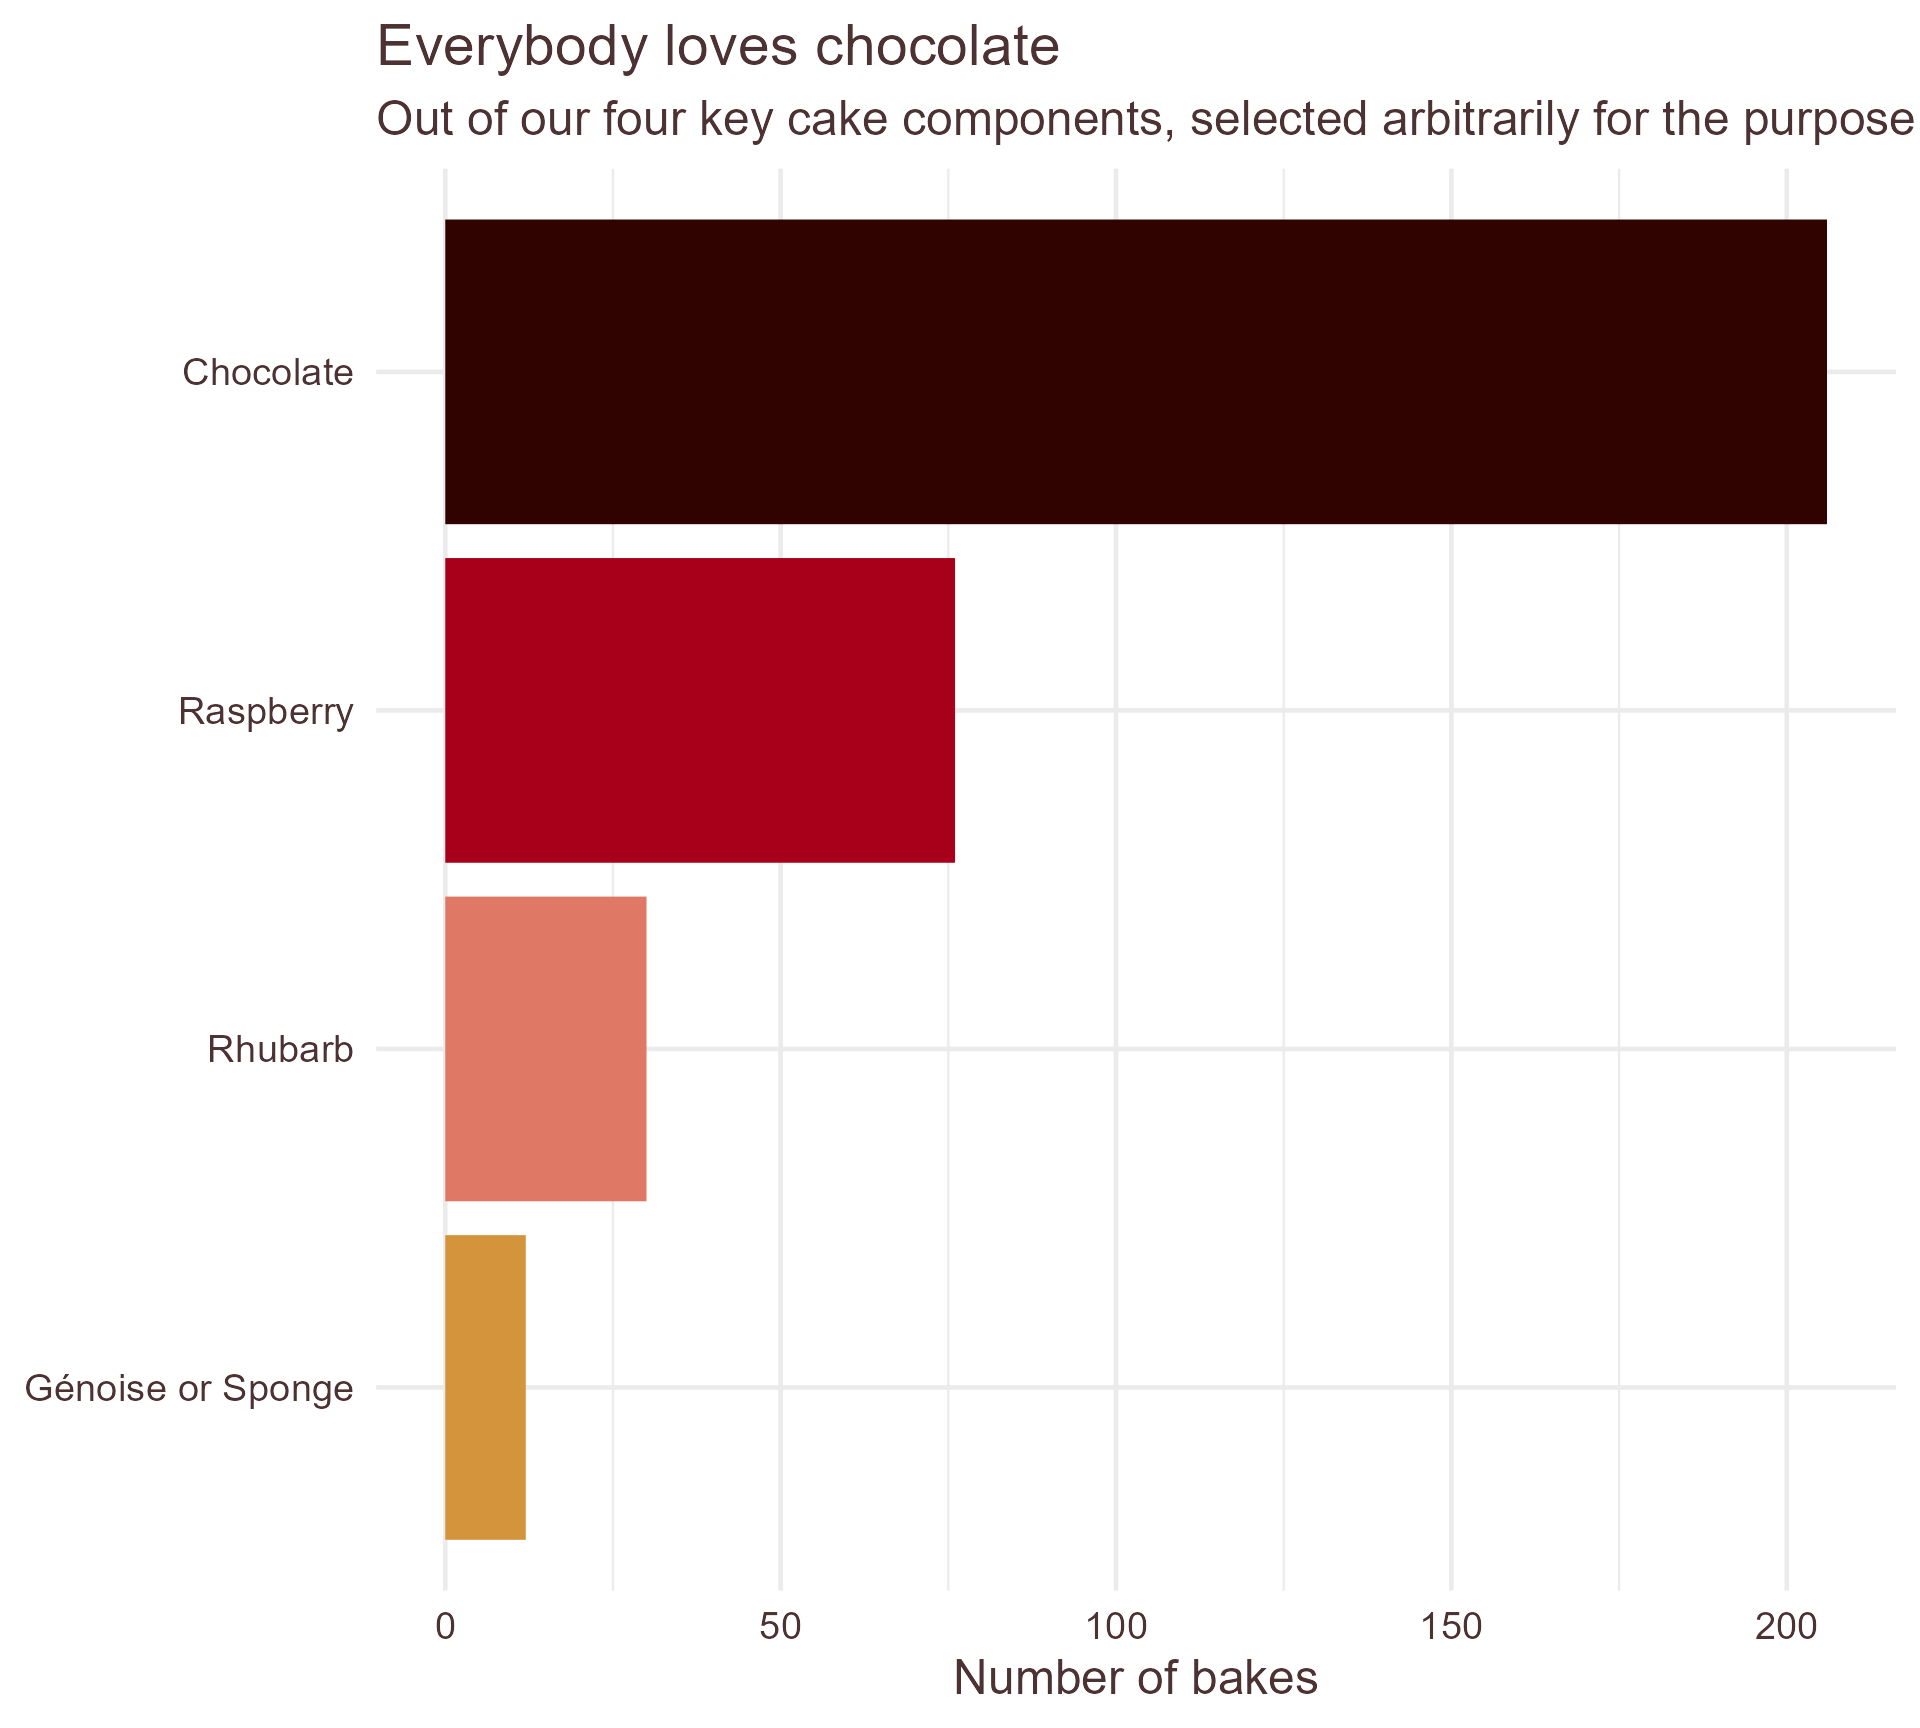
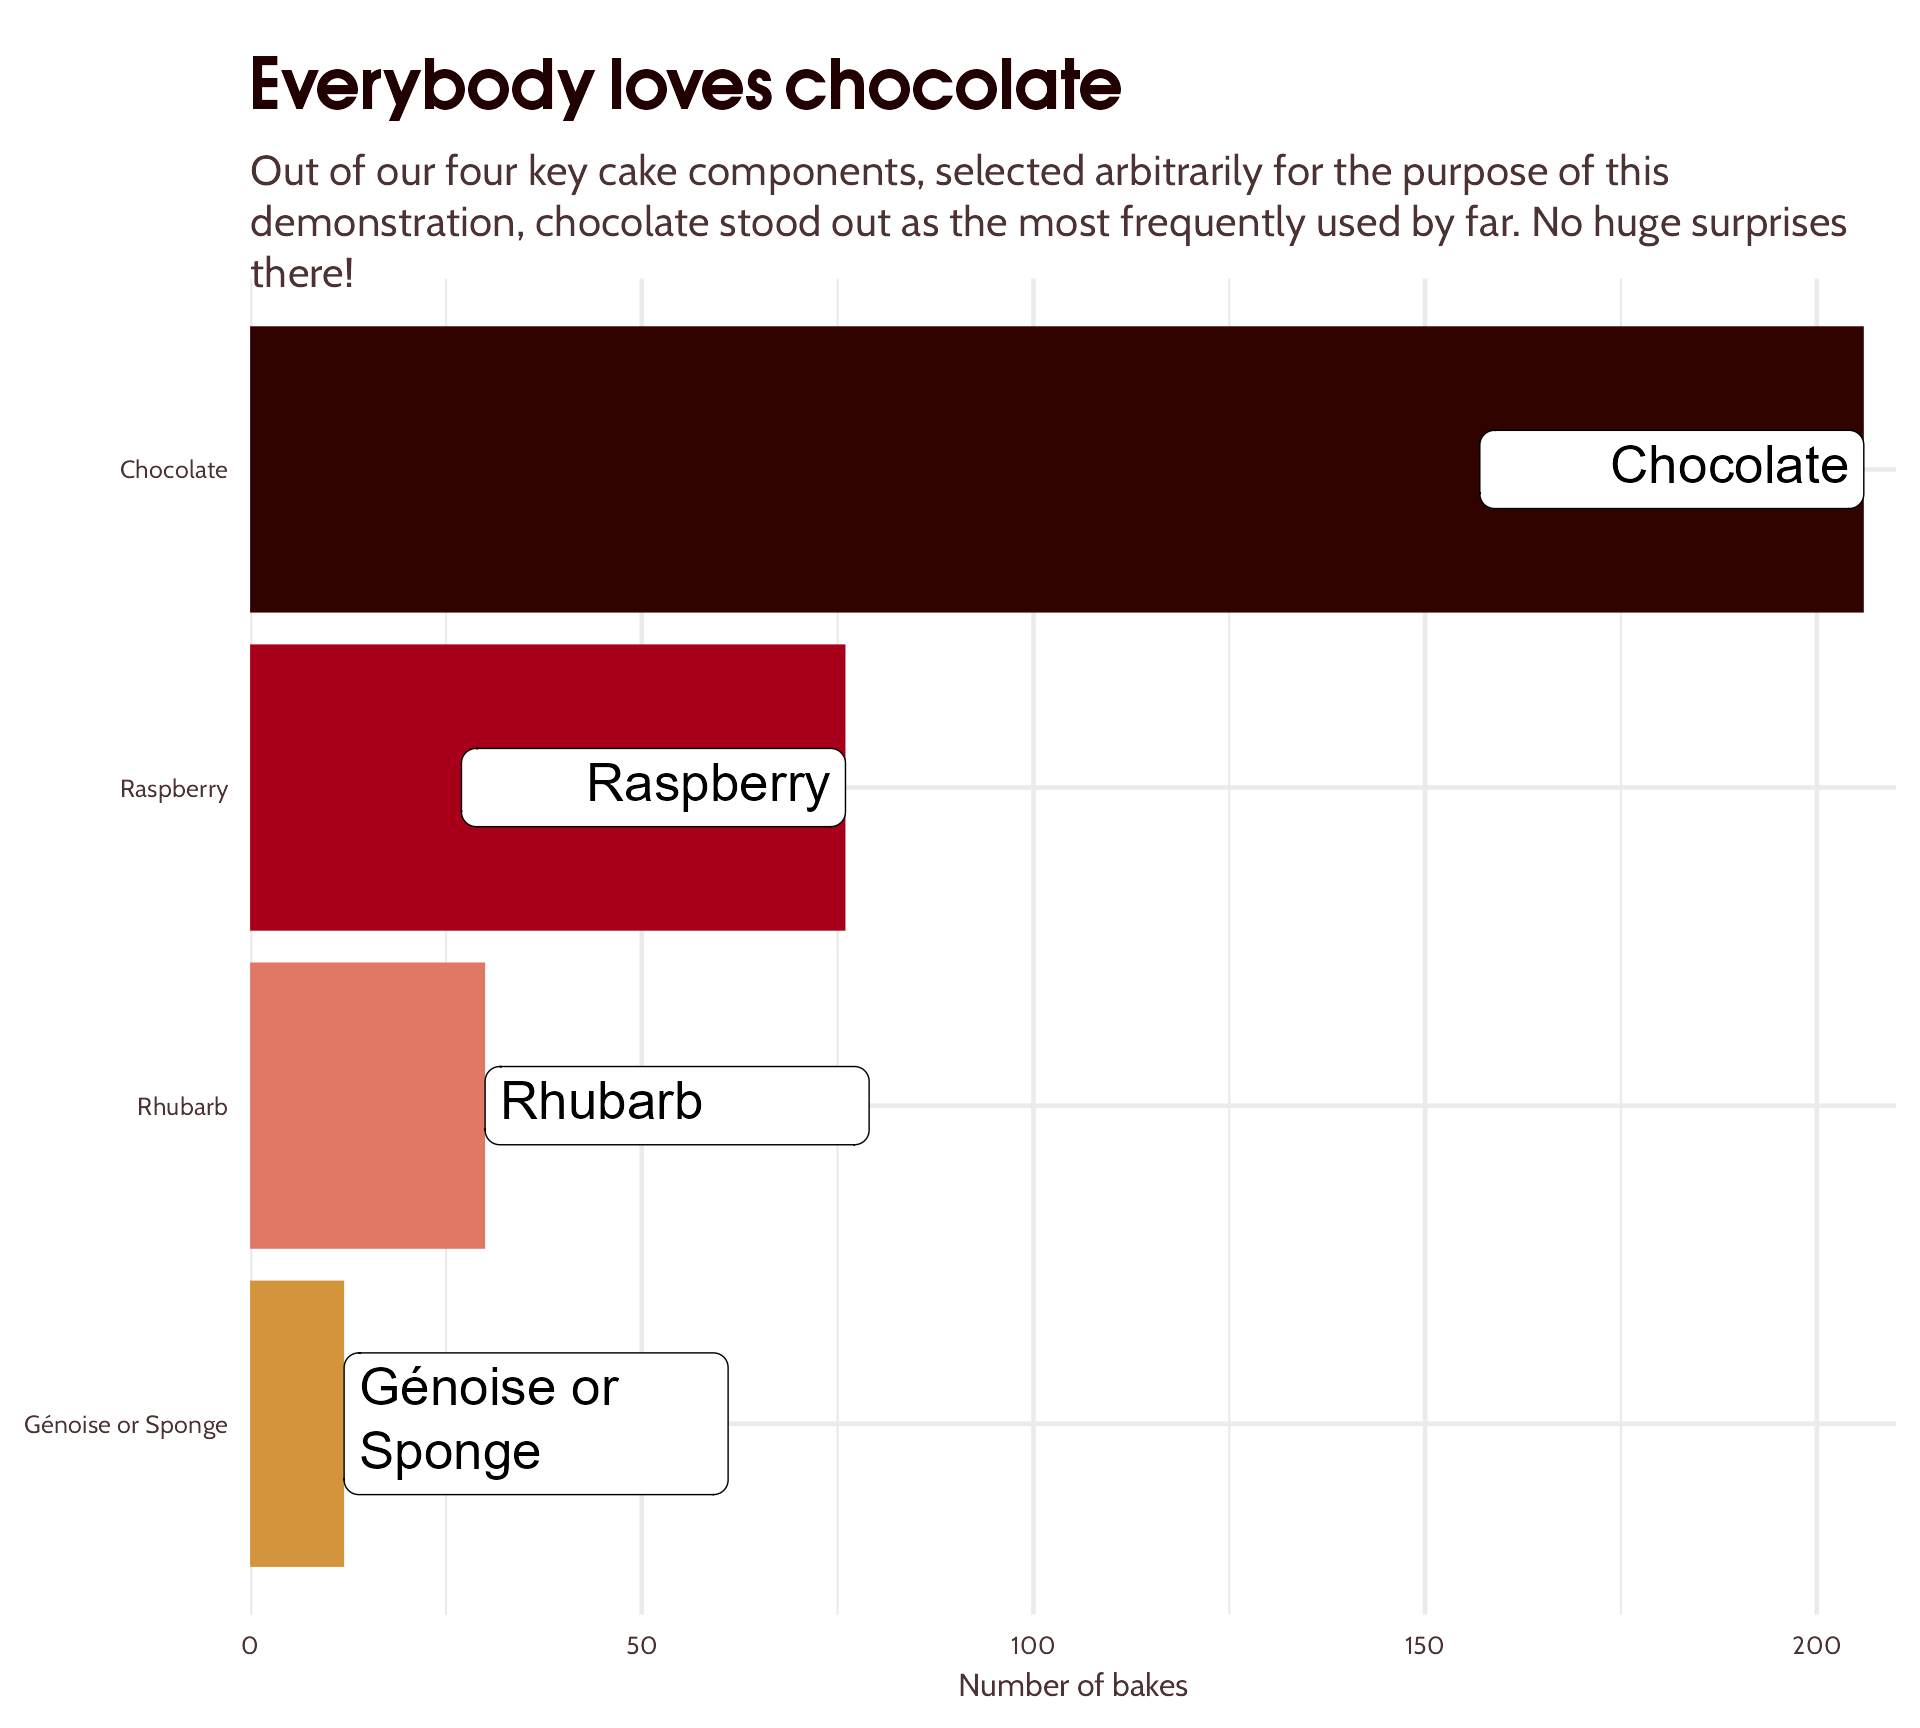
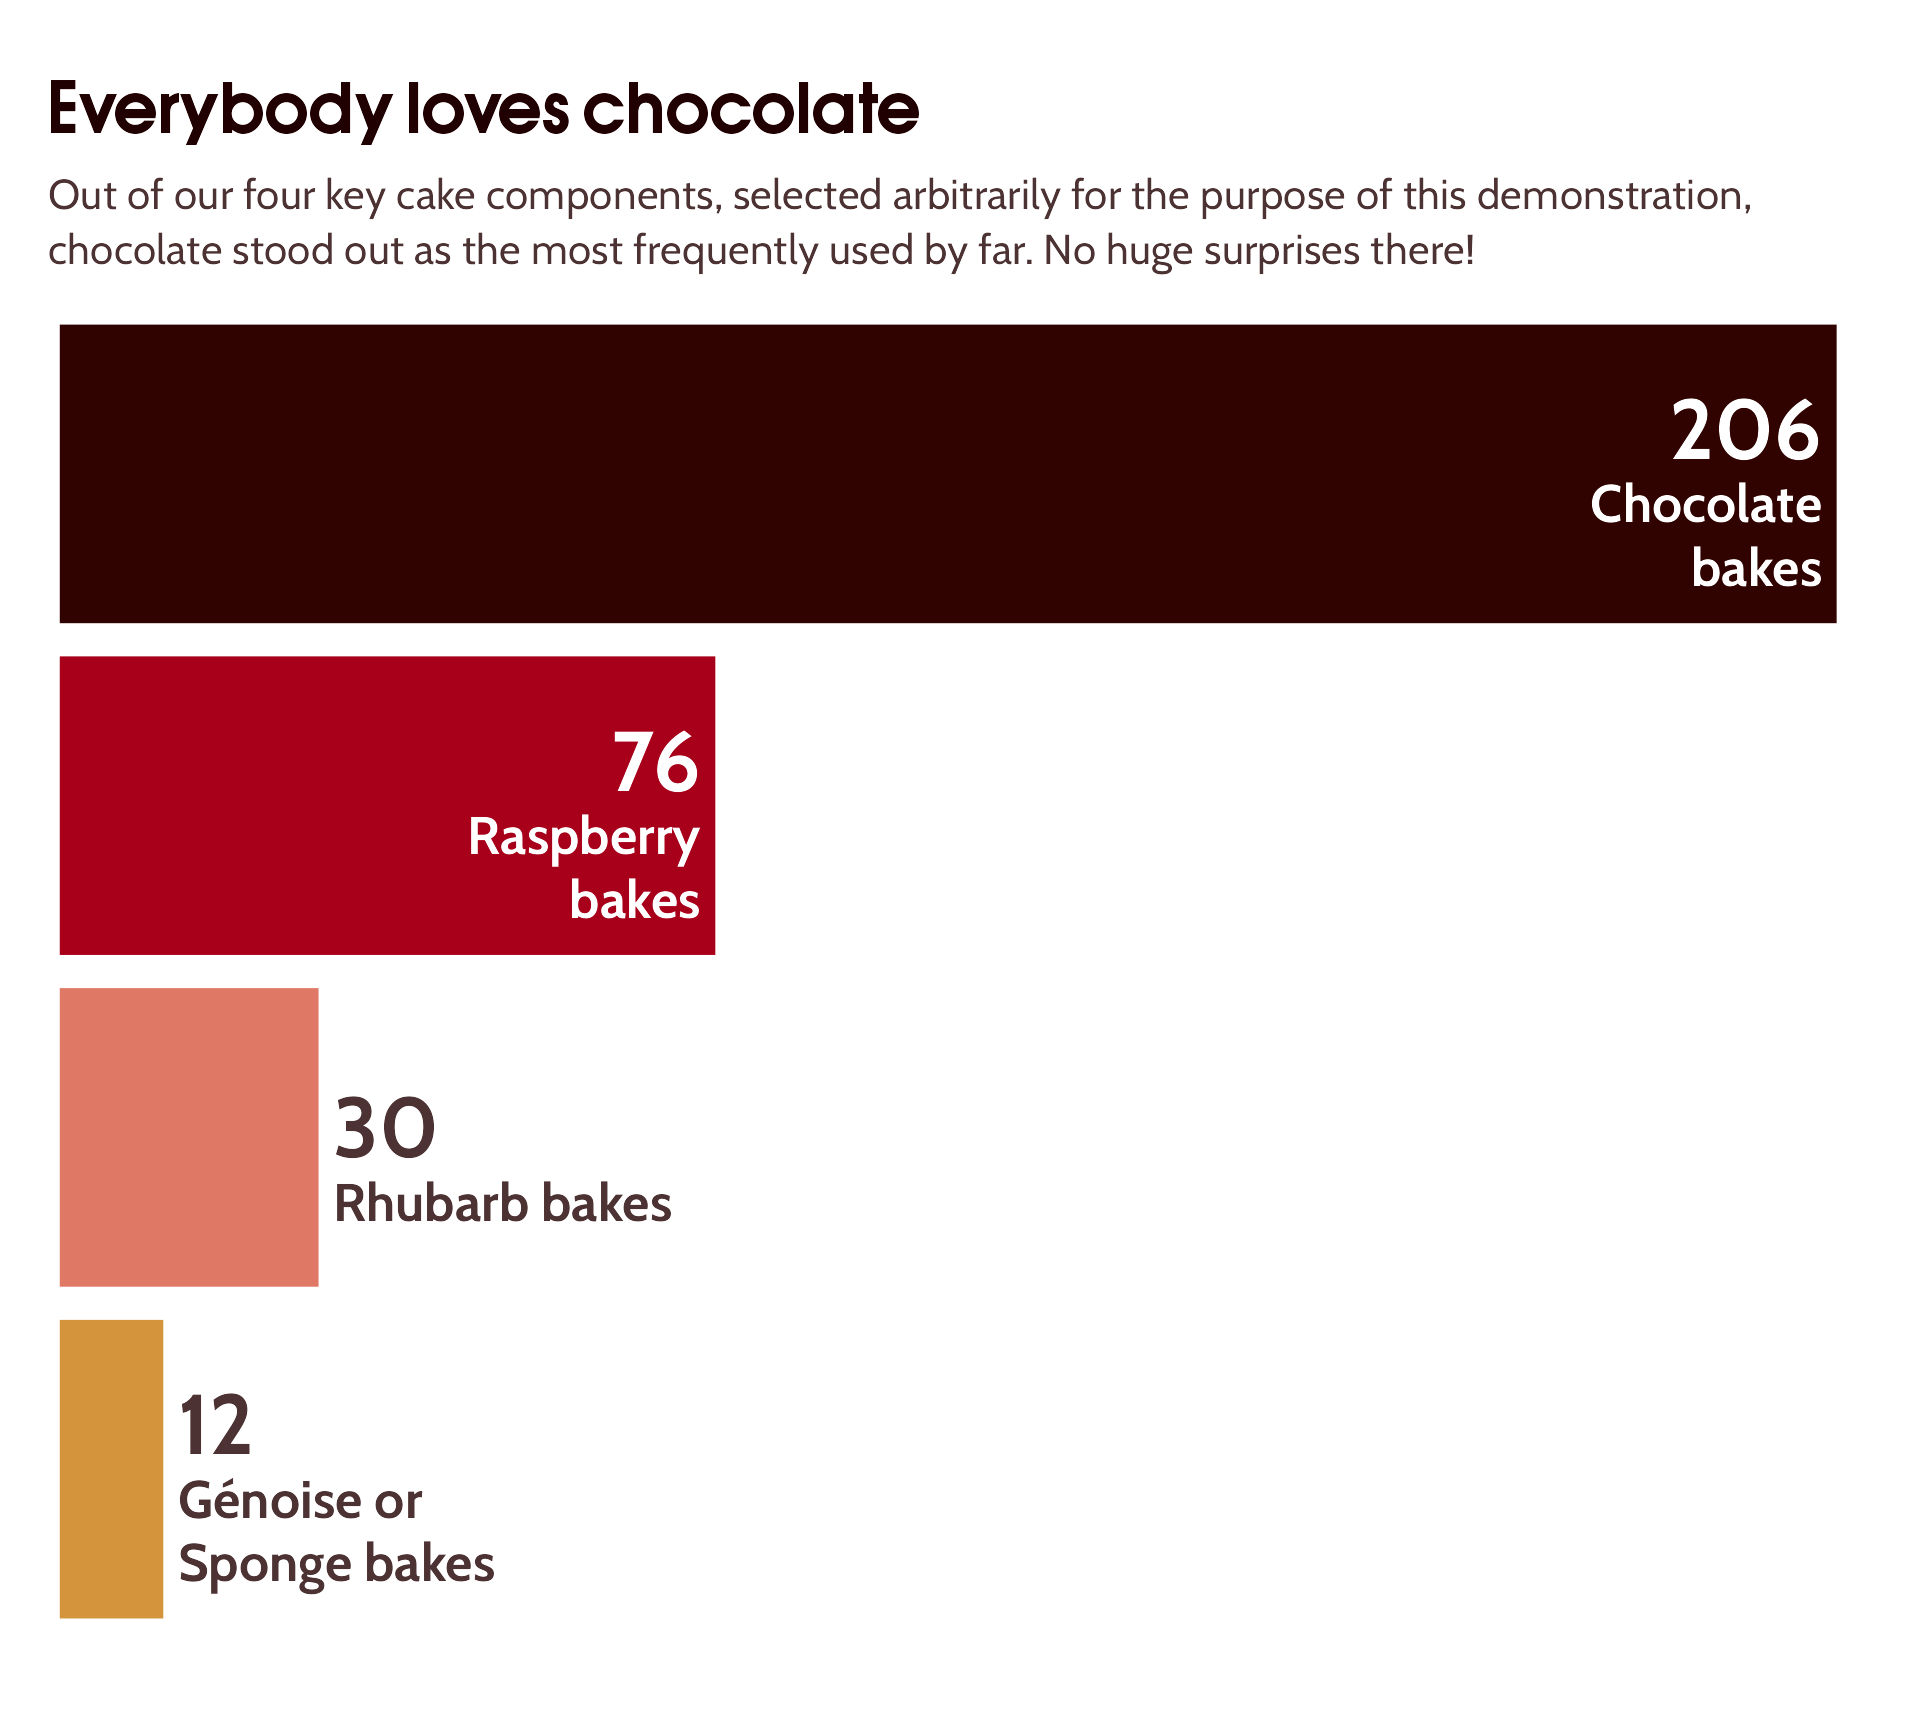
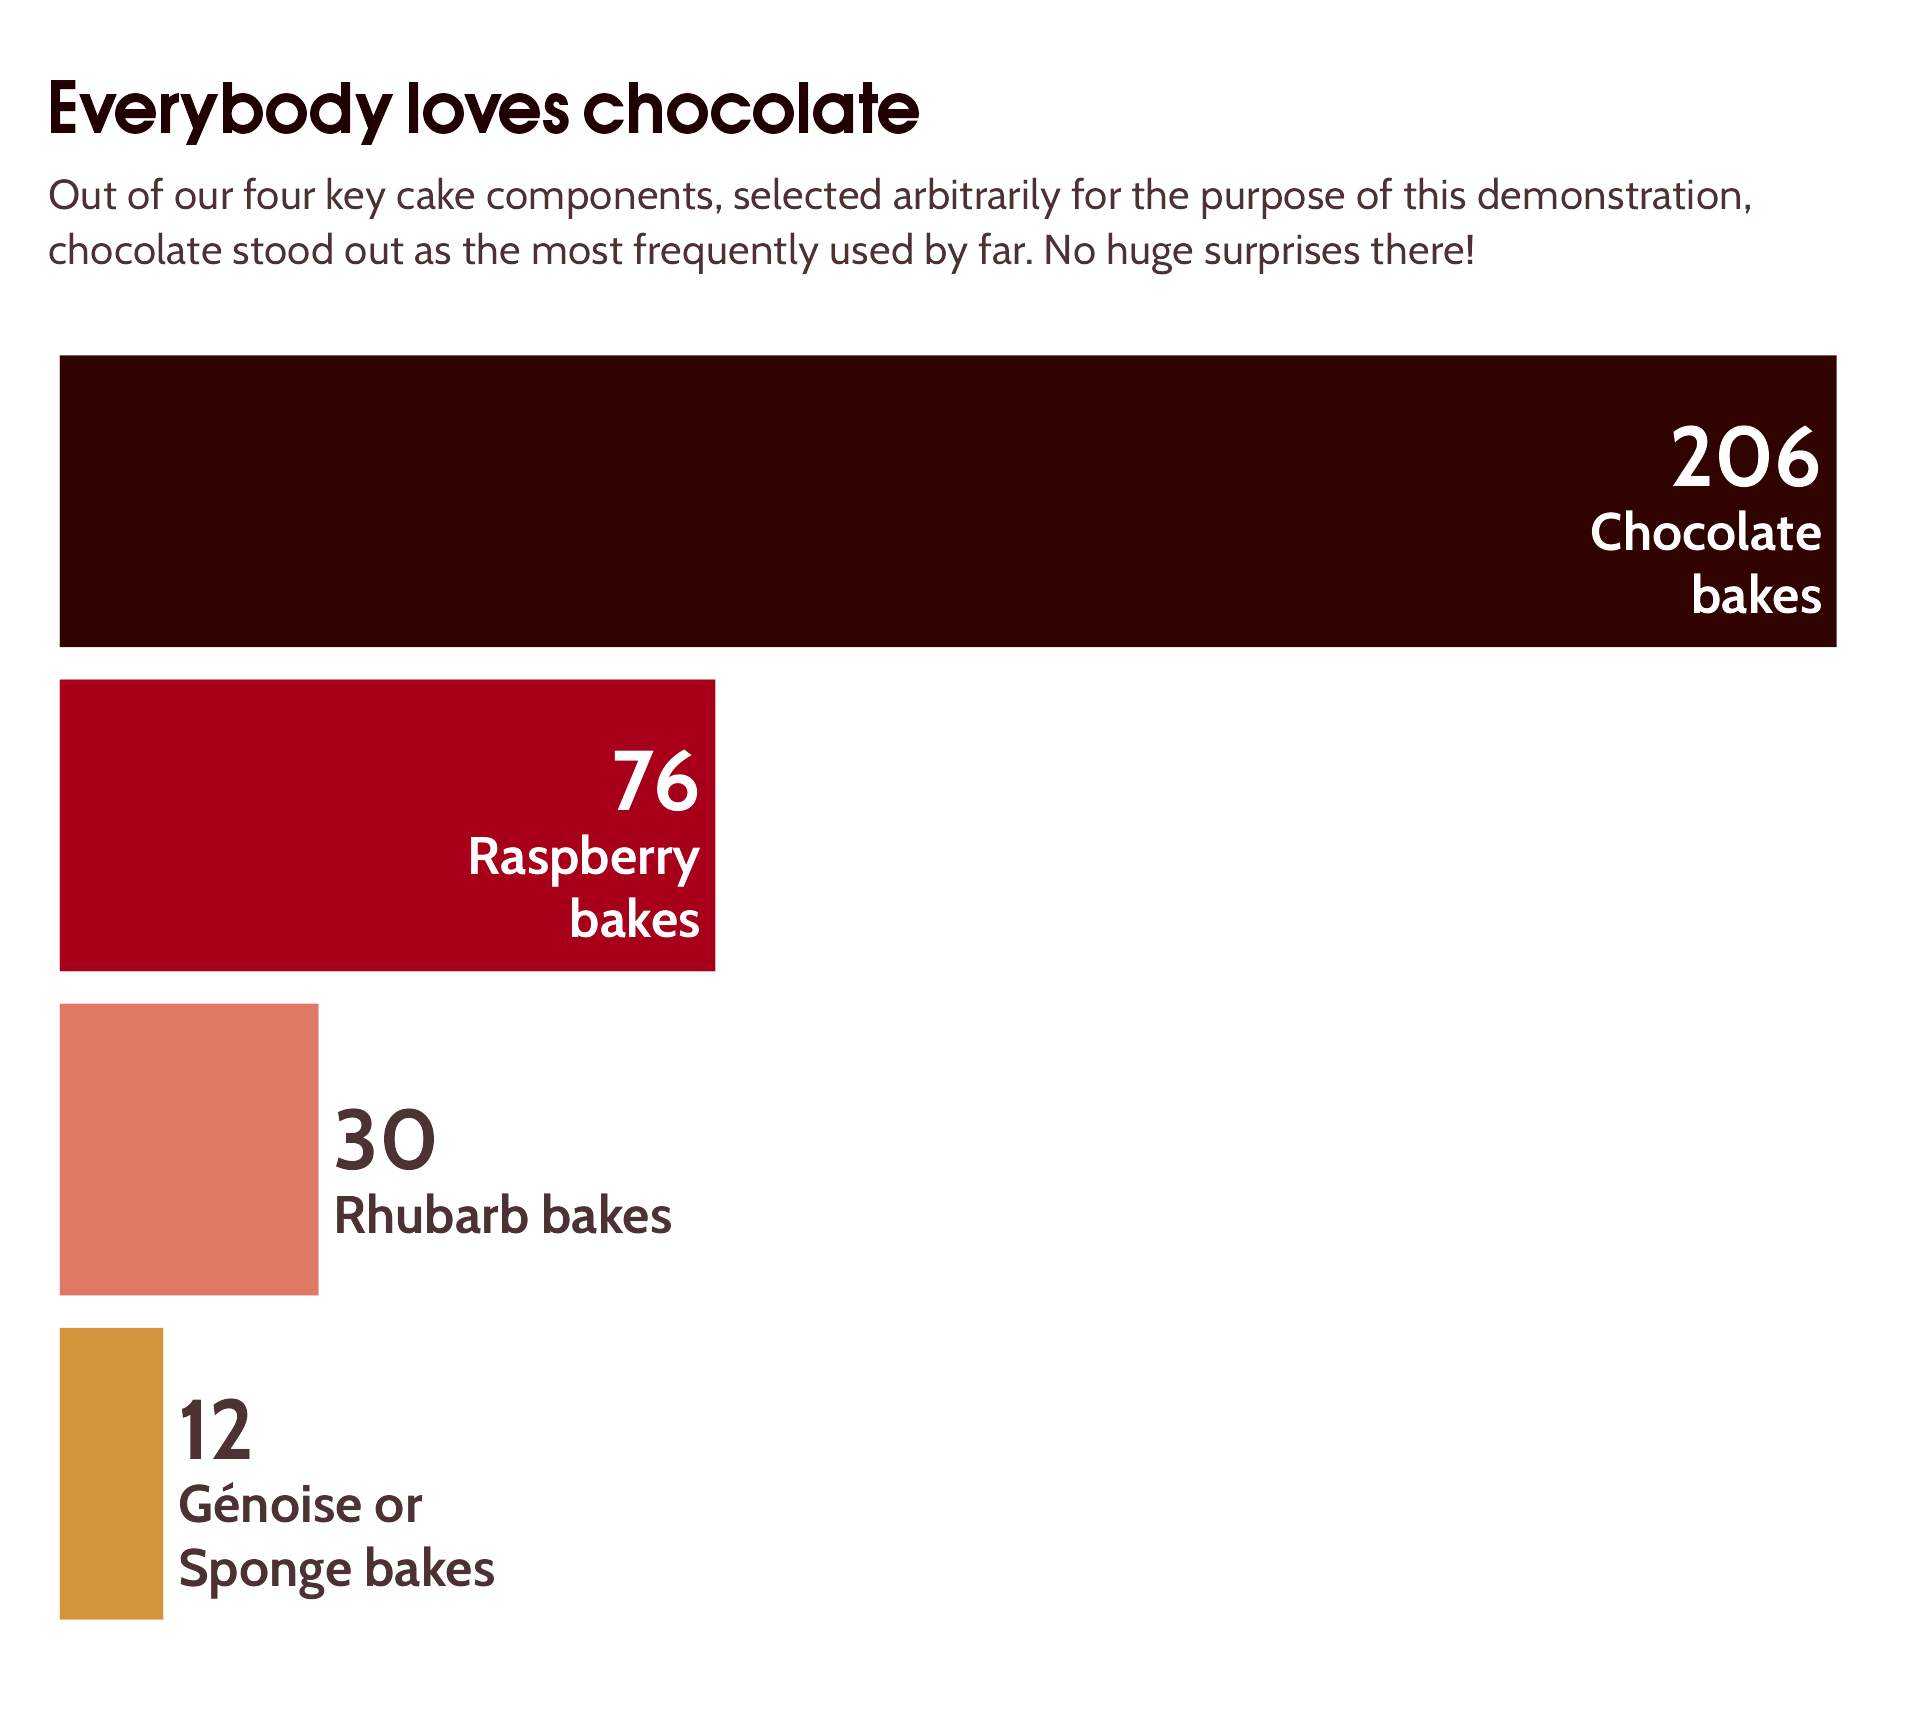
labs(title = "Everybody loves chocolate",
subtitle = "Out of our four key cake components, selected arbitrarily for the purpose of this demonstration, chocolate stood out as the most frequently used by far. No huge surprises there!") +
theme_minimal() 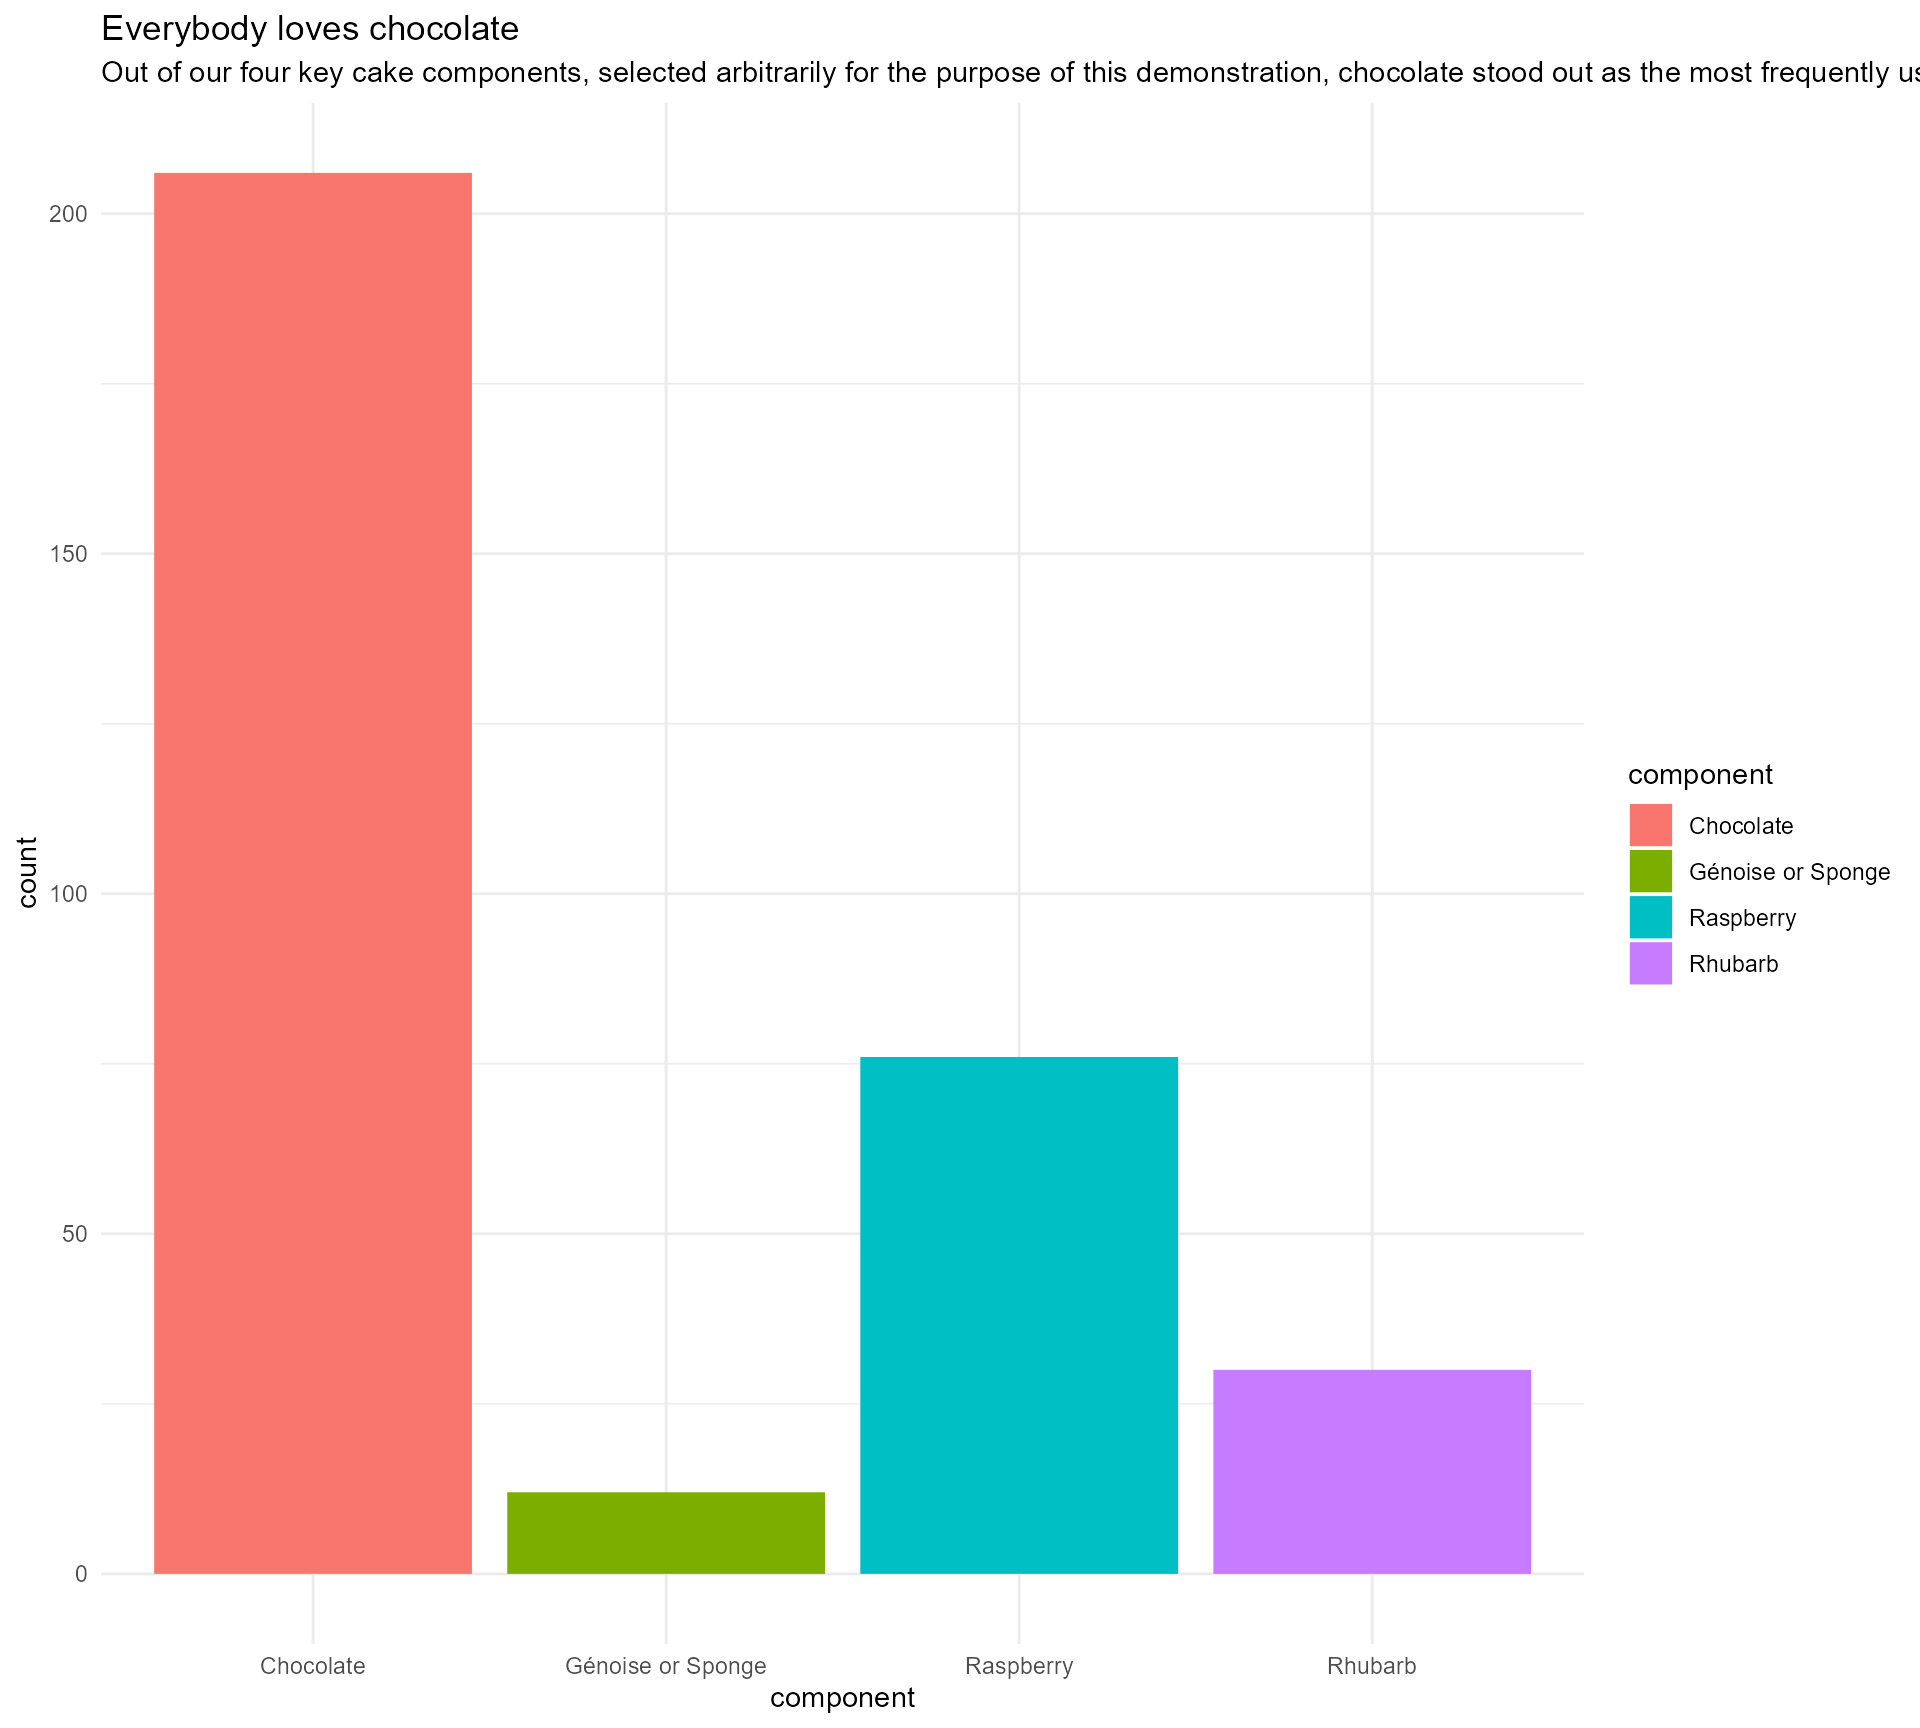
Our starting point
Let’s add a bit of text…
key_components %>%
ggplot(aes(x = component,
y = count,
fill = component)) +
geom_bar(stat = "identity") +
labs(title = "Everybody loves chocolate",
subtitle = "Out of our four key cake components, selected arbitrarily for the purpose of this demonstration, chocolate stood out as the most frequently used by far. No huge surprises there!") +
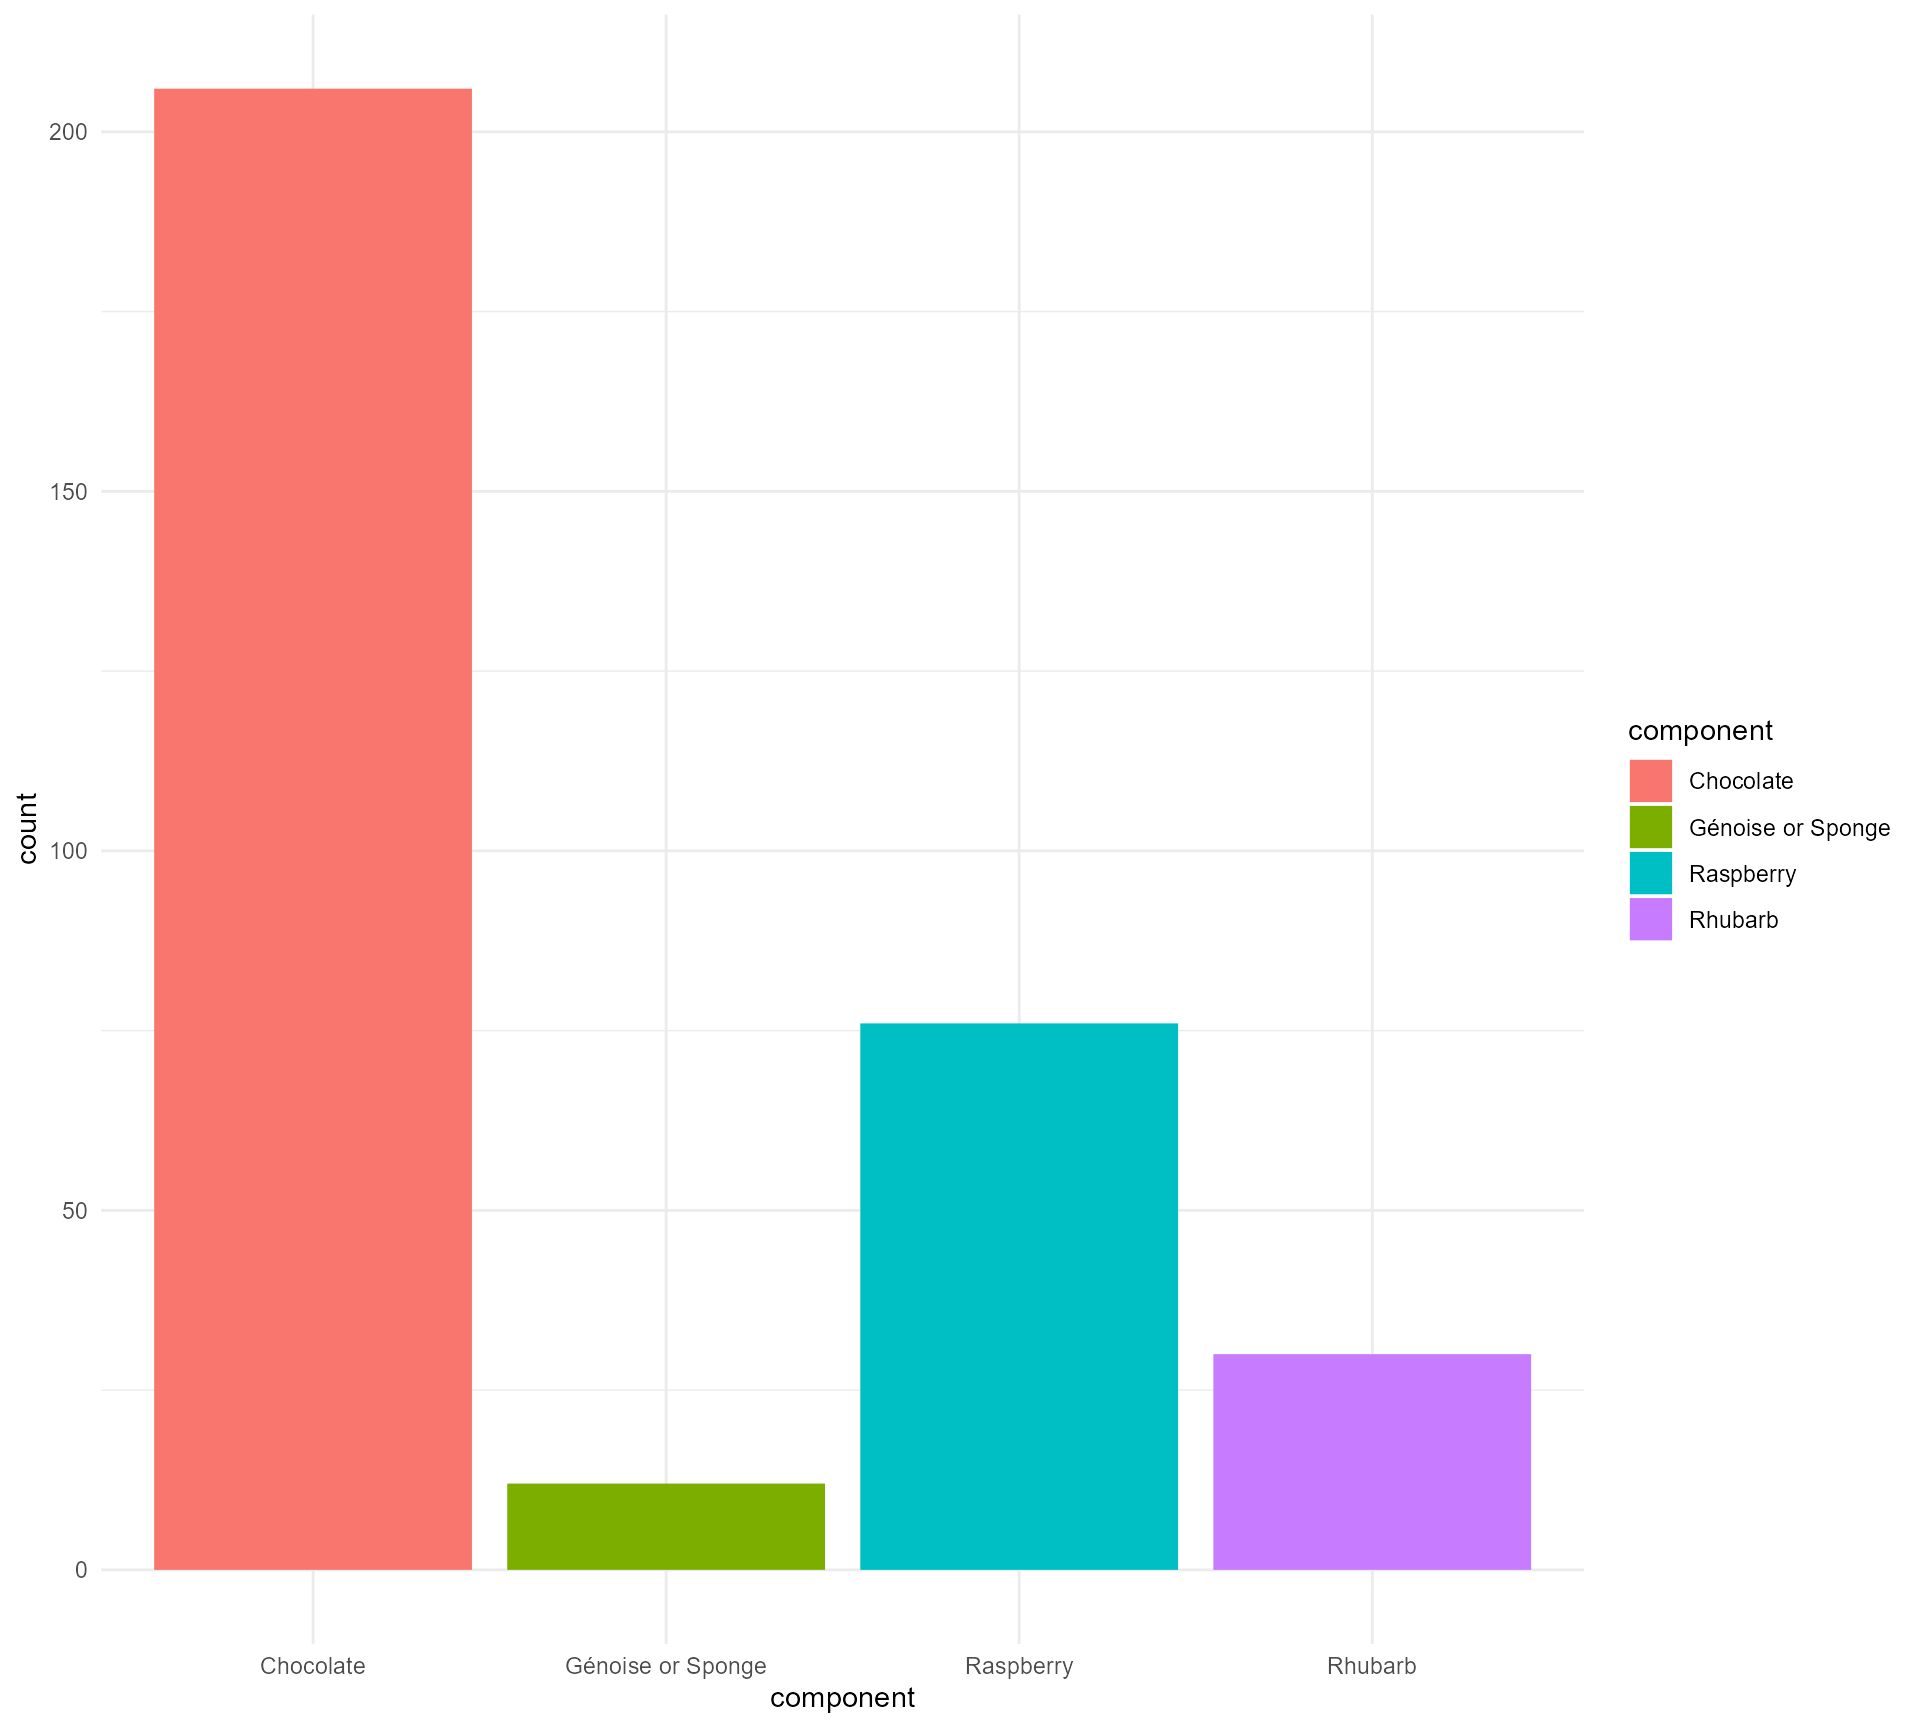
theme_minimal(base_size = 18) 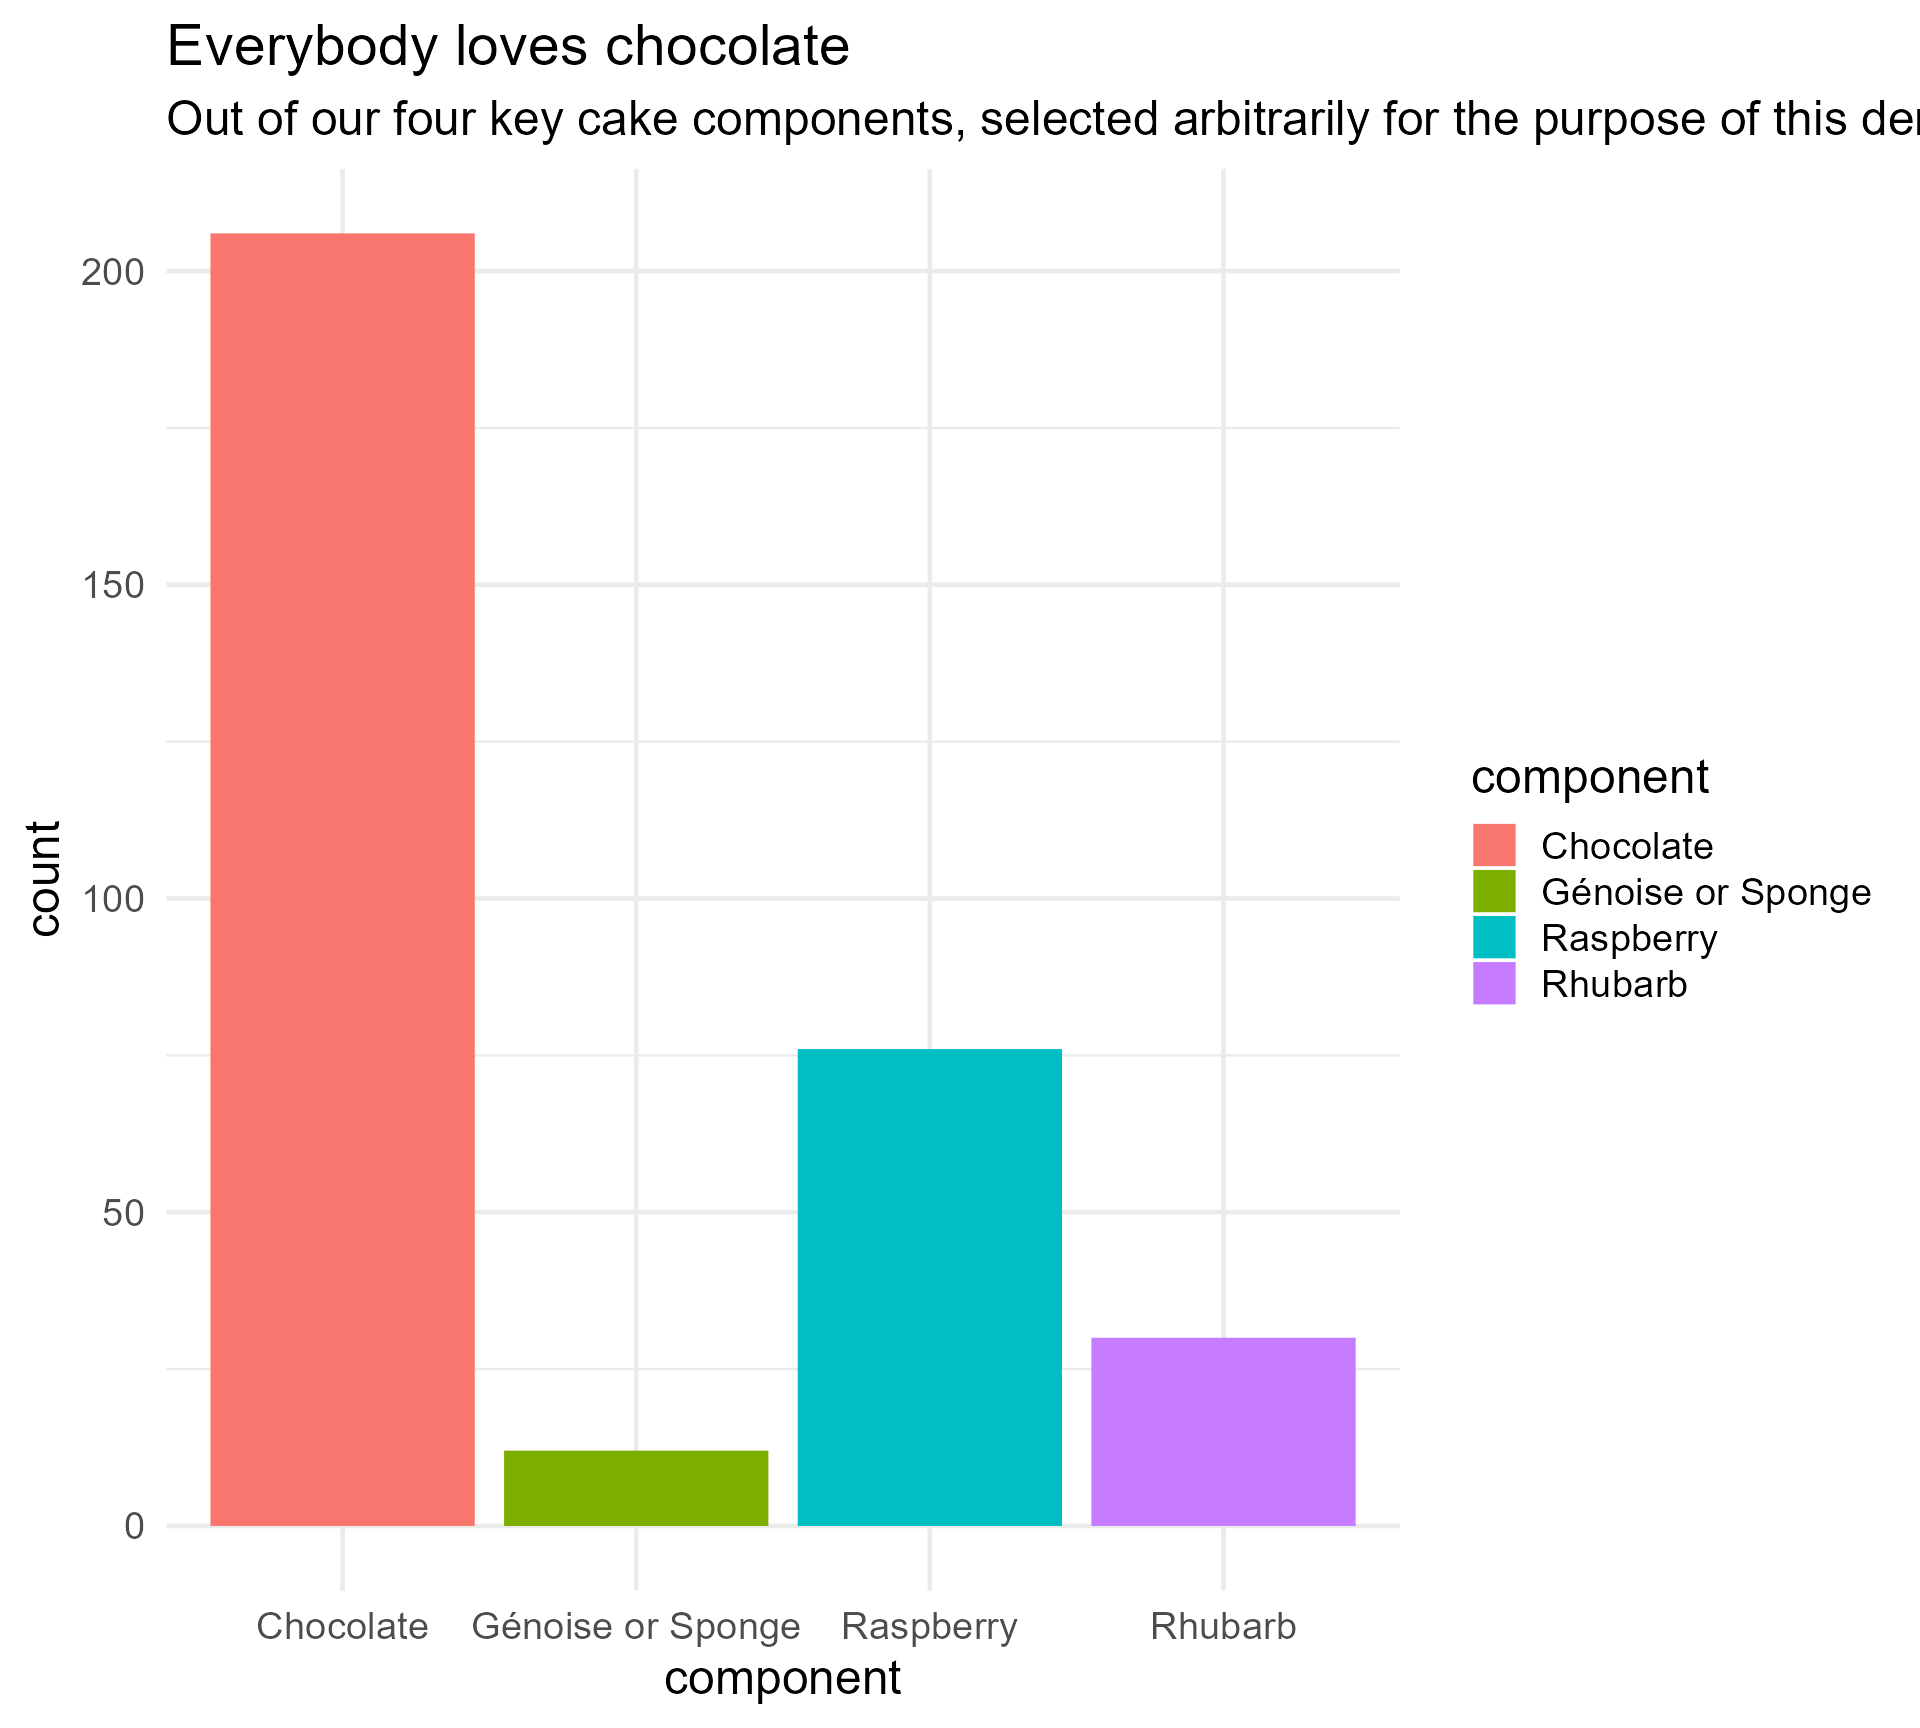
Our starting point
Mini tip! Get the bars in order
key_components %>%
arrange(count) %>%
mutate(component = factor(component,
levels = component)) %>%
ggplot(aes(x = component,
y = count,
fill = component,
colour = component)) +
geom_bar(stat = "identity") +
labs(title = "Everybody loves chocolate",
subtitle = "Out of our four key cake components, selected arbitrarily for the purpose of this demonstration, chocolate stood out as the most frequently used by far. No huge surprises there!") +
theme_minimal(base_size = 18) 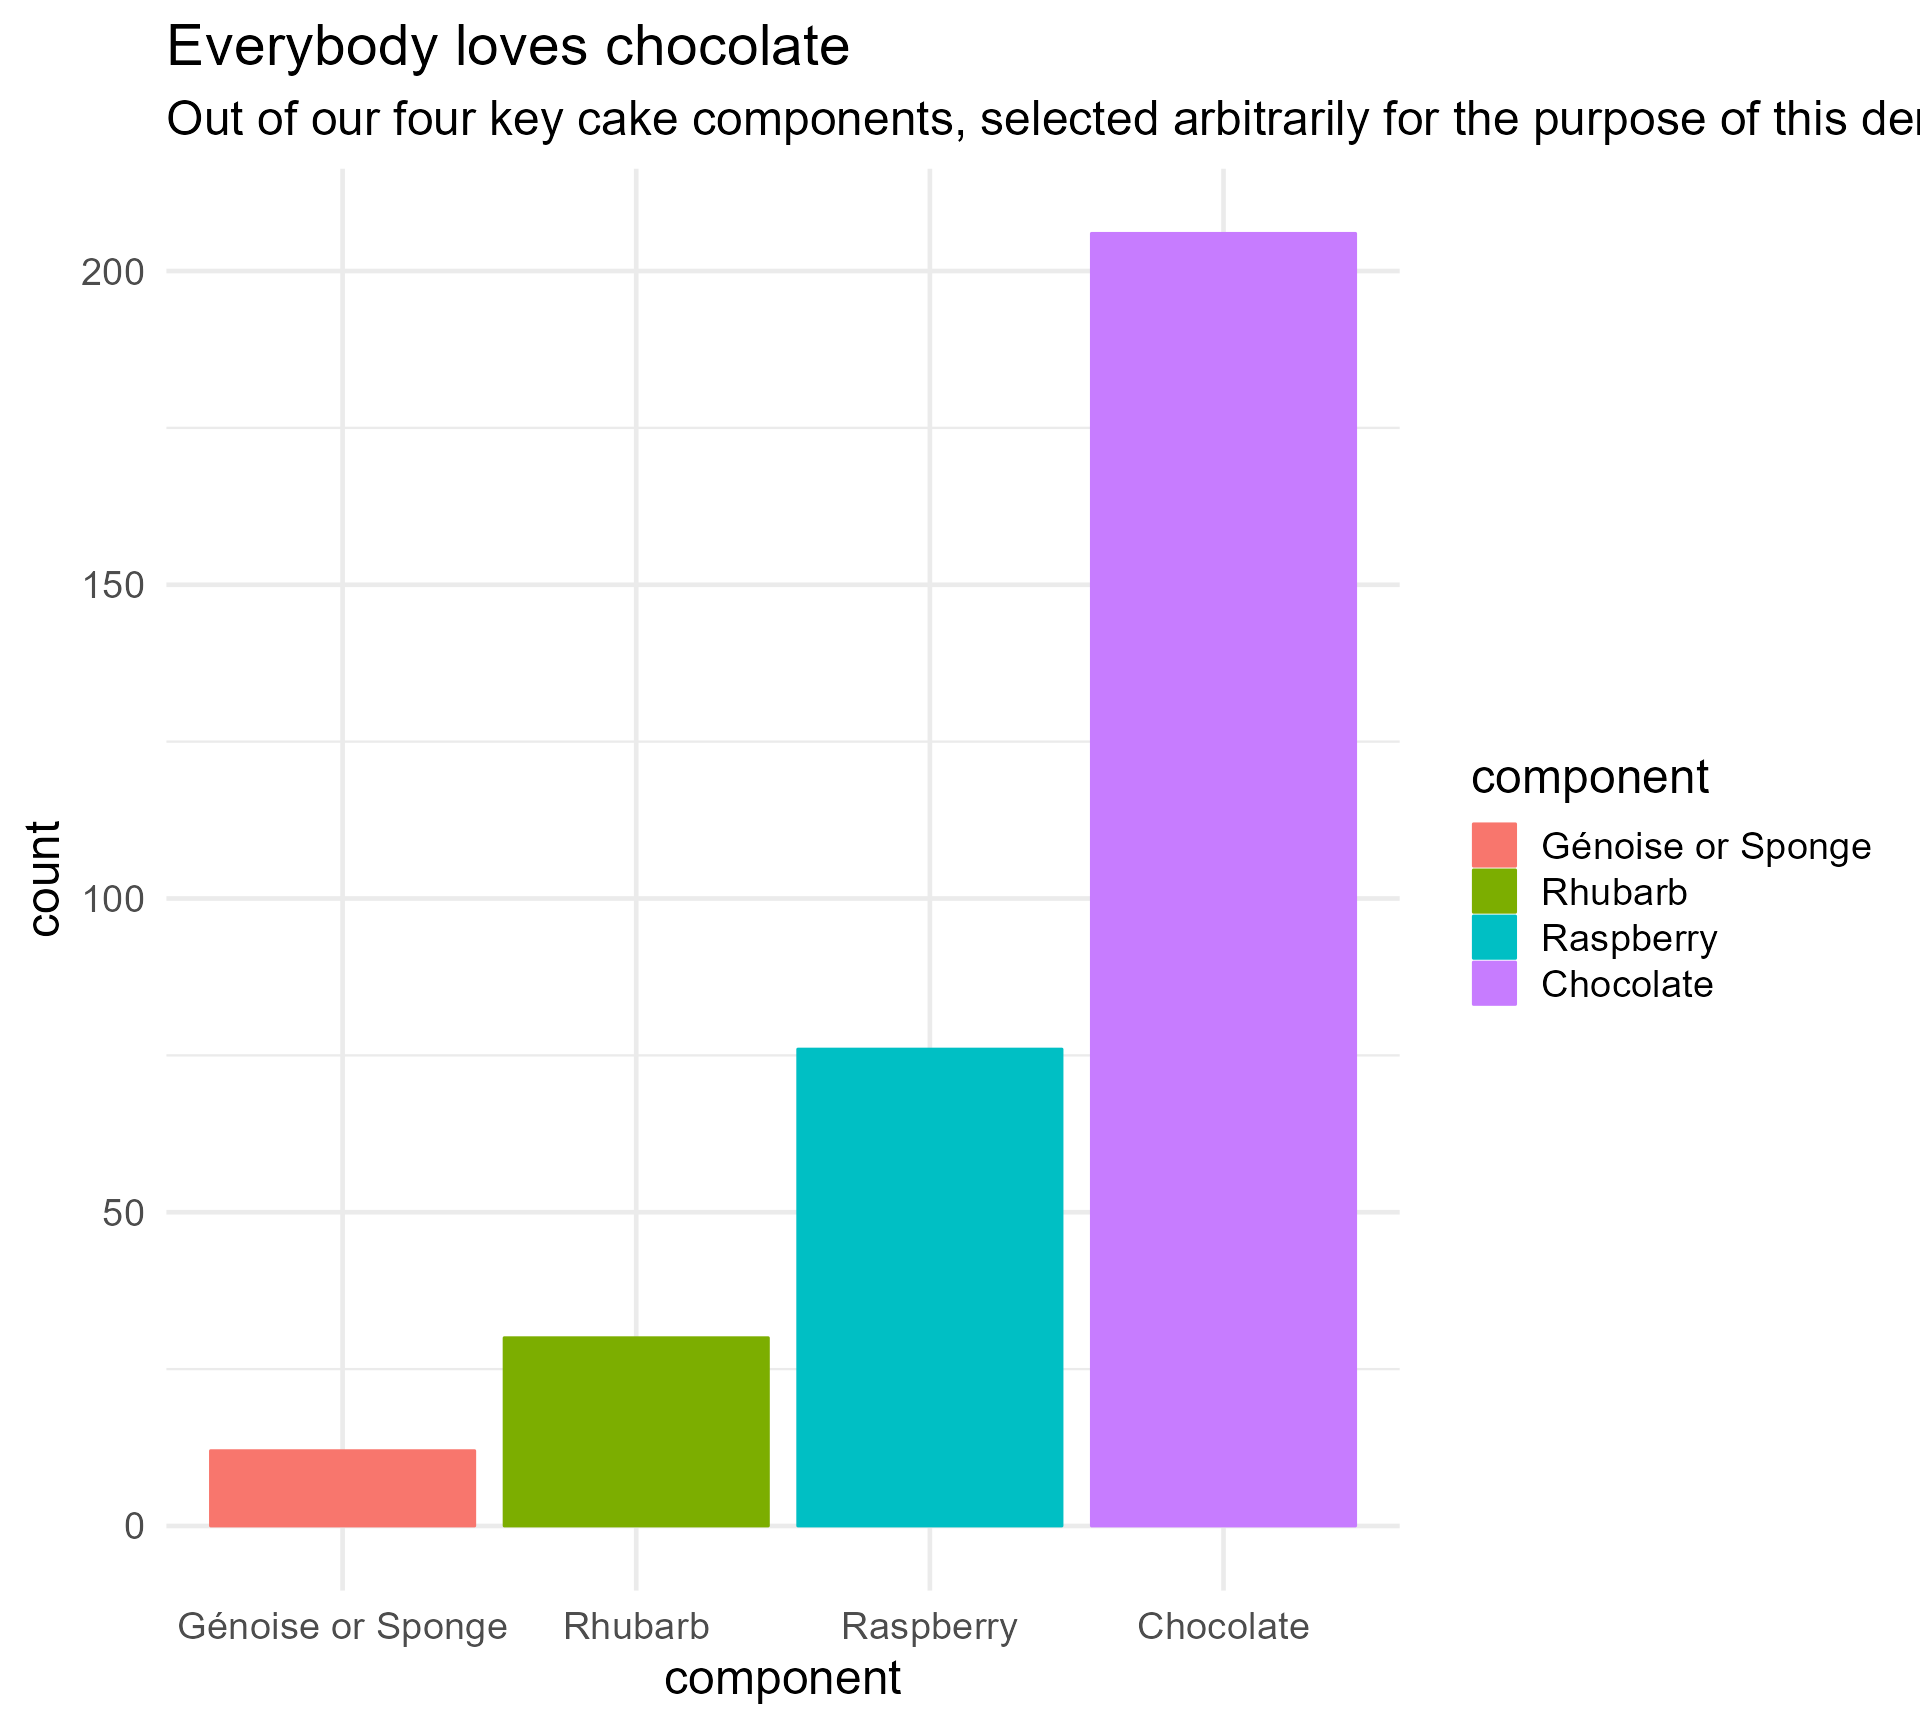
Our starting point
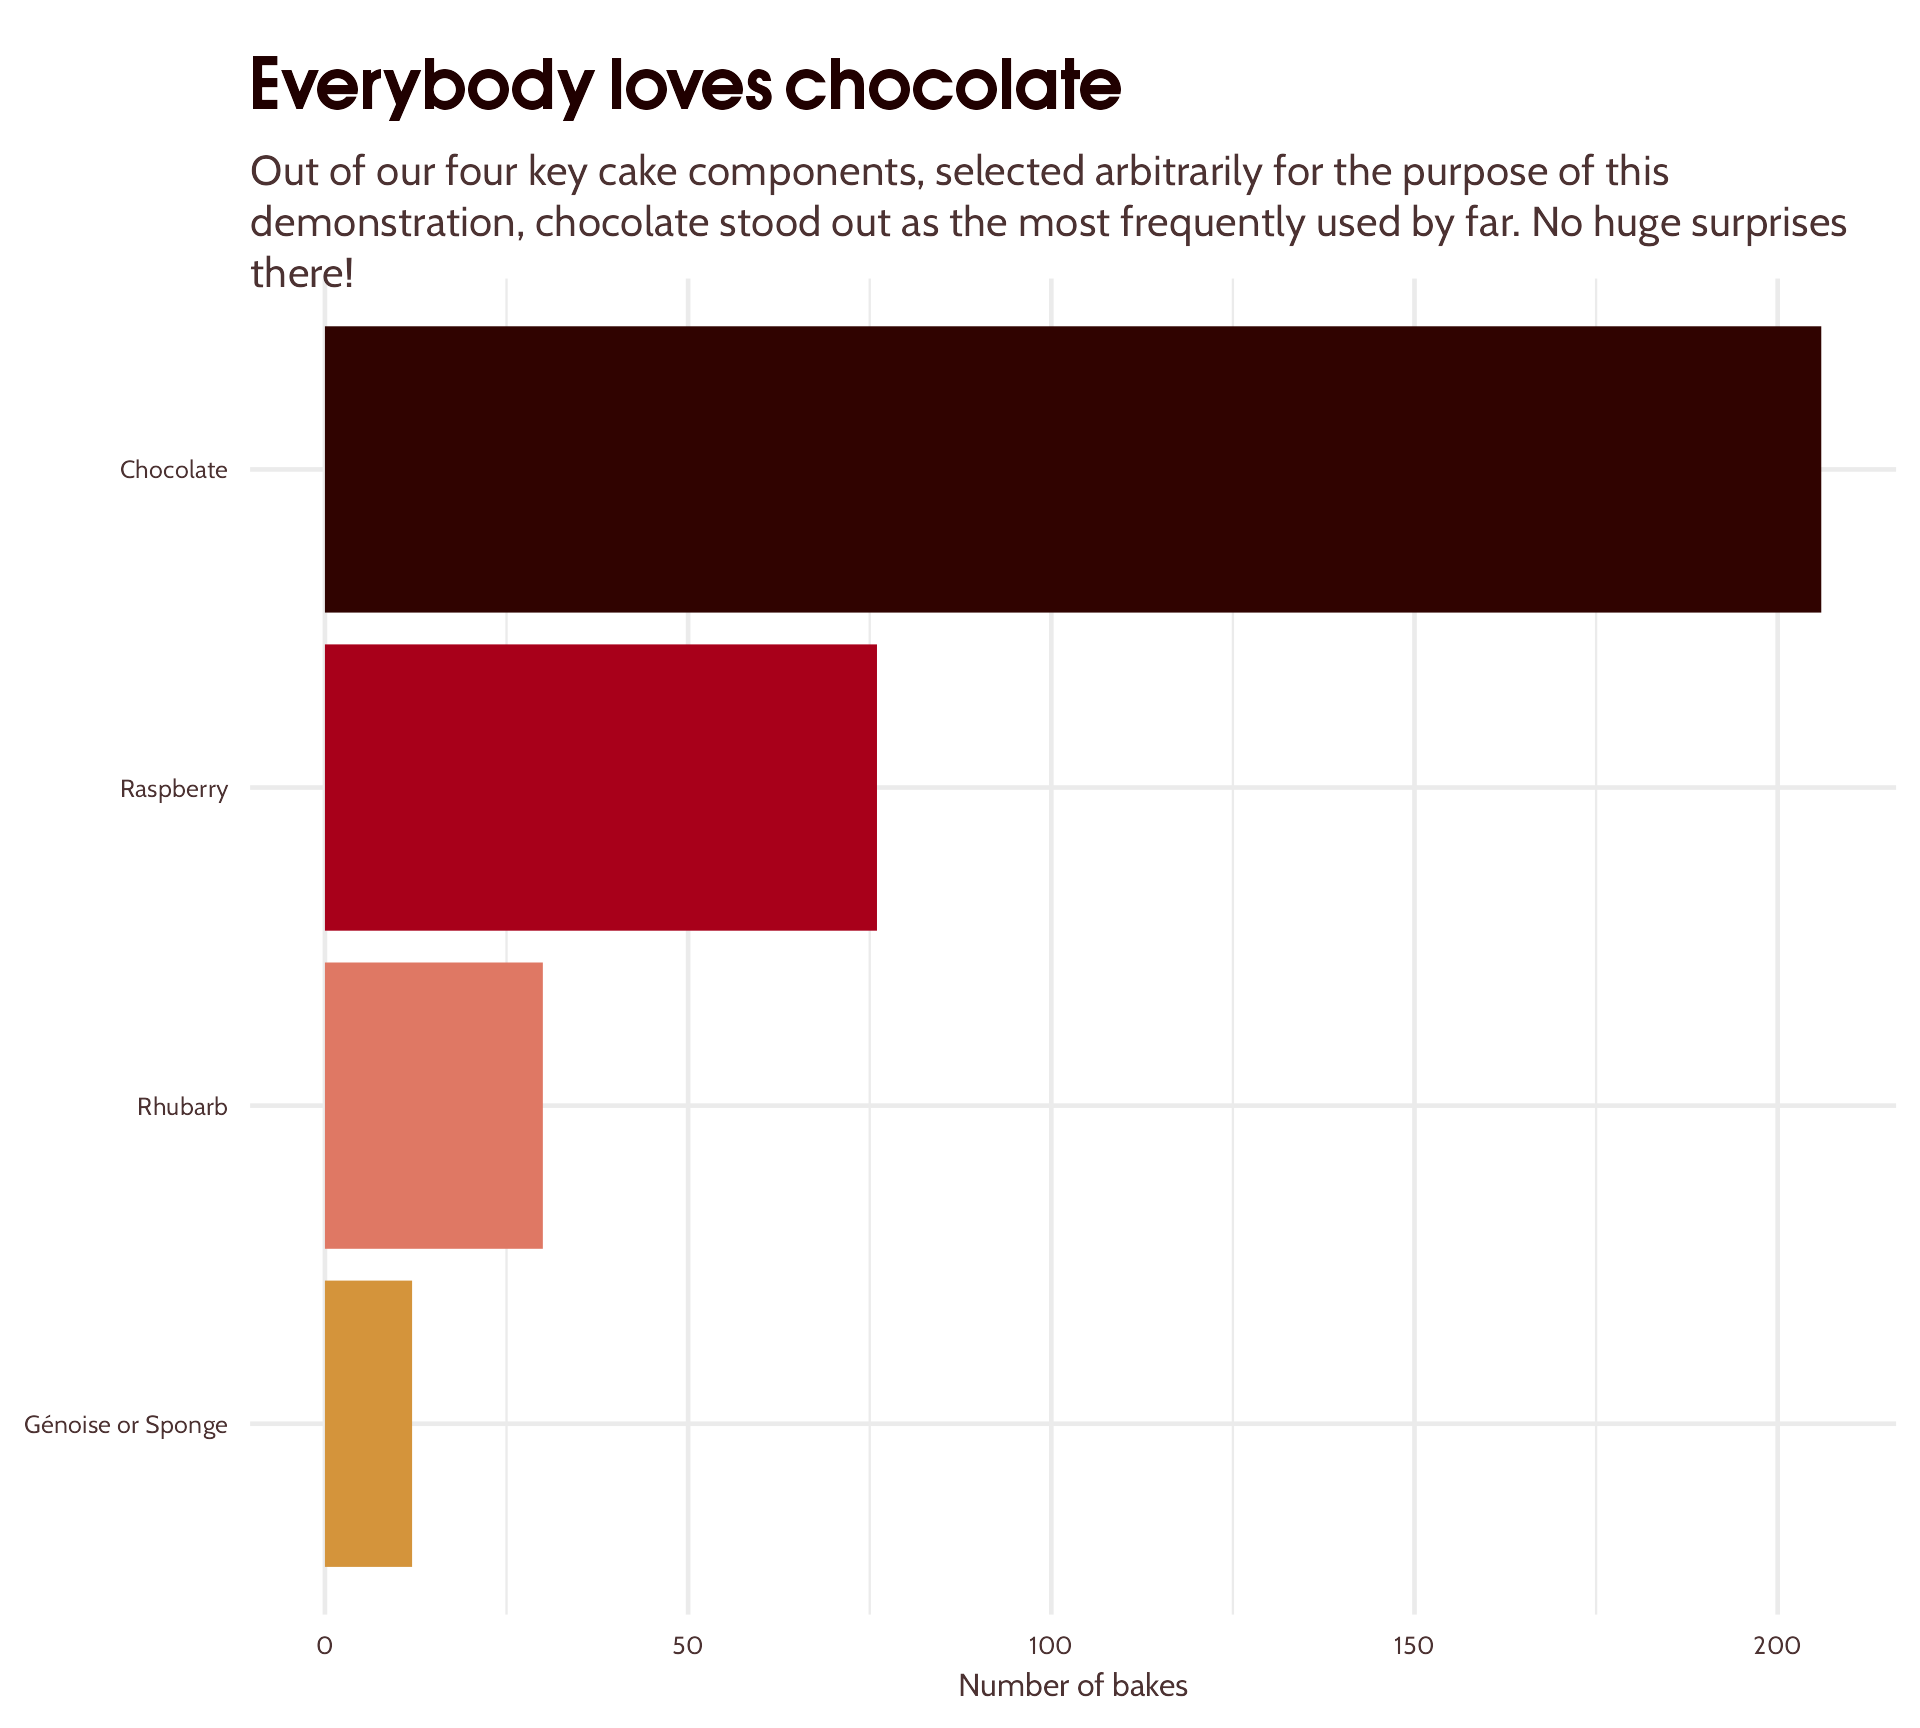
Mini tip! Avoid giving everyone a sore neck
key_components %>%
arrange(count) %>%
mutate(component = factor(component,
levels = component)) %>%
ggplot(aes(x = component,
y = count,
fill = component,
colour = component)) +
geom_bar(stat = "identity") +
labs(title = "Everybody loves chocolate",
subtitle = "Out of our four key cake components, selected arbitrarily for the purpose of this demonstration, chocolate stood out as the most frequently used by far. No huge surprises there!") +
theme_minimal(base_size = 18) +
coord_flip()
Our starting point
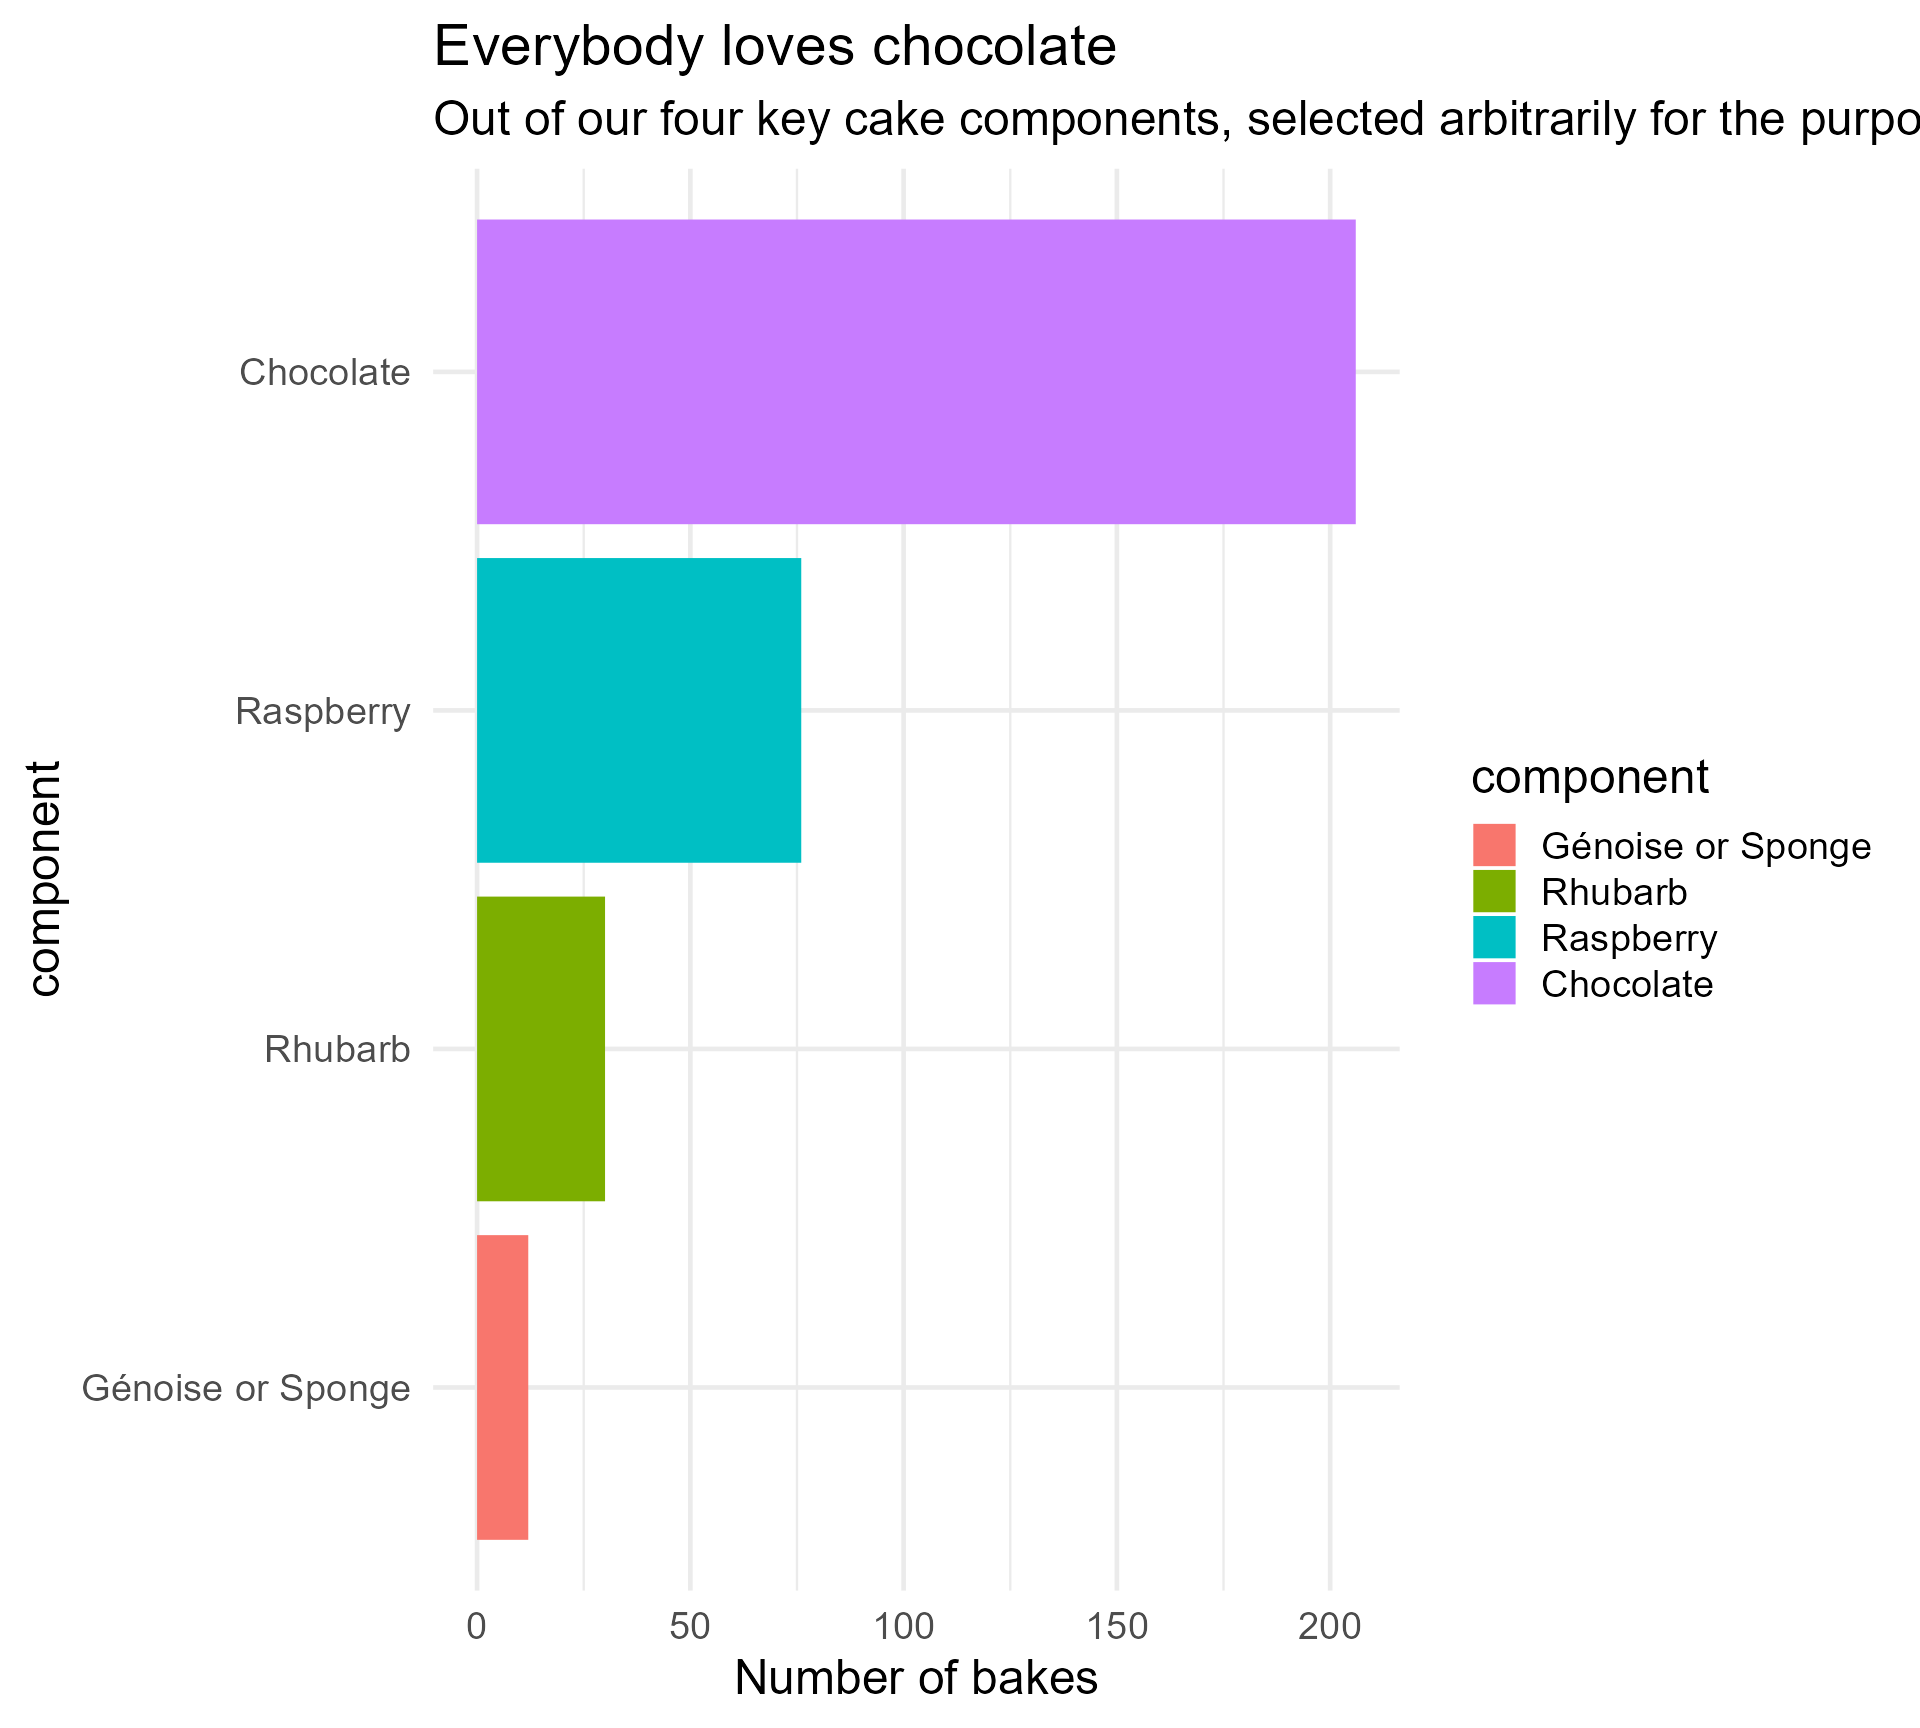
Mini tip! Use plain English
key_components %>%
arrange(count) %>%
mutate(component = factor(component,
levels = component)) %>%
ggplot(aes(x = component,
y = count,
fill = component,
colour = component)) +
geom_bar(stat = "identity") +
labs(title = "Everybody loves chocolate",
subtitle = "Out of our four key cake components, selected arbitrarily for the purpose of this demonstration, chocolate stood out as the most frequently used by far. No huge surprises there!",
y = "Number of bakes") +
theme_minimal(base_size = 18) +
coord_flip()
Our starting point
Perfectly functional - but…

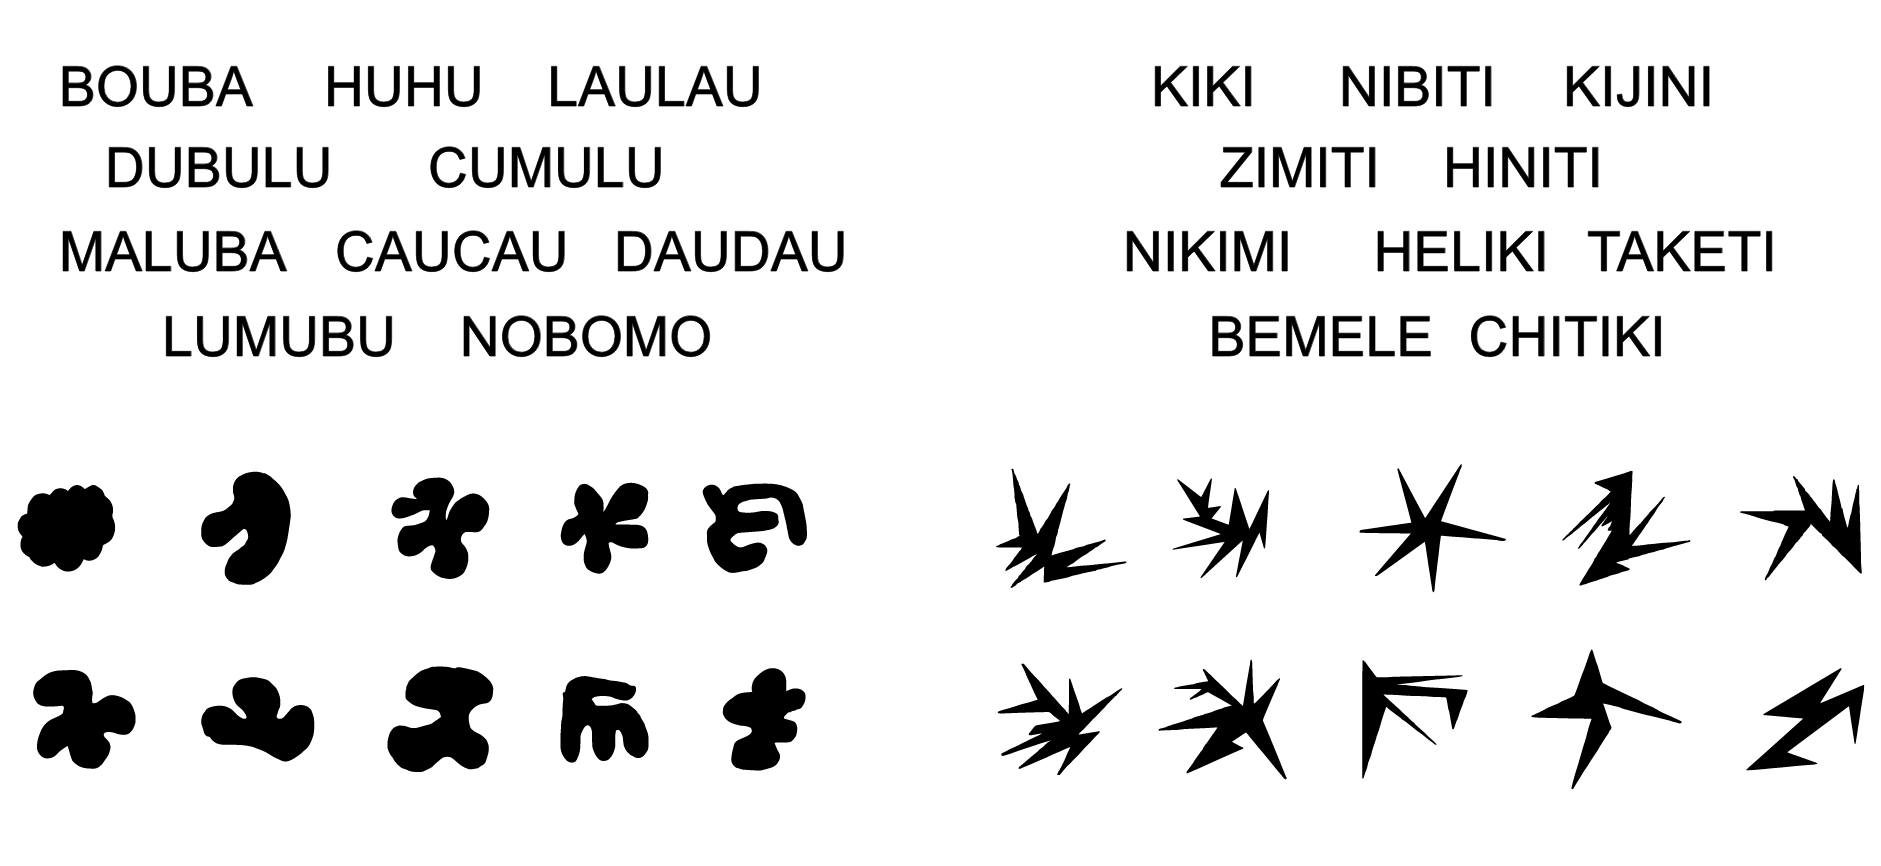
#1 Decrease reliance on text

#1 Decrease reliance on text
Predicted by sound properties - Passi & Arun, 2022
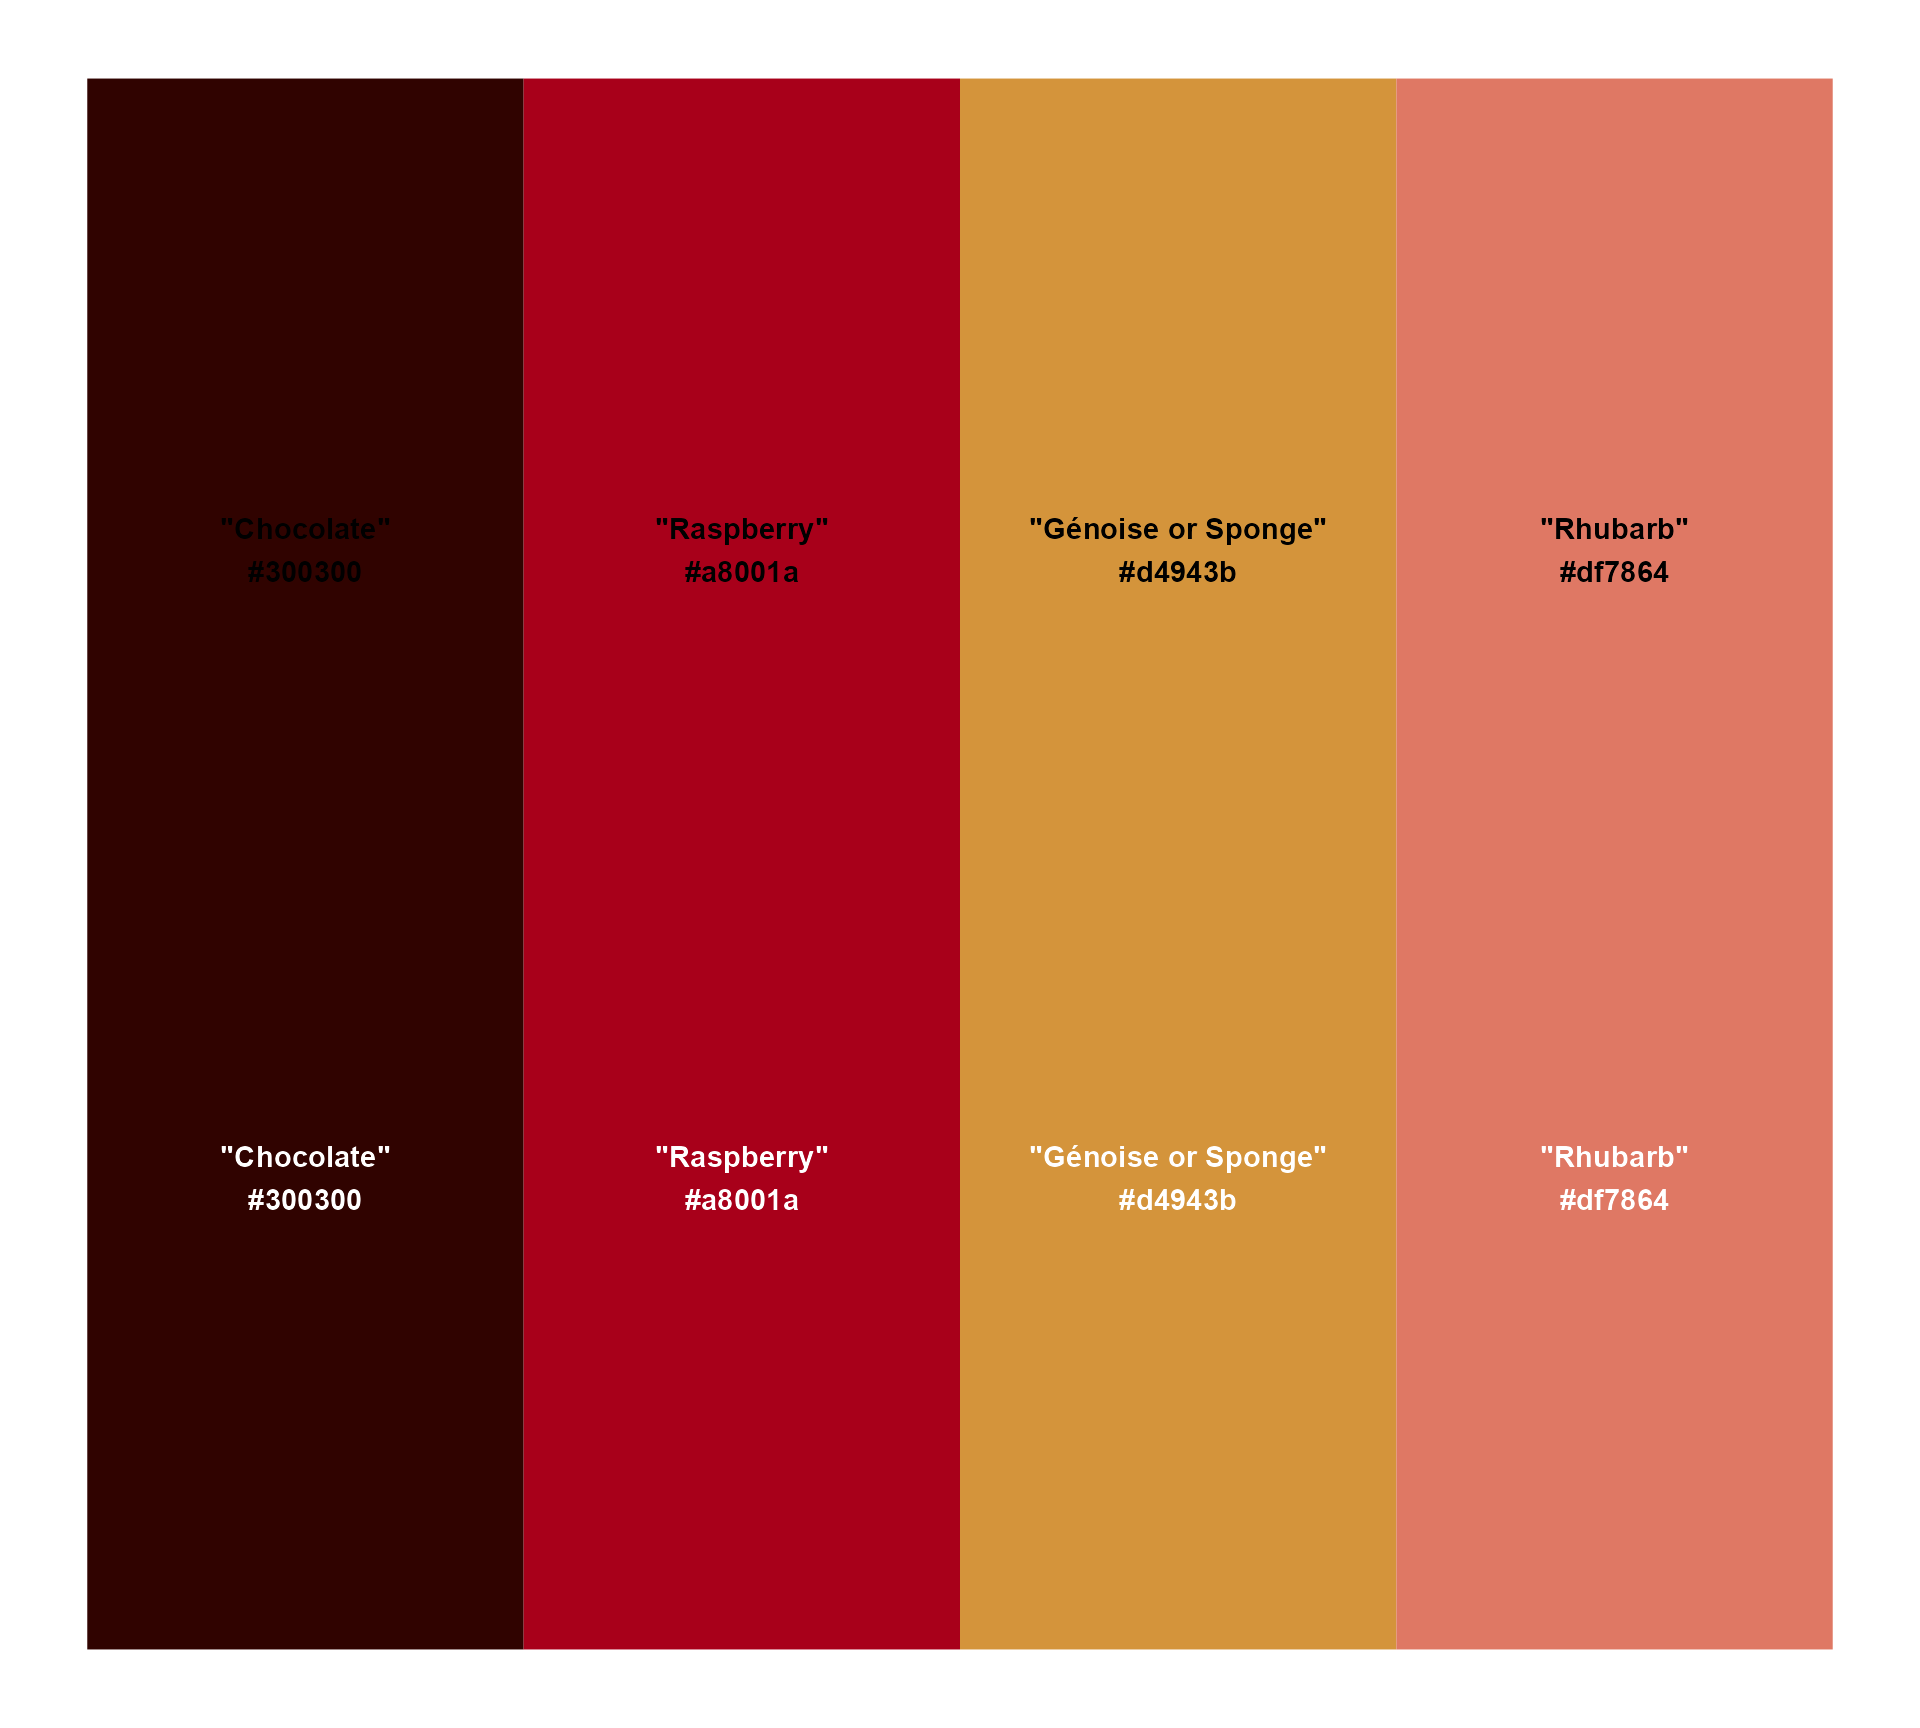
#1 Decrease reliance on text
A mouth-watering palette!
#1 Decrease reliance on text

#1 Decrease reliance on text
#1 Decrease reliance on text
#1 Decrease reliance on text

#1 Decrease reliance on text


#2 Add text hierarchy
#2 Add text hierarchy
Where we were…

#2 Add text hierarchy
Use text colour based on “anchor” colour

#2 Add text hierarchy
Override theme_minimal()’s axis text colour
#2 Add text hierarchy
Use text colour(s) based on “anchor” colour

#2 Add text hierarchy
Increase difference between title and subtitle

#2 Add text hierarchy
Add some personality!
basic_bar_plot +
scale_fill_manual(values = component_colours) +
theme(text = element_text(family = "Cabin",
colour = "#4C3232"),
legend.position = "none",
axis.title.y = element_blank(),
plot.subtitle = element_text(size = 16),
plot.title = element_text(family = "OPTIAuvantGothic-DemiBold",
size = 24,
face = "bold",
colour = "#200000"),
axis.text = element_text(colour = "#4C3232"))
#2 - Add text hierarchy
Getting fonts to work can be frustrating!
Install fonts locally, restart R Studio + 📦
{systemfonts}({ragg}+{textshaping}) + Set graphics device to “AGG” + 🤞
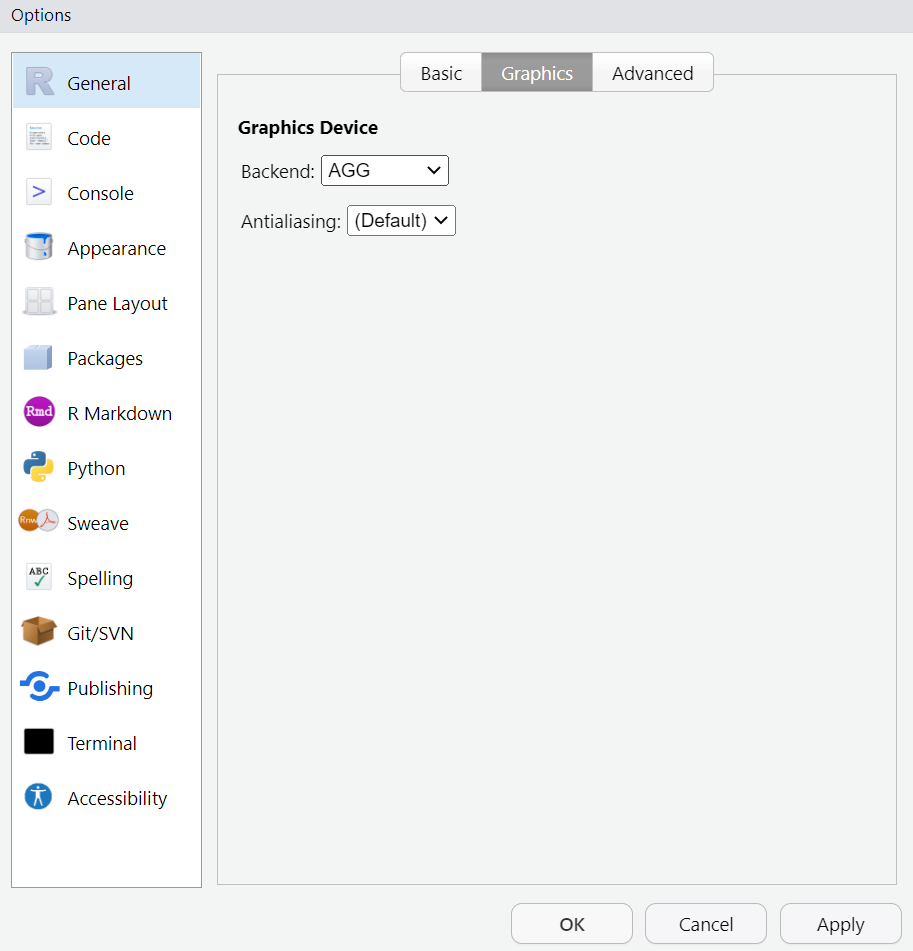
knitr::opts_chunk$set(dev = “ragg_png”)
#2 Add text hierarchy
I ❤️ {ggtext}
basic_bar_plot +
scale_fill_manual(values = component_colours) +
theme(text = element_text(family = "Cabin",
colour = "#4C3232"),
legend.position = "none",
axis.title.y = element_blank(),
plot.subtitle = ggtext::element_textbox_simple(size = 16),
plot.title = element_text(family = "OPTIAuvantGothic-DemiBold",
size = 24,
face = "bold",
colour = "#200000"),
axis.text = element_text(colour = "#4C3232"))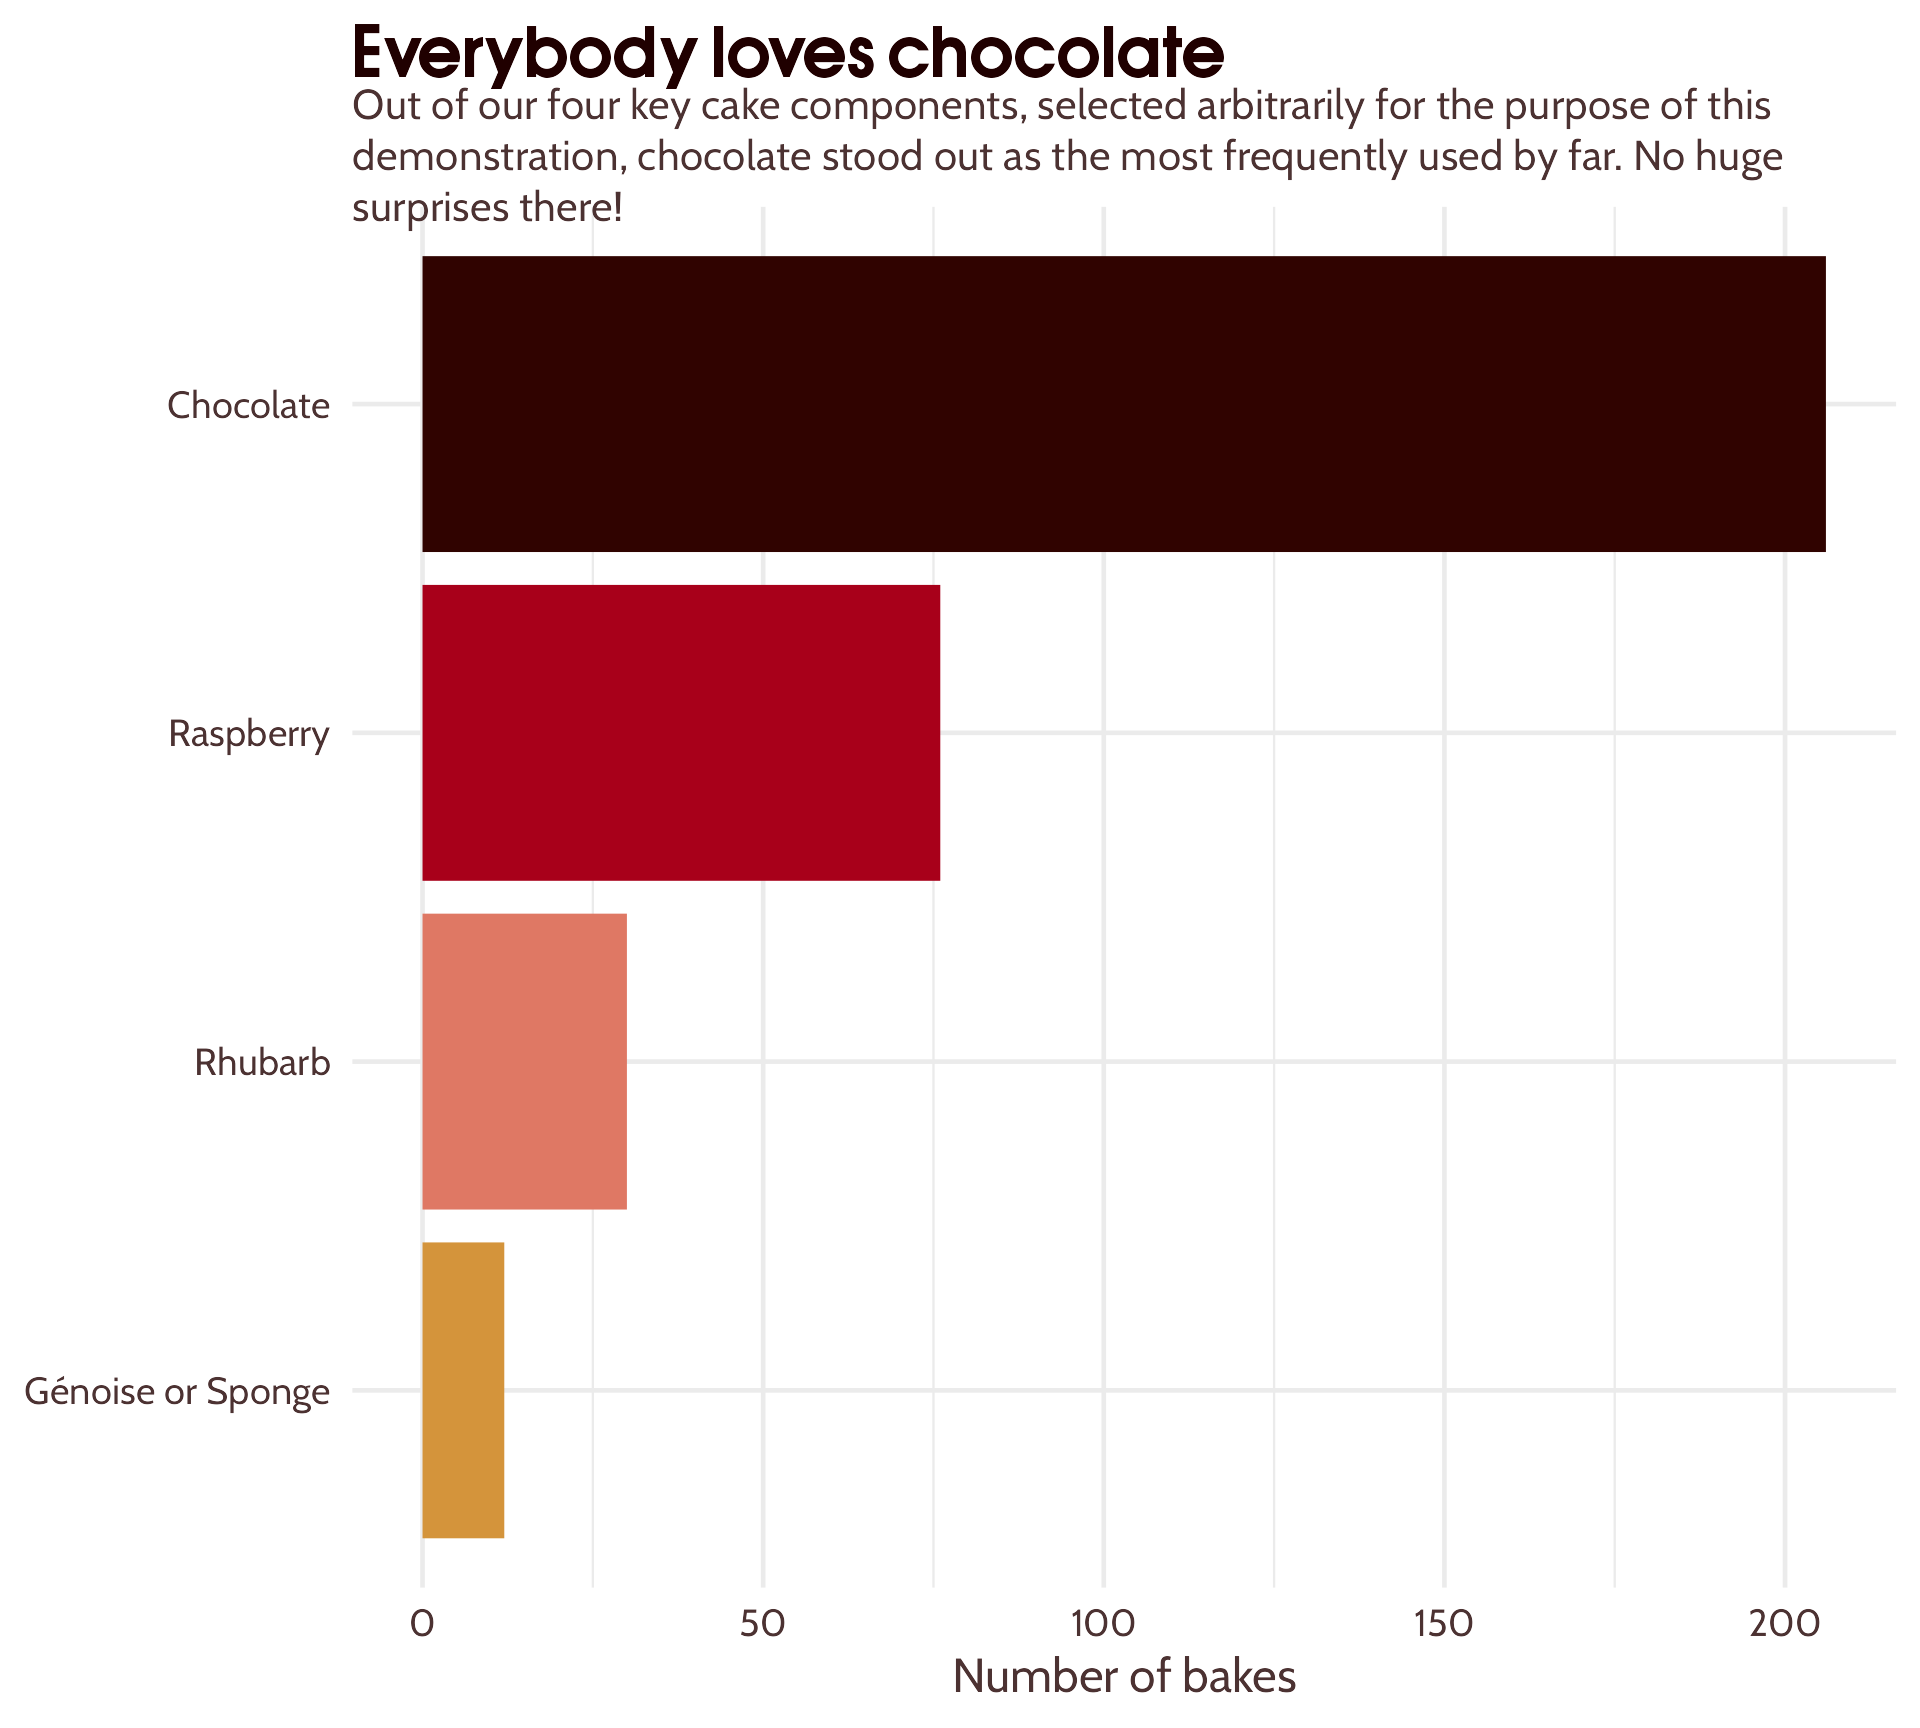
#2 Add text hierarchy
I ❤️ {ggtext} - but watch that alignment!
basic_bar_plot +
scale_fill_manual(values = component_colours) +
theme(text = element_text(family = "Cabin",
colour = "#4C3232"),
legend.position = "none",
axis.title.y = element_blank(),
plot.subtitle = ggtext::element_textbox_simple(size = 16,
vjust = 1),
plot.title = element_text(family = "OPTIAuvantGothic-DemiBold",
size = 24,
face = "bold",
colour = "#200000"),
axis.text = element_text(colour = "#4C3232"))
#2 Add text hierarchy
Allow some breathing space
basic_bar_plot +
scale_fill_manual(values = component_colours) +
theme(text = element_text(family = "Cabin",
colour = "#4C3232"),
legend.position = "none",
axis.title.y = element_blank(),
plot.subtitle = ggtext::element_textbox_simple(size = 16,
vjust = 1,
margin = margin(0, 0, 12, 0)),
plot.title = element_text(family = "OPTIAuvantGothic-DemiBold",
size = 24,
face = "bold",
colour = "#200000",
margin = margin(12, 0, 12, 0)),
axis.text = element_text(colour = "#4C3232"))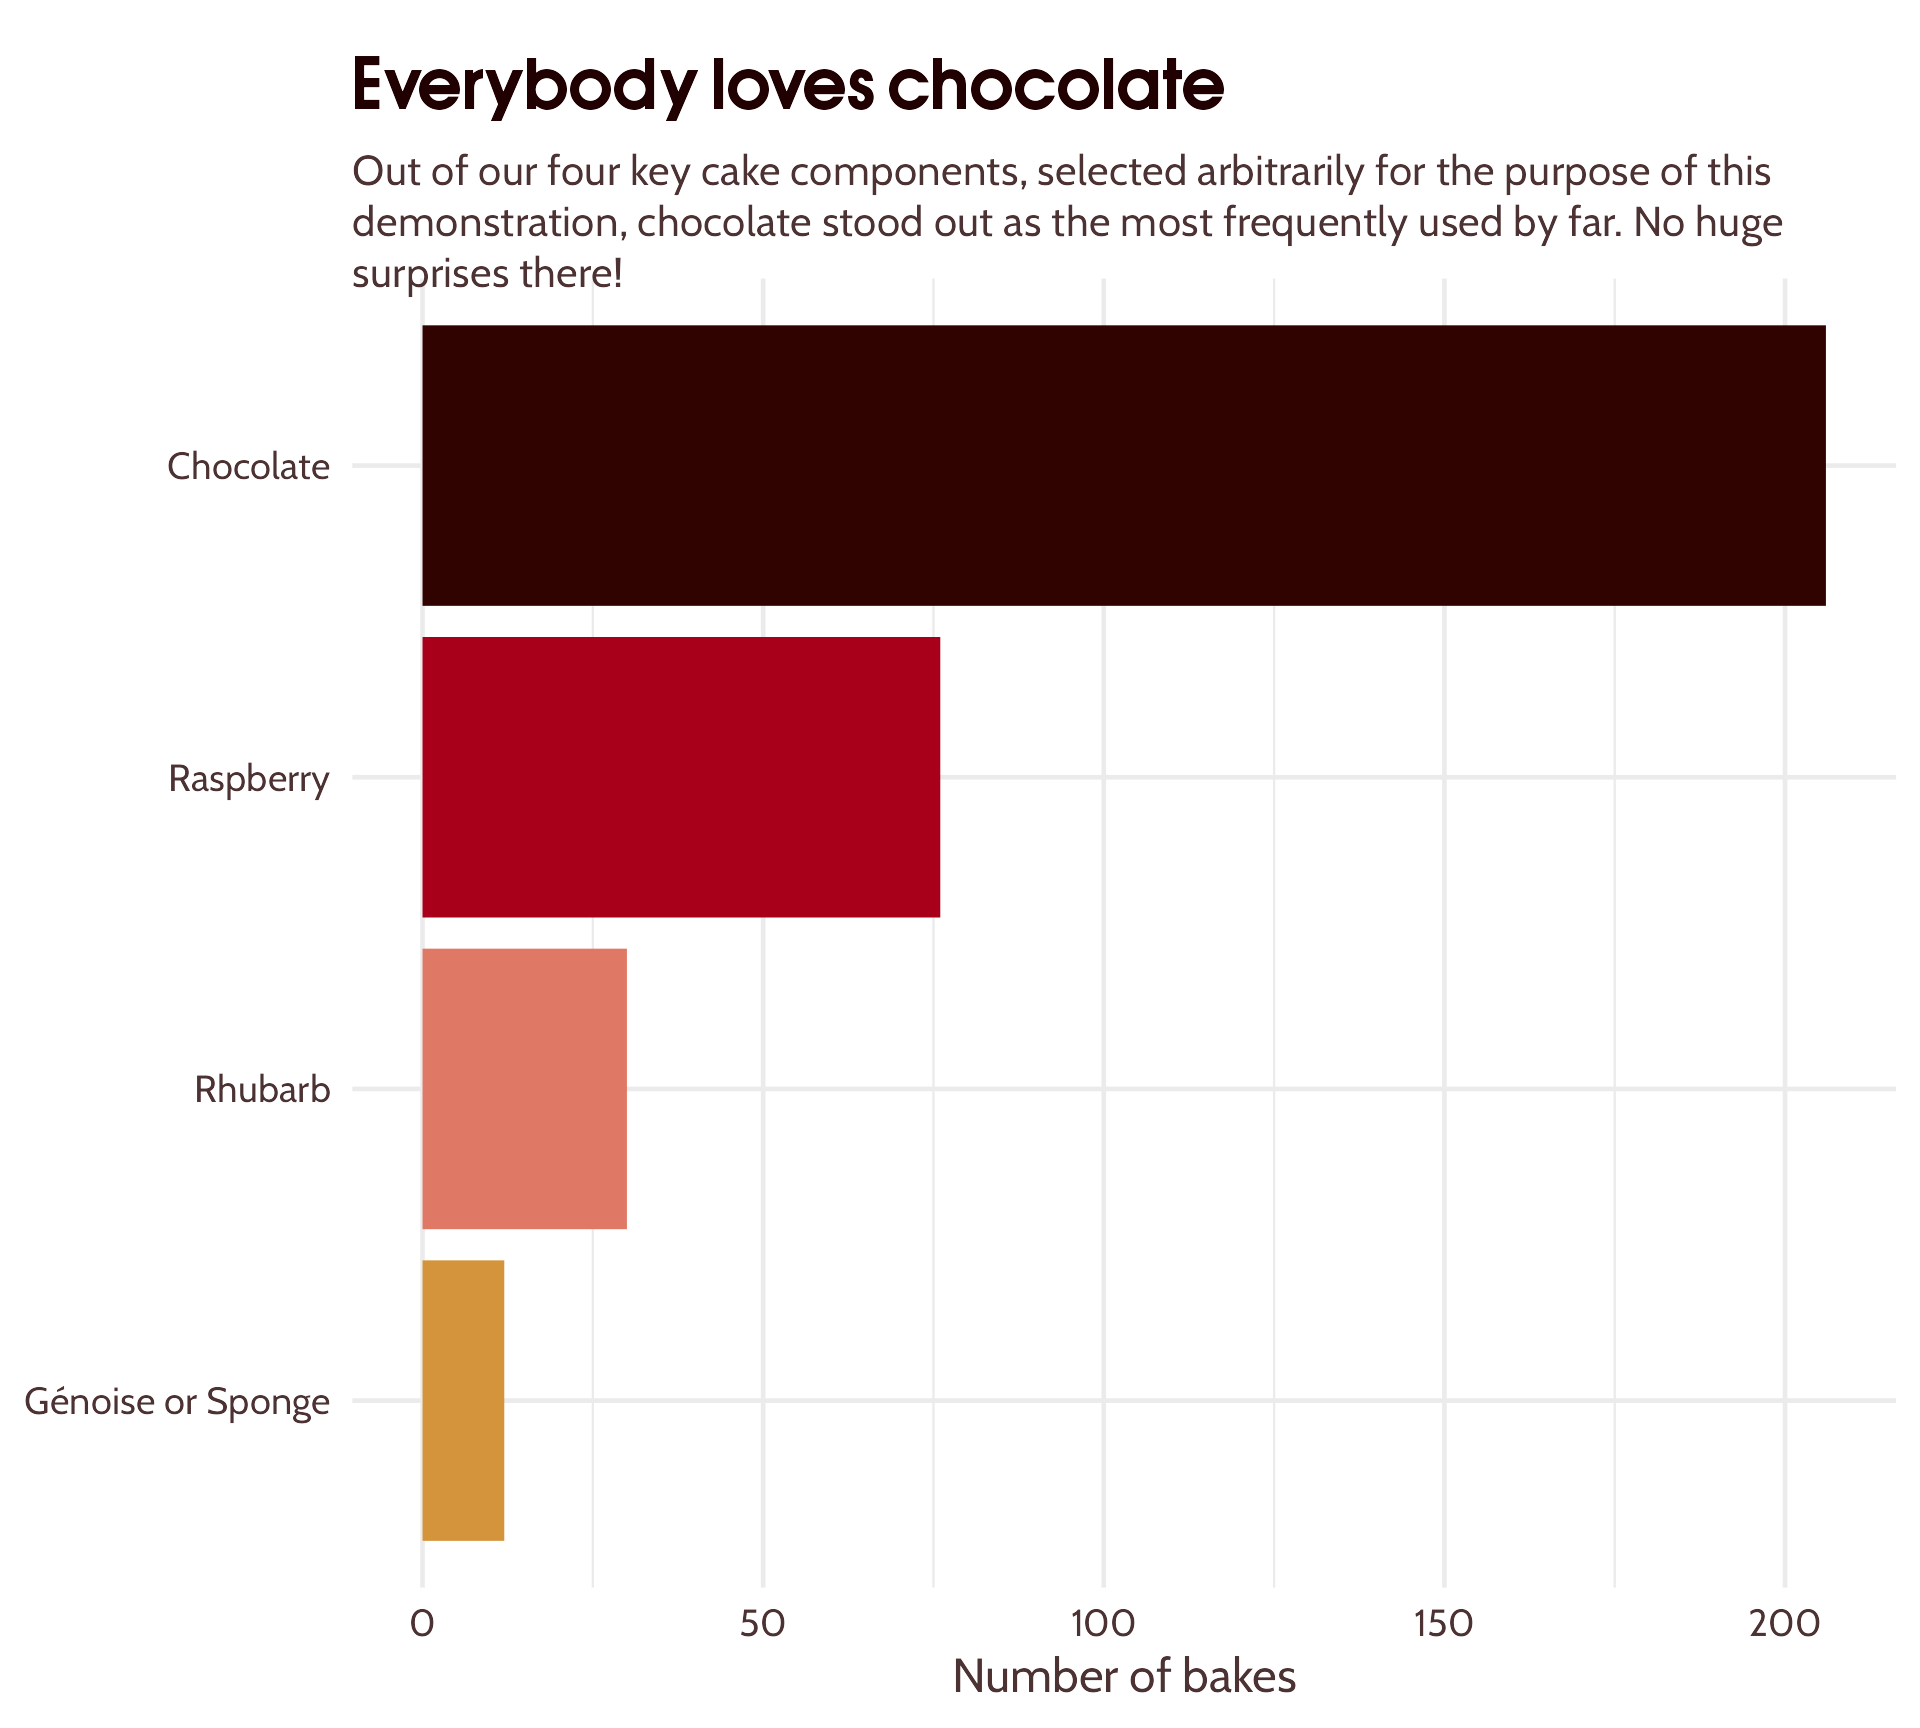
#2 Add text hierarchy


#2 Add text hierarchy
palmerpenguins::penguins %>%
ggplot() +
geom_point(aes(x = bill_length_mm,
y = flipper_length_mm,
colour = species,
size = body_mass_g)) +
labs(x = "Bill length (mm)",
y = "Flipper length (mm)",
title = "Let's try some *italics* in the title",
subtitle = "Lorem ipsum dolor sit amet, consectetur adipiscing elit, sed do eiusmod tempor incididunt ut labore et dolore magna aliqua. Ut enim ad minim veniam, quis nostrud exercitation ullamco laboris nisi ut aliquip ex ea commodo consequat.",
caption = "Data from {palmerpenguins}") +
guides(size = "none") 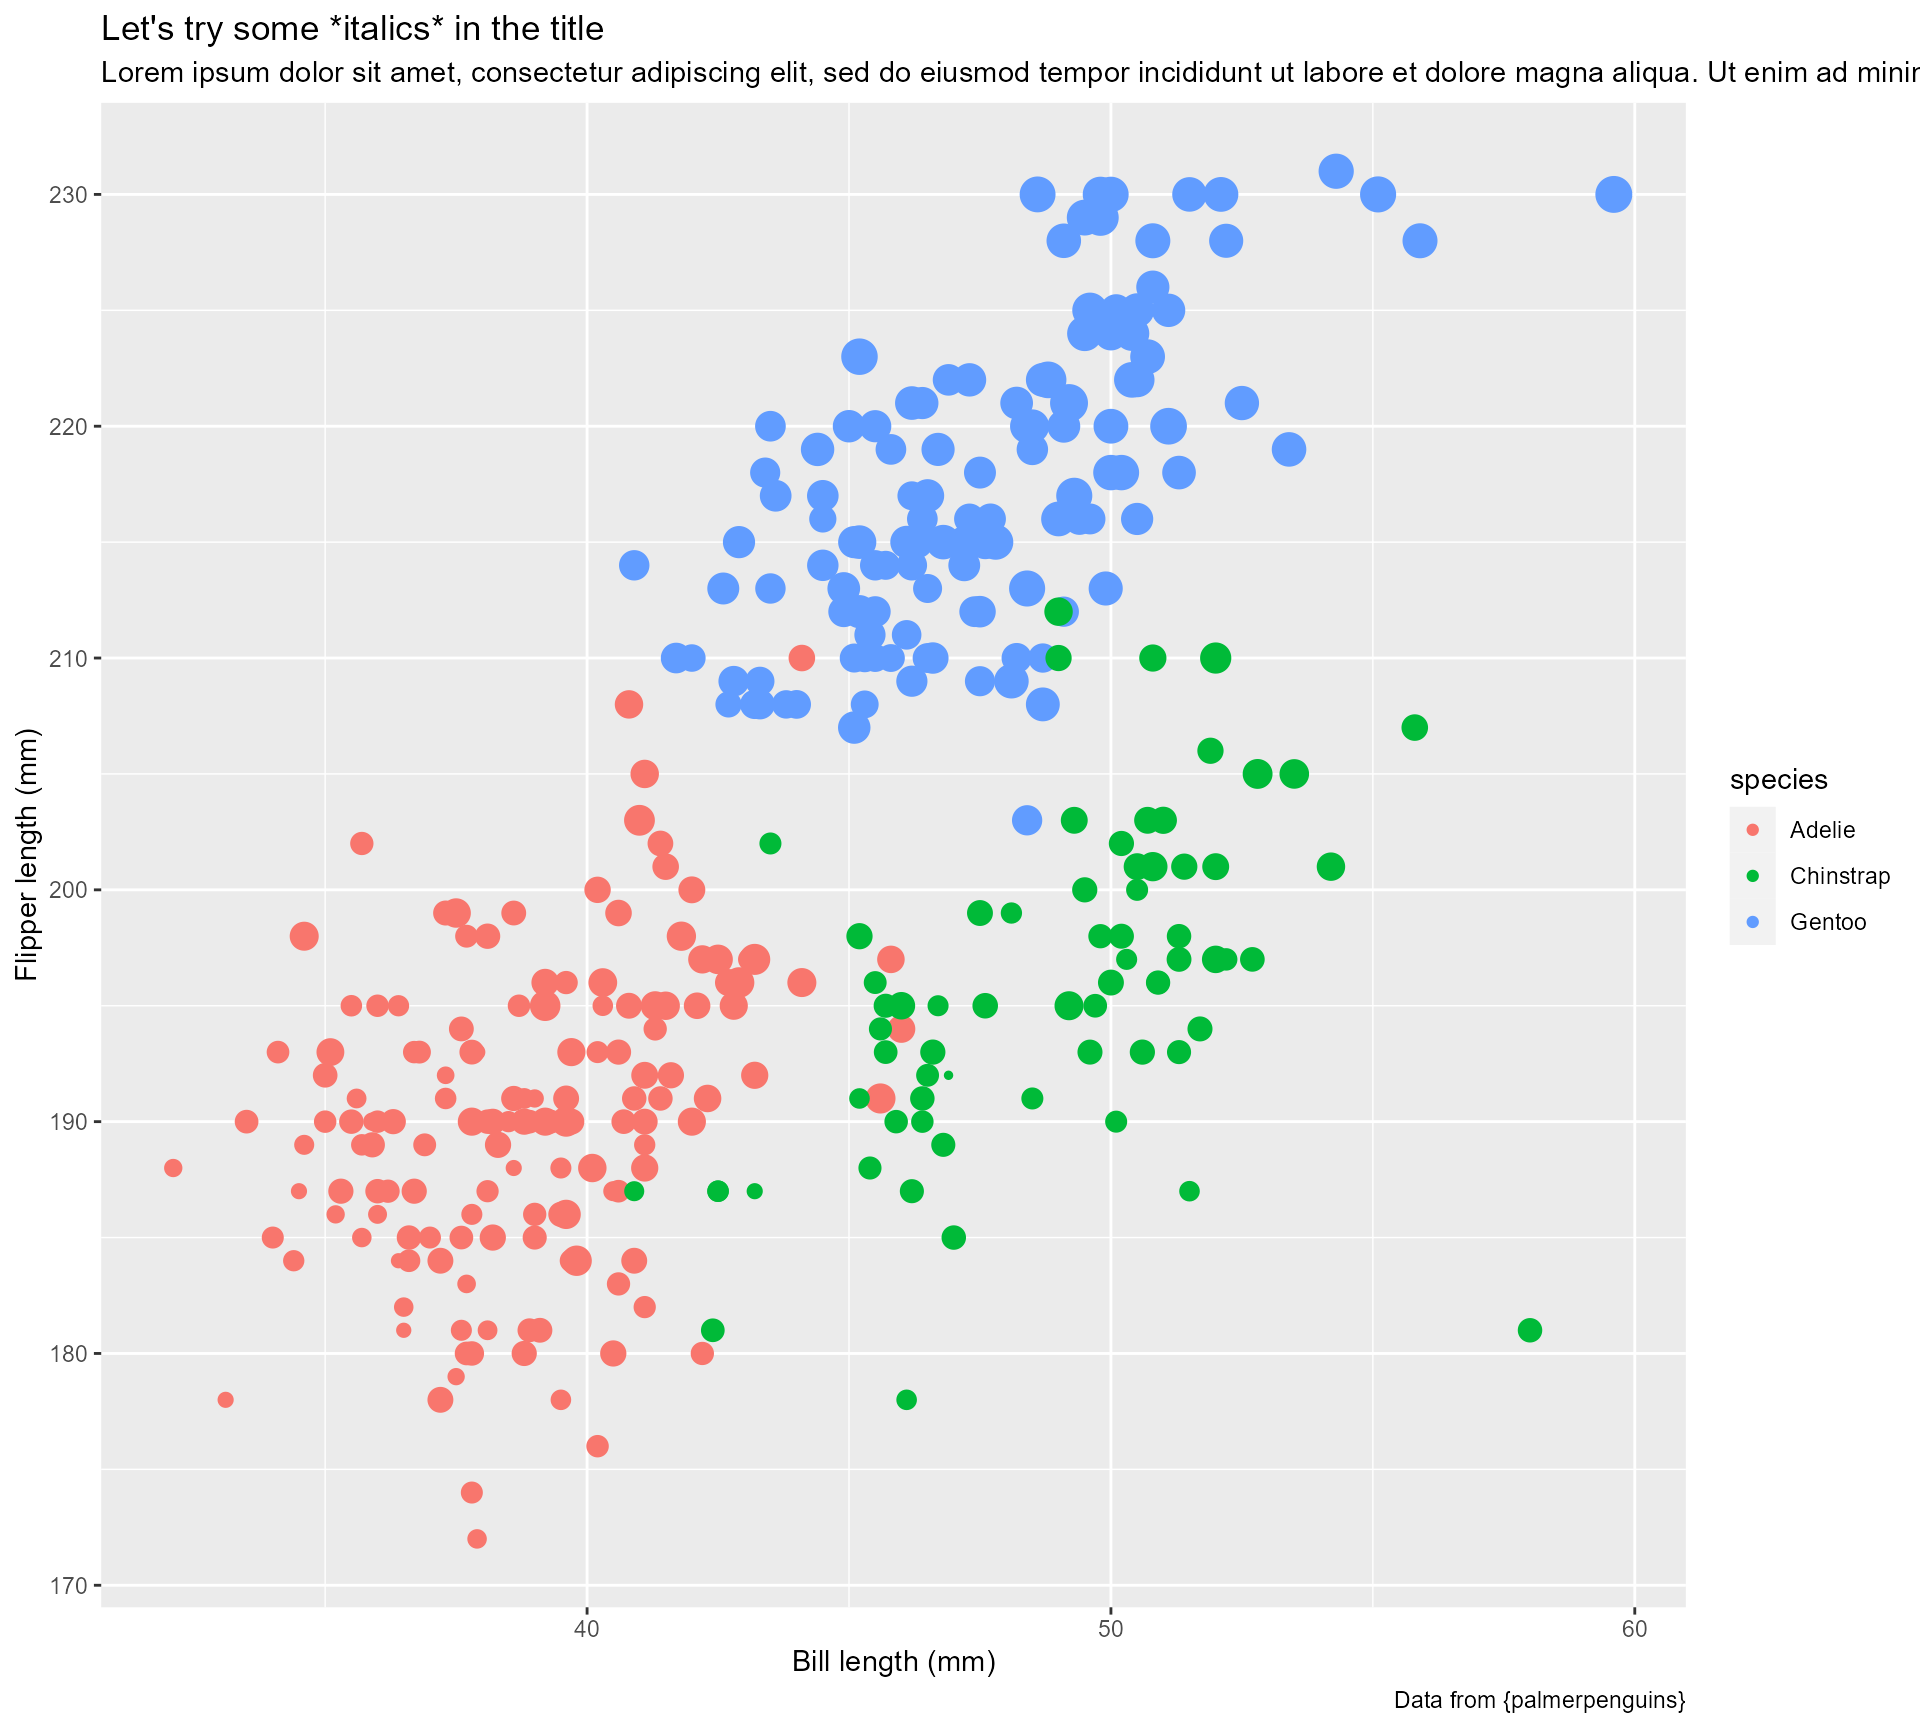
#2 Add text hierarchy
palmerpenguins::penguins %>%
ggplot() +
geom_point(aes(x = bill_length_mm,
y = flipper_length_mm,
colour = species,
size = body_mass_g)) +
labs(x = "Bill length (mm)",
y = "Flipper length (mm)",
title = "Let's try some *italics* in the title",
subtitle = "Lorem ipsum dolor sit amet, consectetur adipiscing elit, sed do eiusmod tempor incididunt ut labore et dolore magna aliqua. Ut enim ad minim veniam, quis nostrud exercitation ullamco laboris nisi ut aliquip ex ea commodo consequat.",
caption = "Data from {palmerpenguins}") +
guides(size = "none") +
ophelia::theme_ophelia()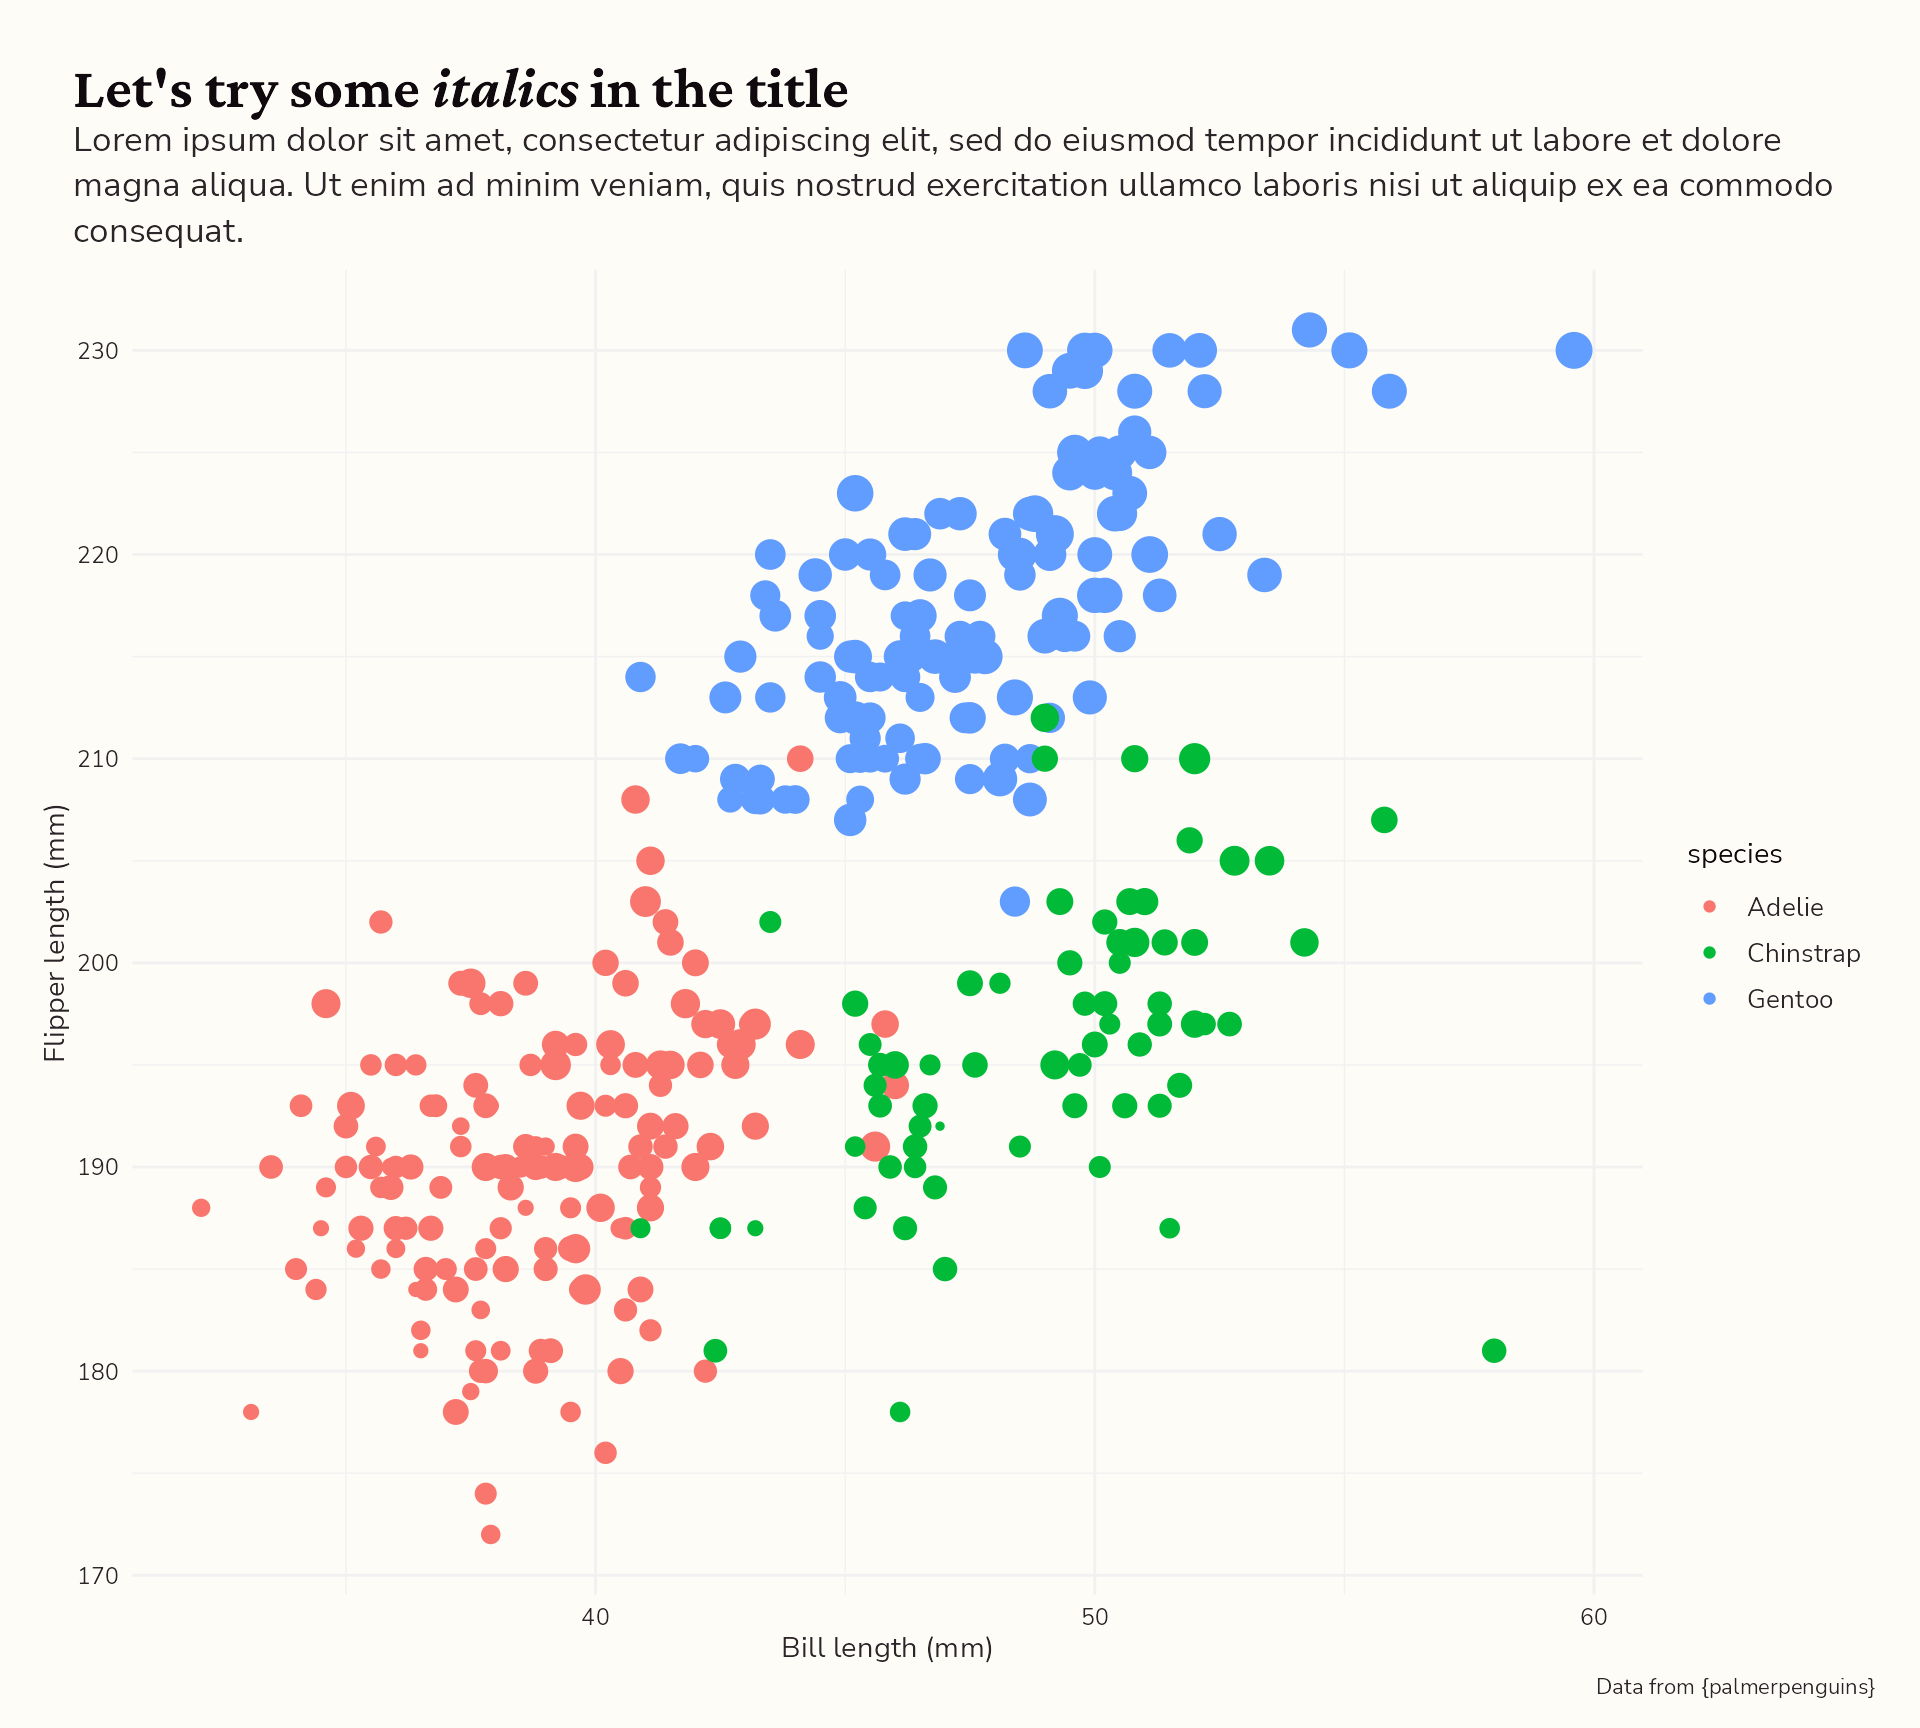
#2 Add text hierarchy
palmerpenguins::penguins %>%
ggplot() +
geom_point(aes(x = bill_length_mm,
y = flipper_length_mm,
colour = species,
size = body_mass_g)) +
labs(x = "Bill length (mm)",
y = "Flipper length (mm)",
title = "Let's try some *italics* in the title",
subtitle = "Lorem ipsum dolor sit amet, consectetur adipiscing elit, sed do eiusmod tempor incididunt ut labore et dolore magna aliqua. Ut enim ad minim veniam, quis nostrud exercitation ullamco laboris nisi ut aliquip ex ea commodo consequat.",
caption = "Data from {palmerpenguins}") +
guides(size = "none") +
ophelia::scale_colour_ophelia() +
ophelia::theme_ophelia()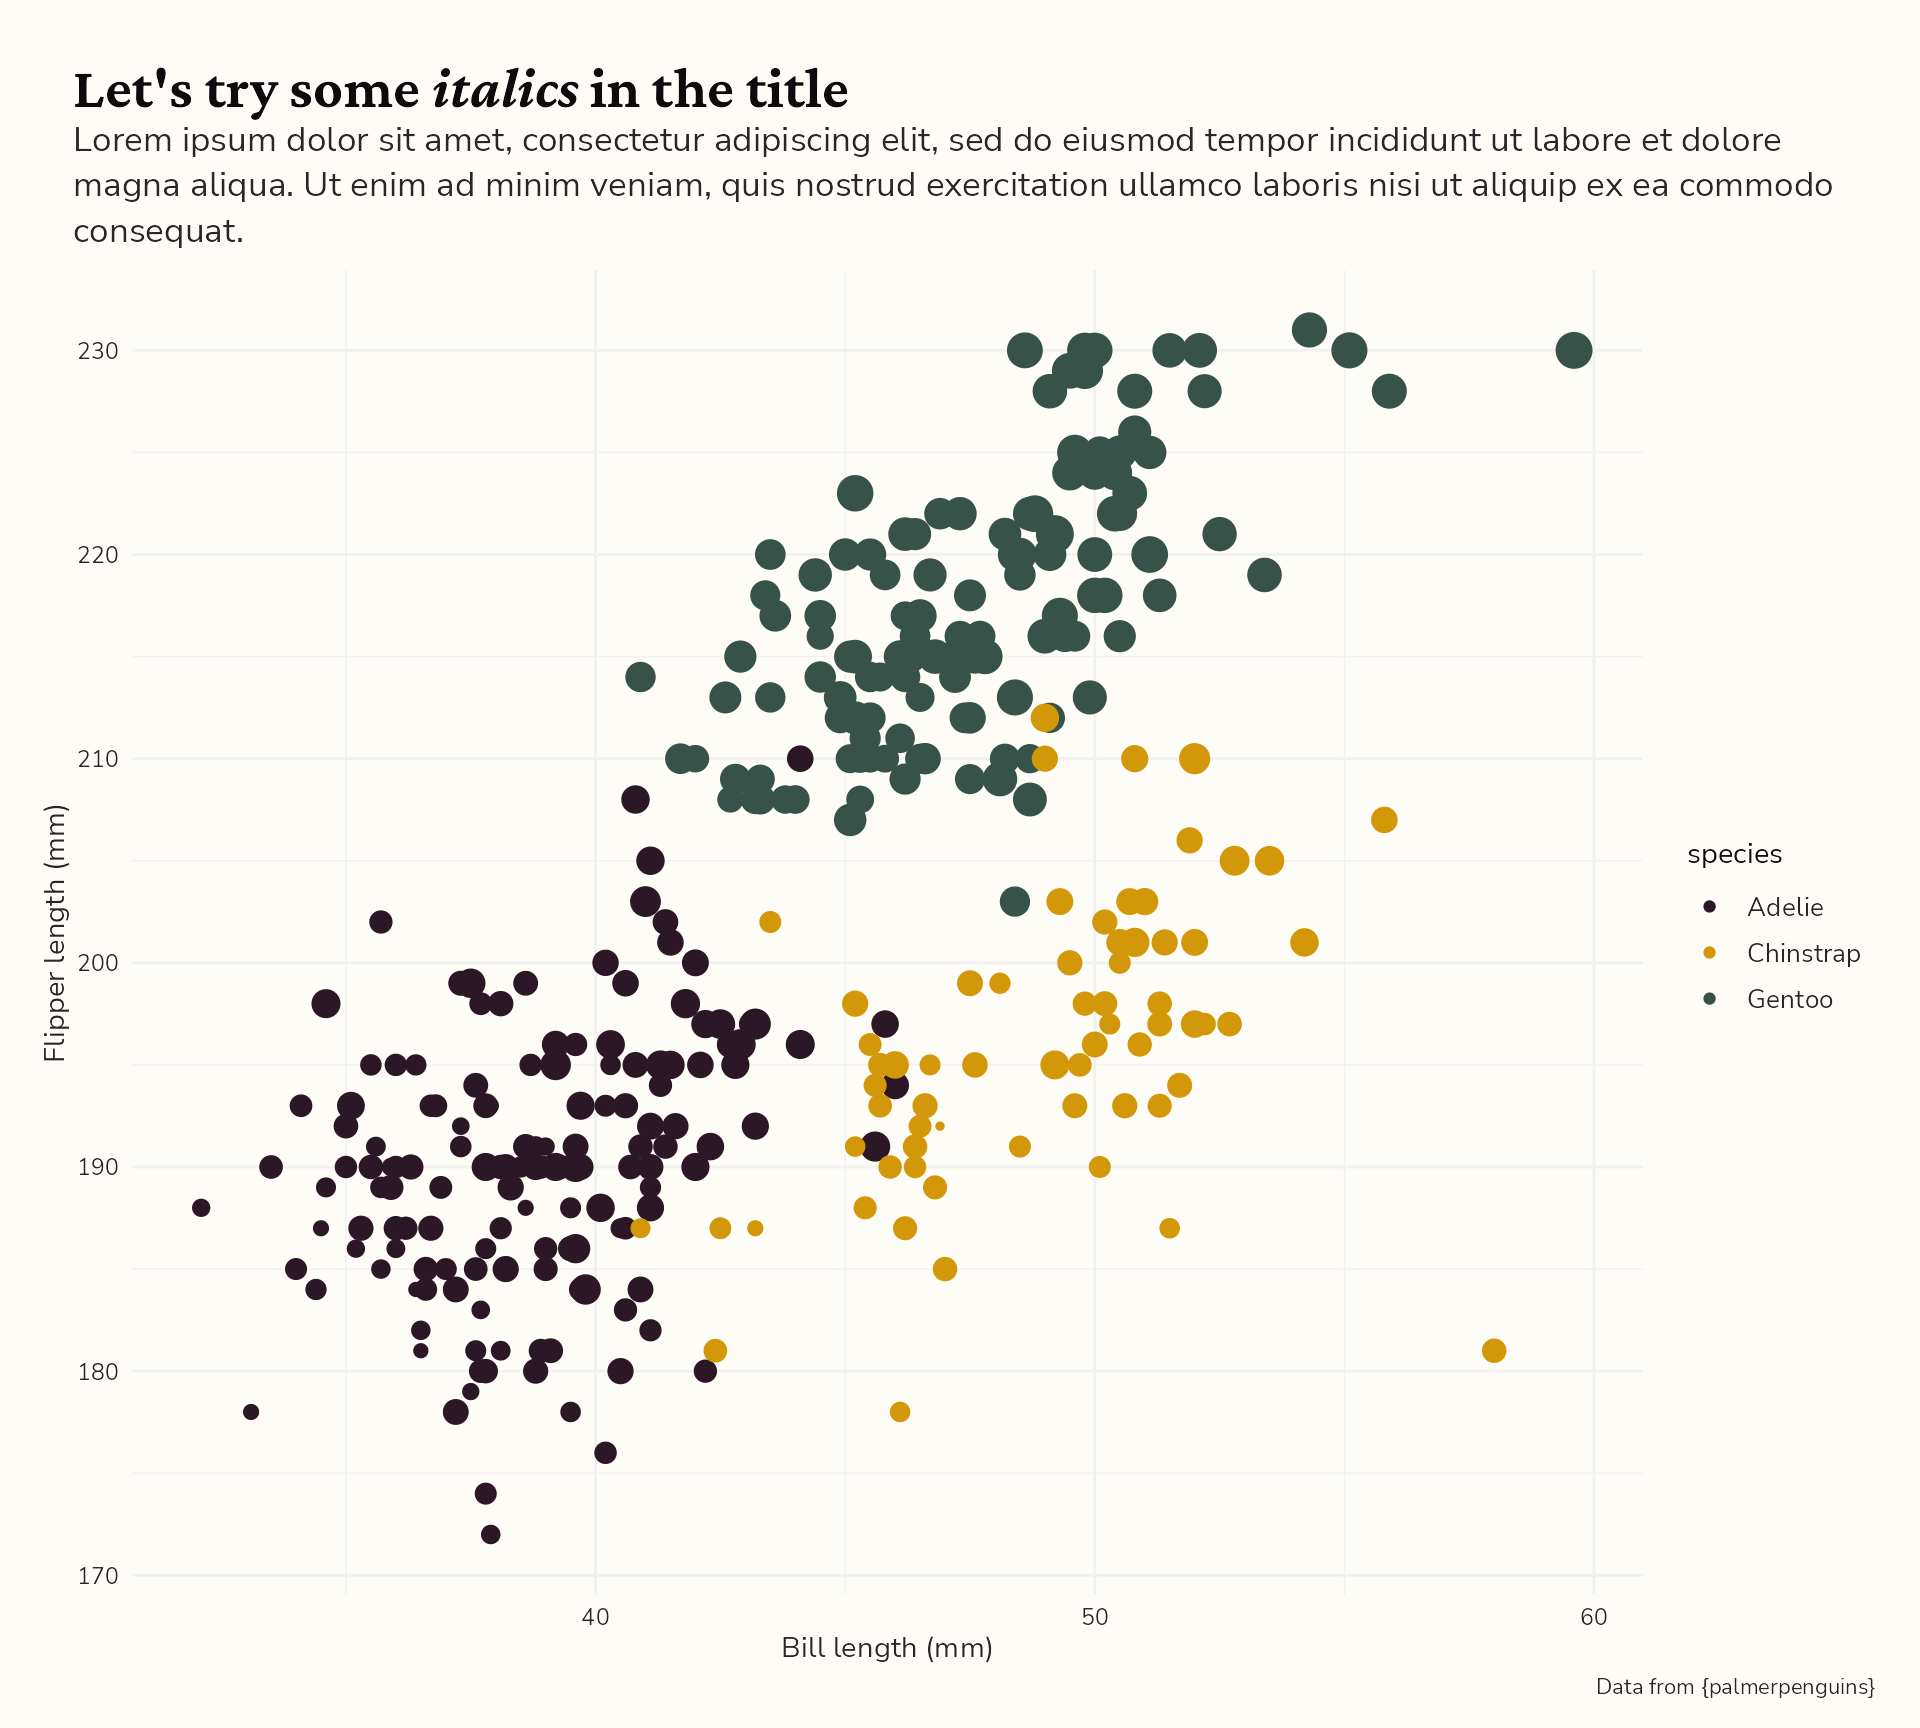
#3 Reduce unnecessary eye movement
Our starting point

#3 Reduce unnecessary eye movement
Mind the gap!

#3 Reduce unnecessary eye movement
I ❤️ {ggtext}
#3 Reduce unnecessary eye movement
Debugging mode
#3 Reduce unnecessary eye movement
Debugging mode
#3 Reduce unnecessary eye movement
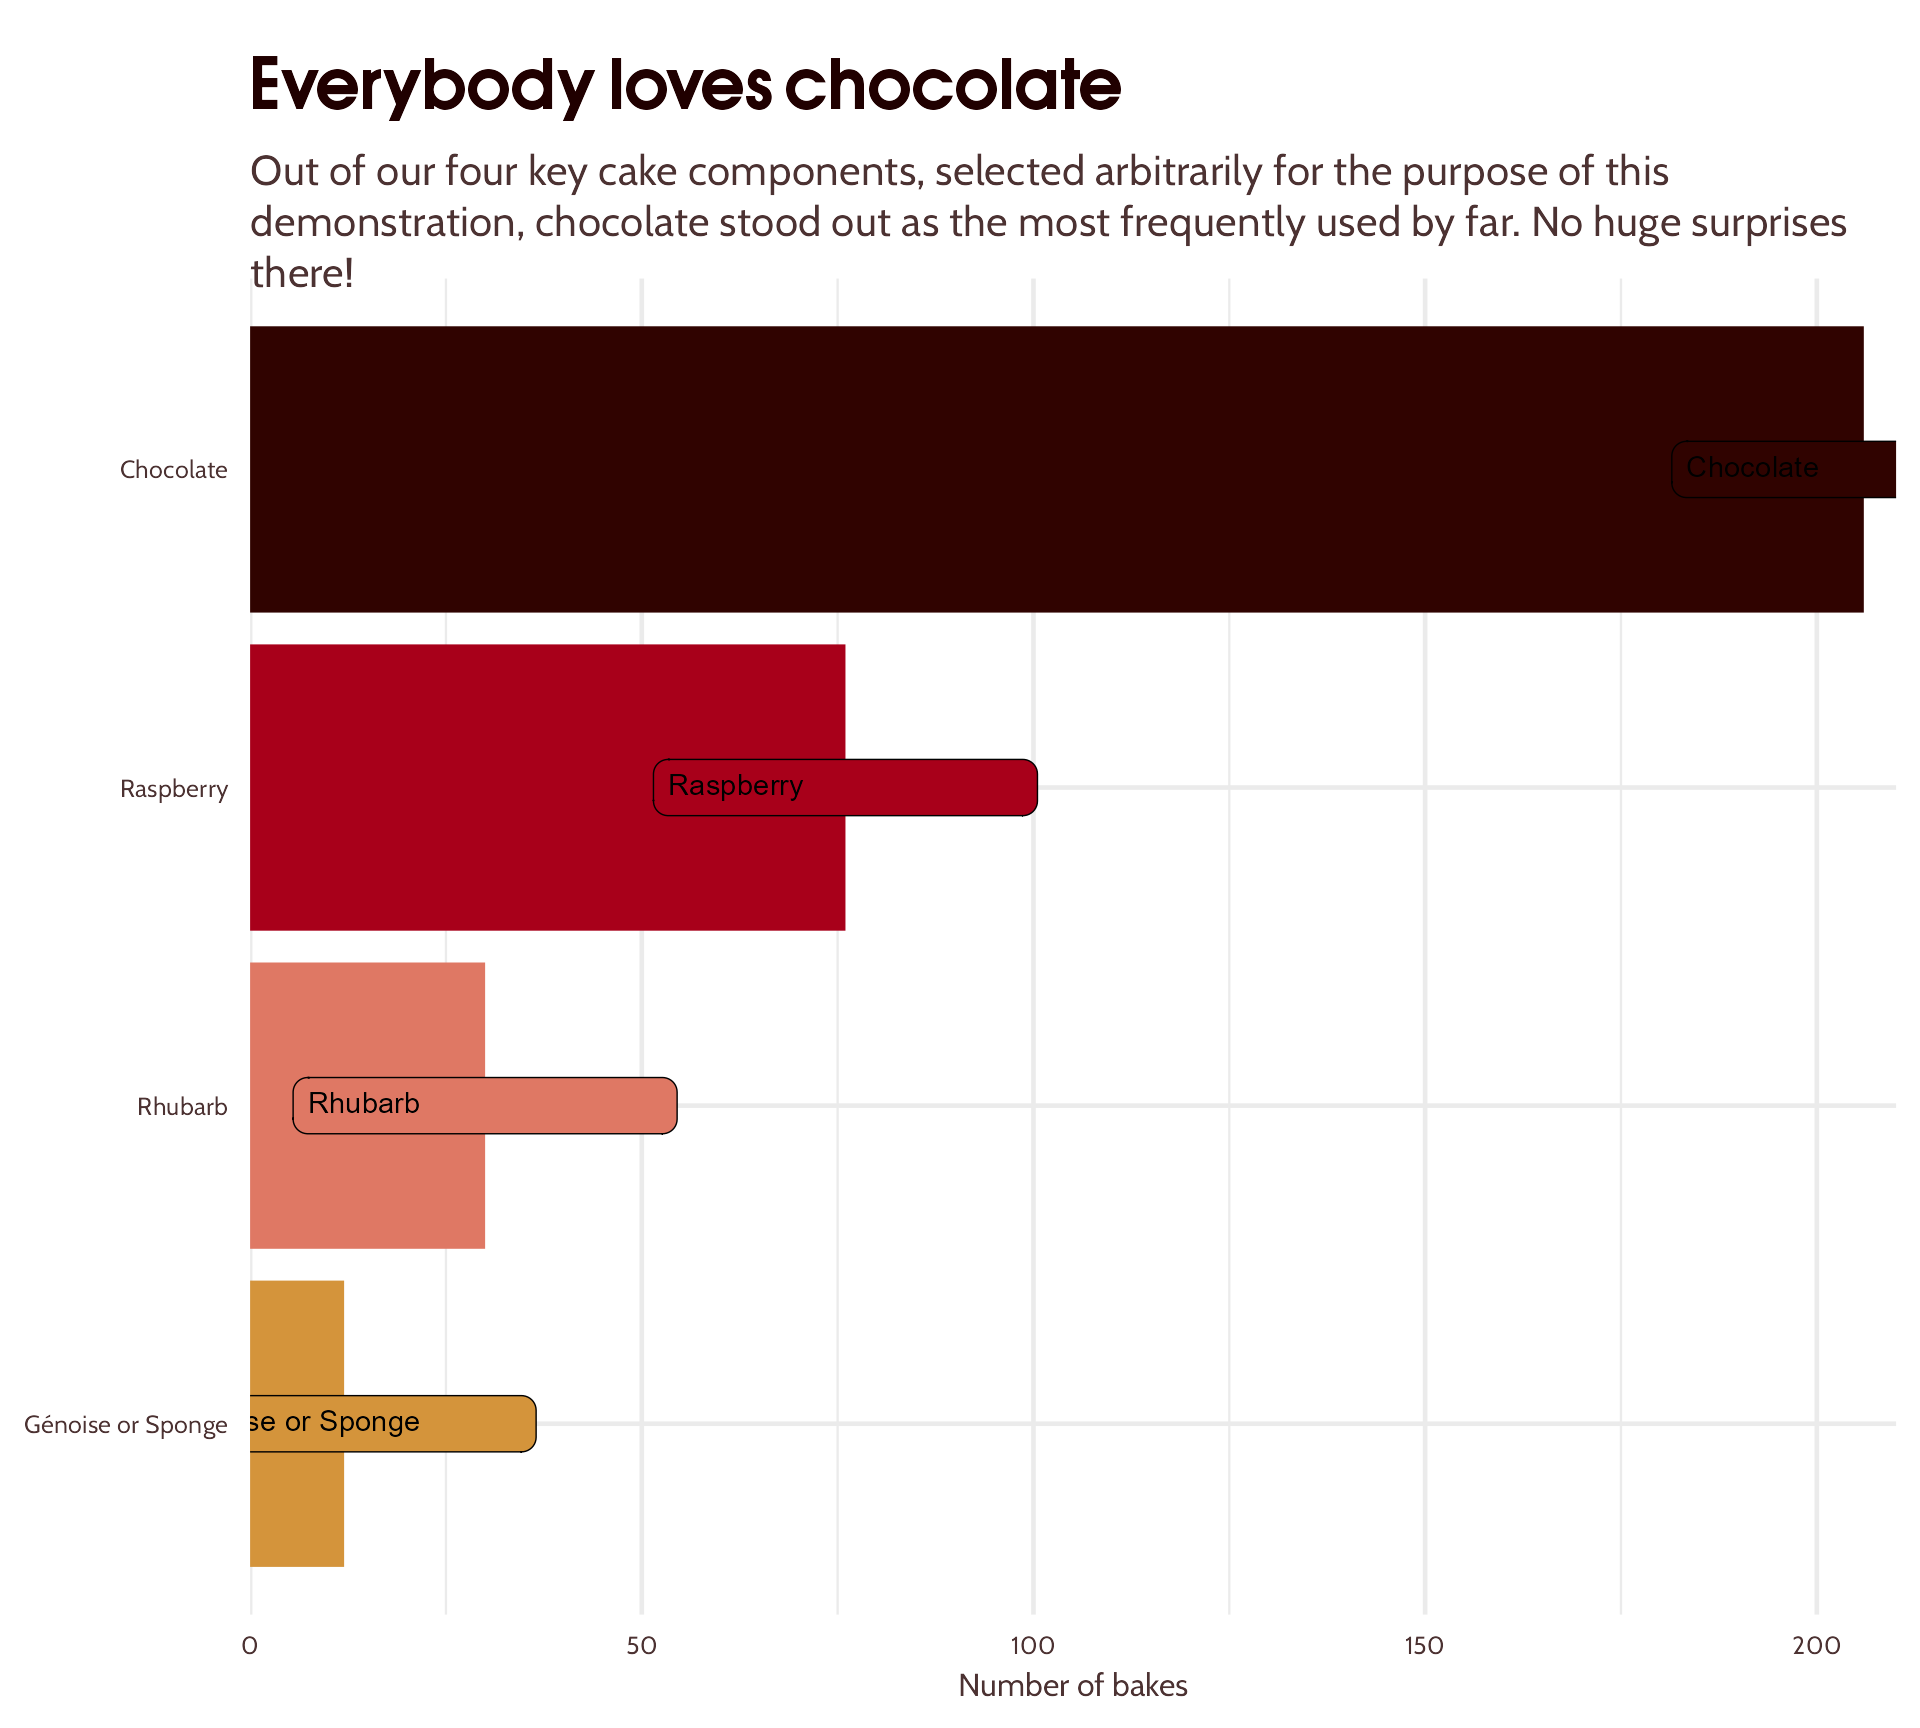
Conditional alignments!
#3 Reduce unnecessary eye movement
Conditional alignments & colour
bar_plot_text_hierarchy +
scale_y_continuous(expand = expansion(c(0, 0.02))) +
ggtext::geom_textbox(aes(label = component,
hjust = case_when(count < 50 ~ 0,
TRUE ~ 1),
halign = case_when(count < 50 ~ 0,
TRUE ~ 1),
colour = case_when(count < 50 ~ "#4C3232",
TRUE ~ "white")),
size = 7,
fill = "white")
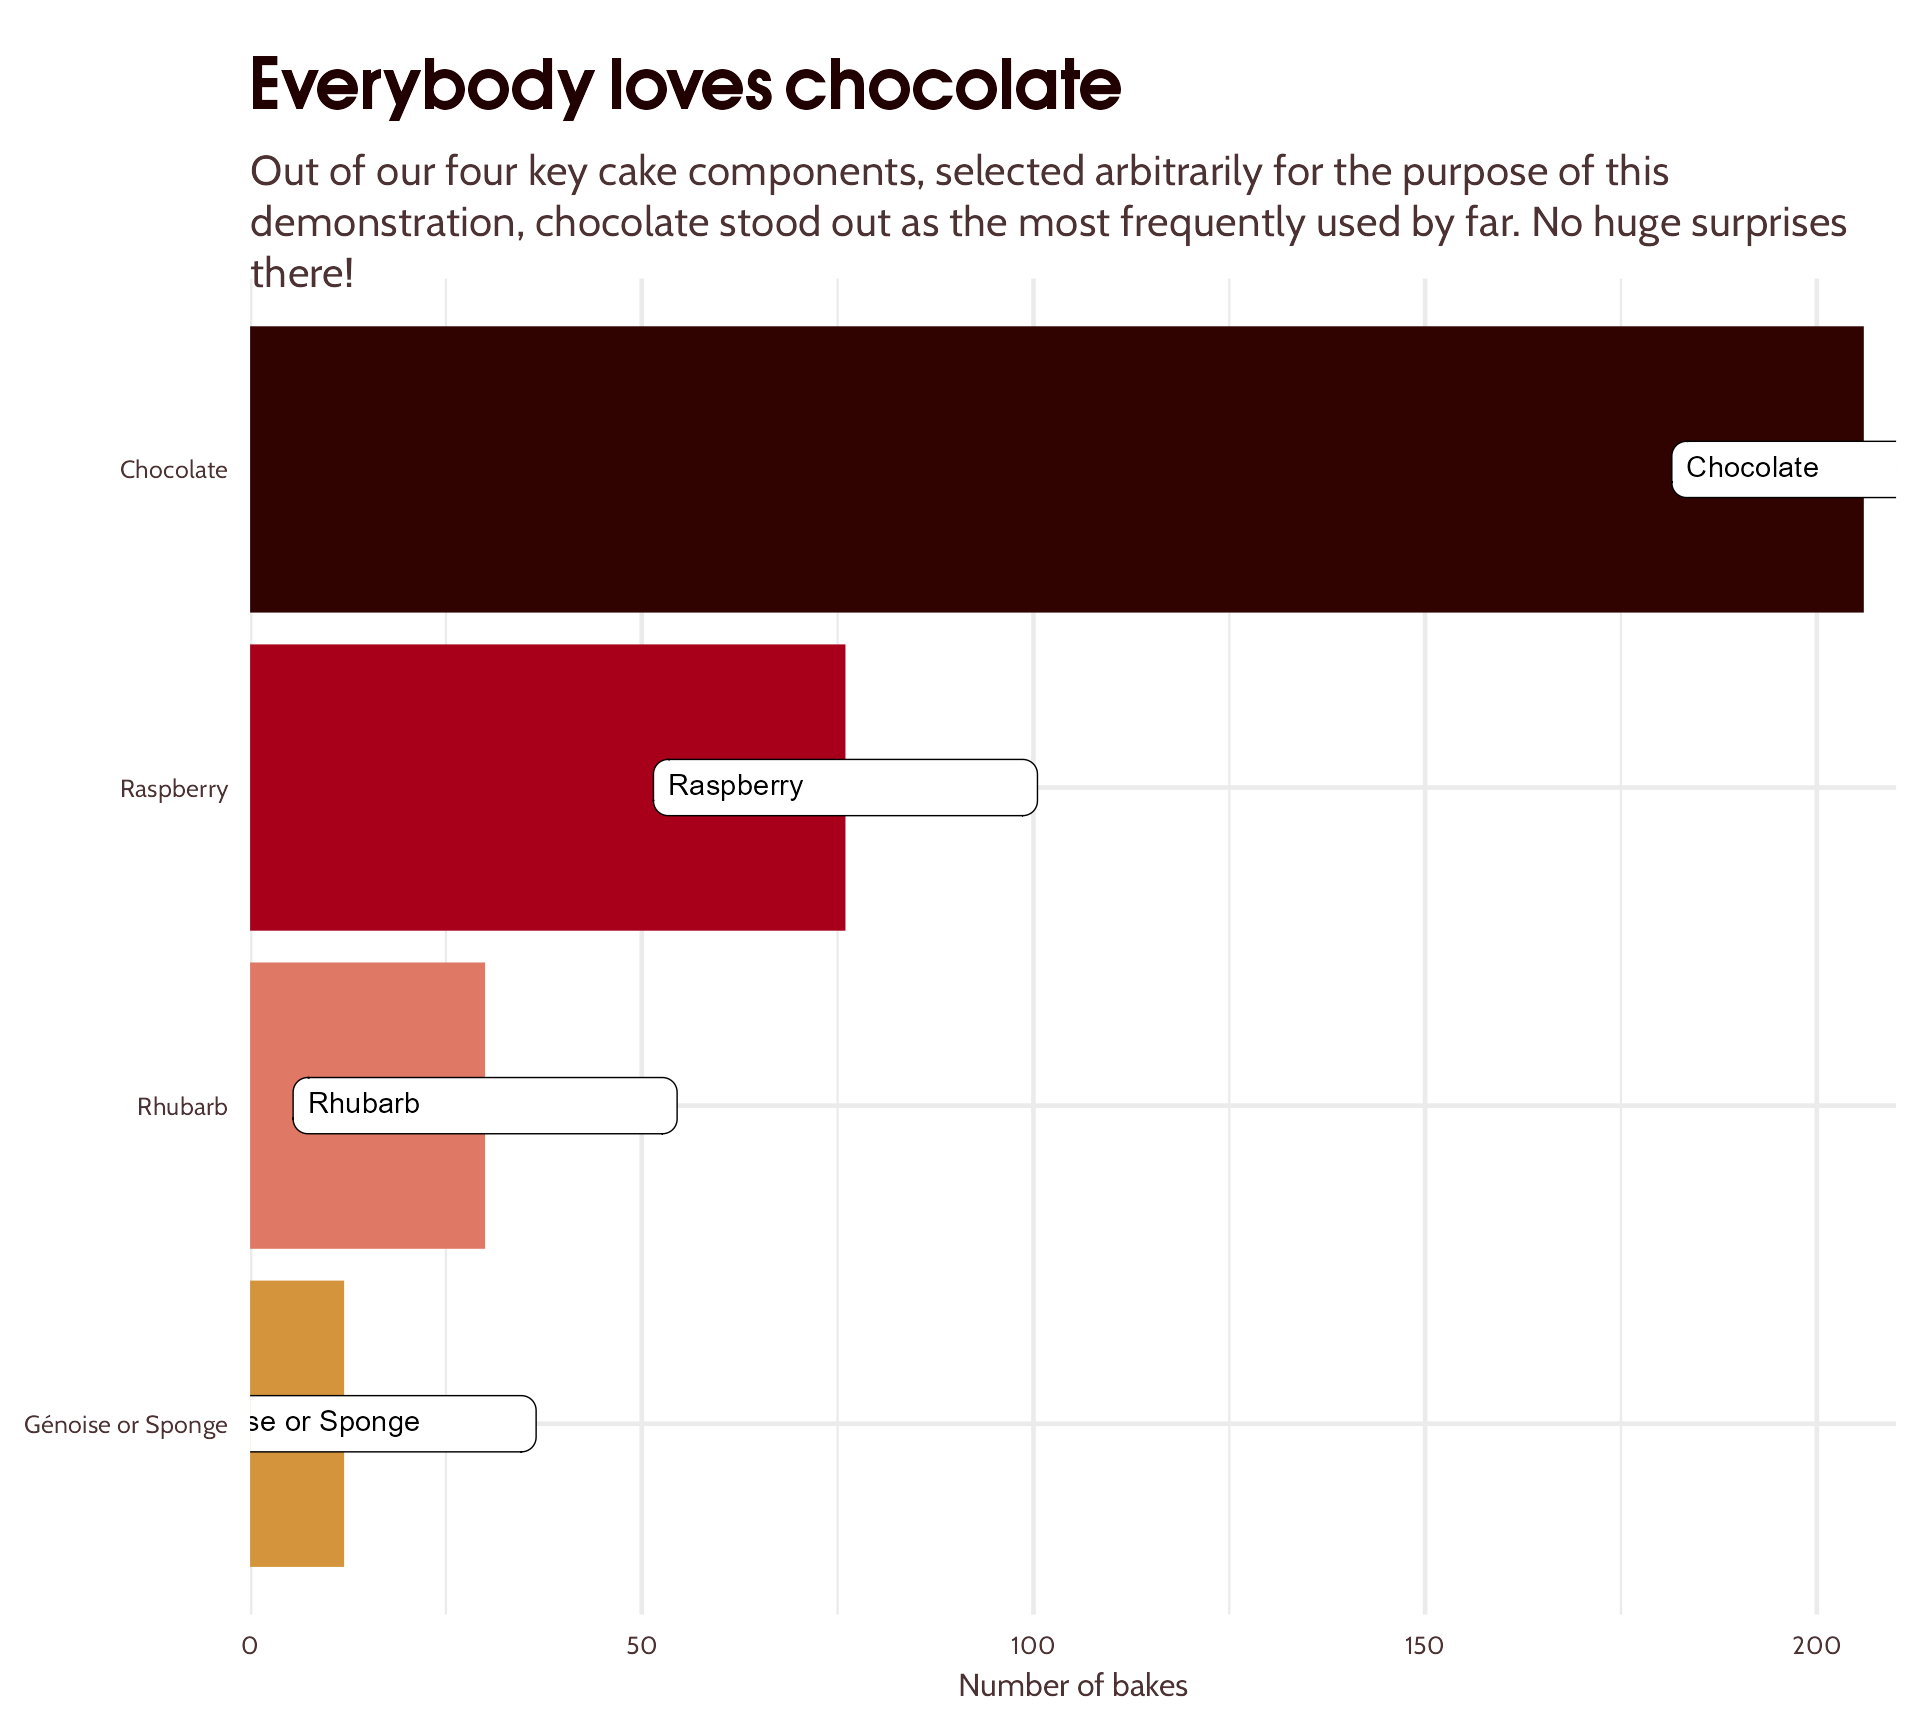
#3 Reduce unnecessary eye movement
Conditional alignments & colour
bar_plot_text_hierarchy +
scale_y_continuous(expand = expansion(c(0, 0.02))) +
ggtext::geom_textbox(aes(label = component,
hjust = case_when(count < 50 ~ 0,
TRUE ~ 1),
halign = case_when(count < 50 ~ 0,
TRUE ~ 1),
colour = case_when(count < 50 ~ "#4C3232",
TRUE ~ "white")),
size = 7,
fill = "white") +
scale_colour_identity()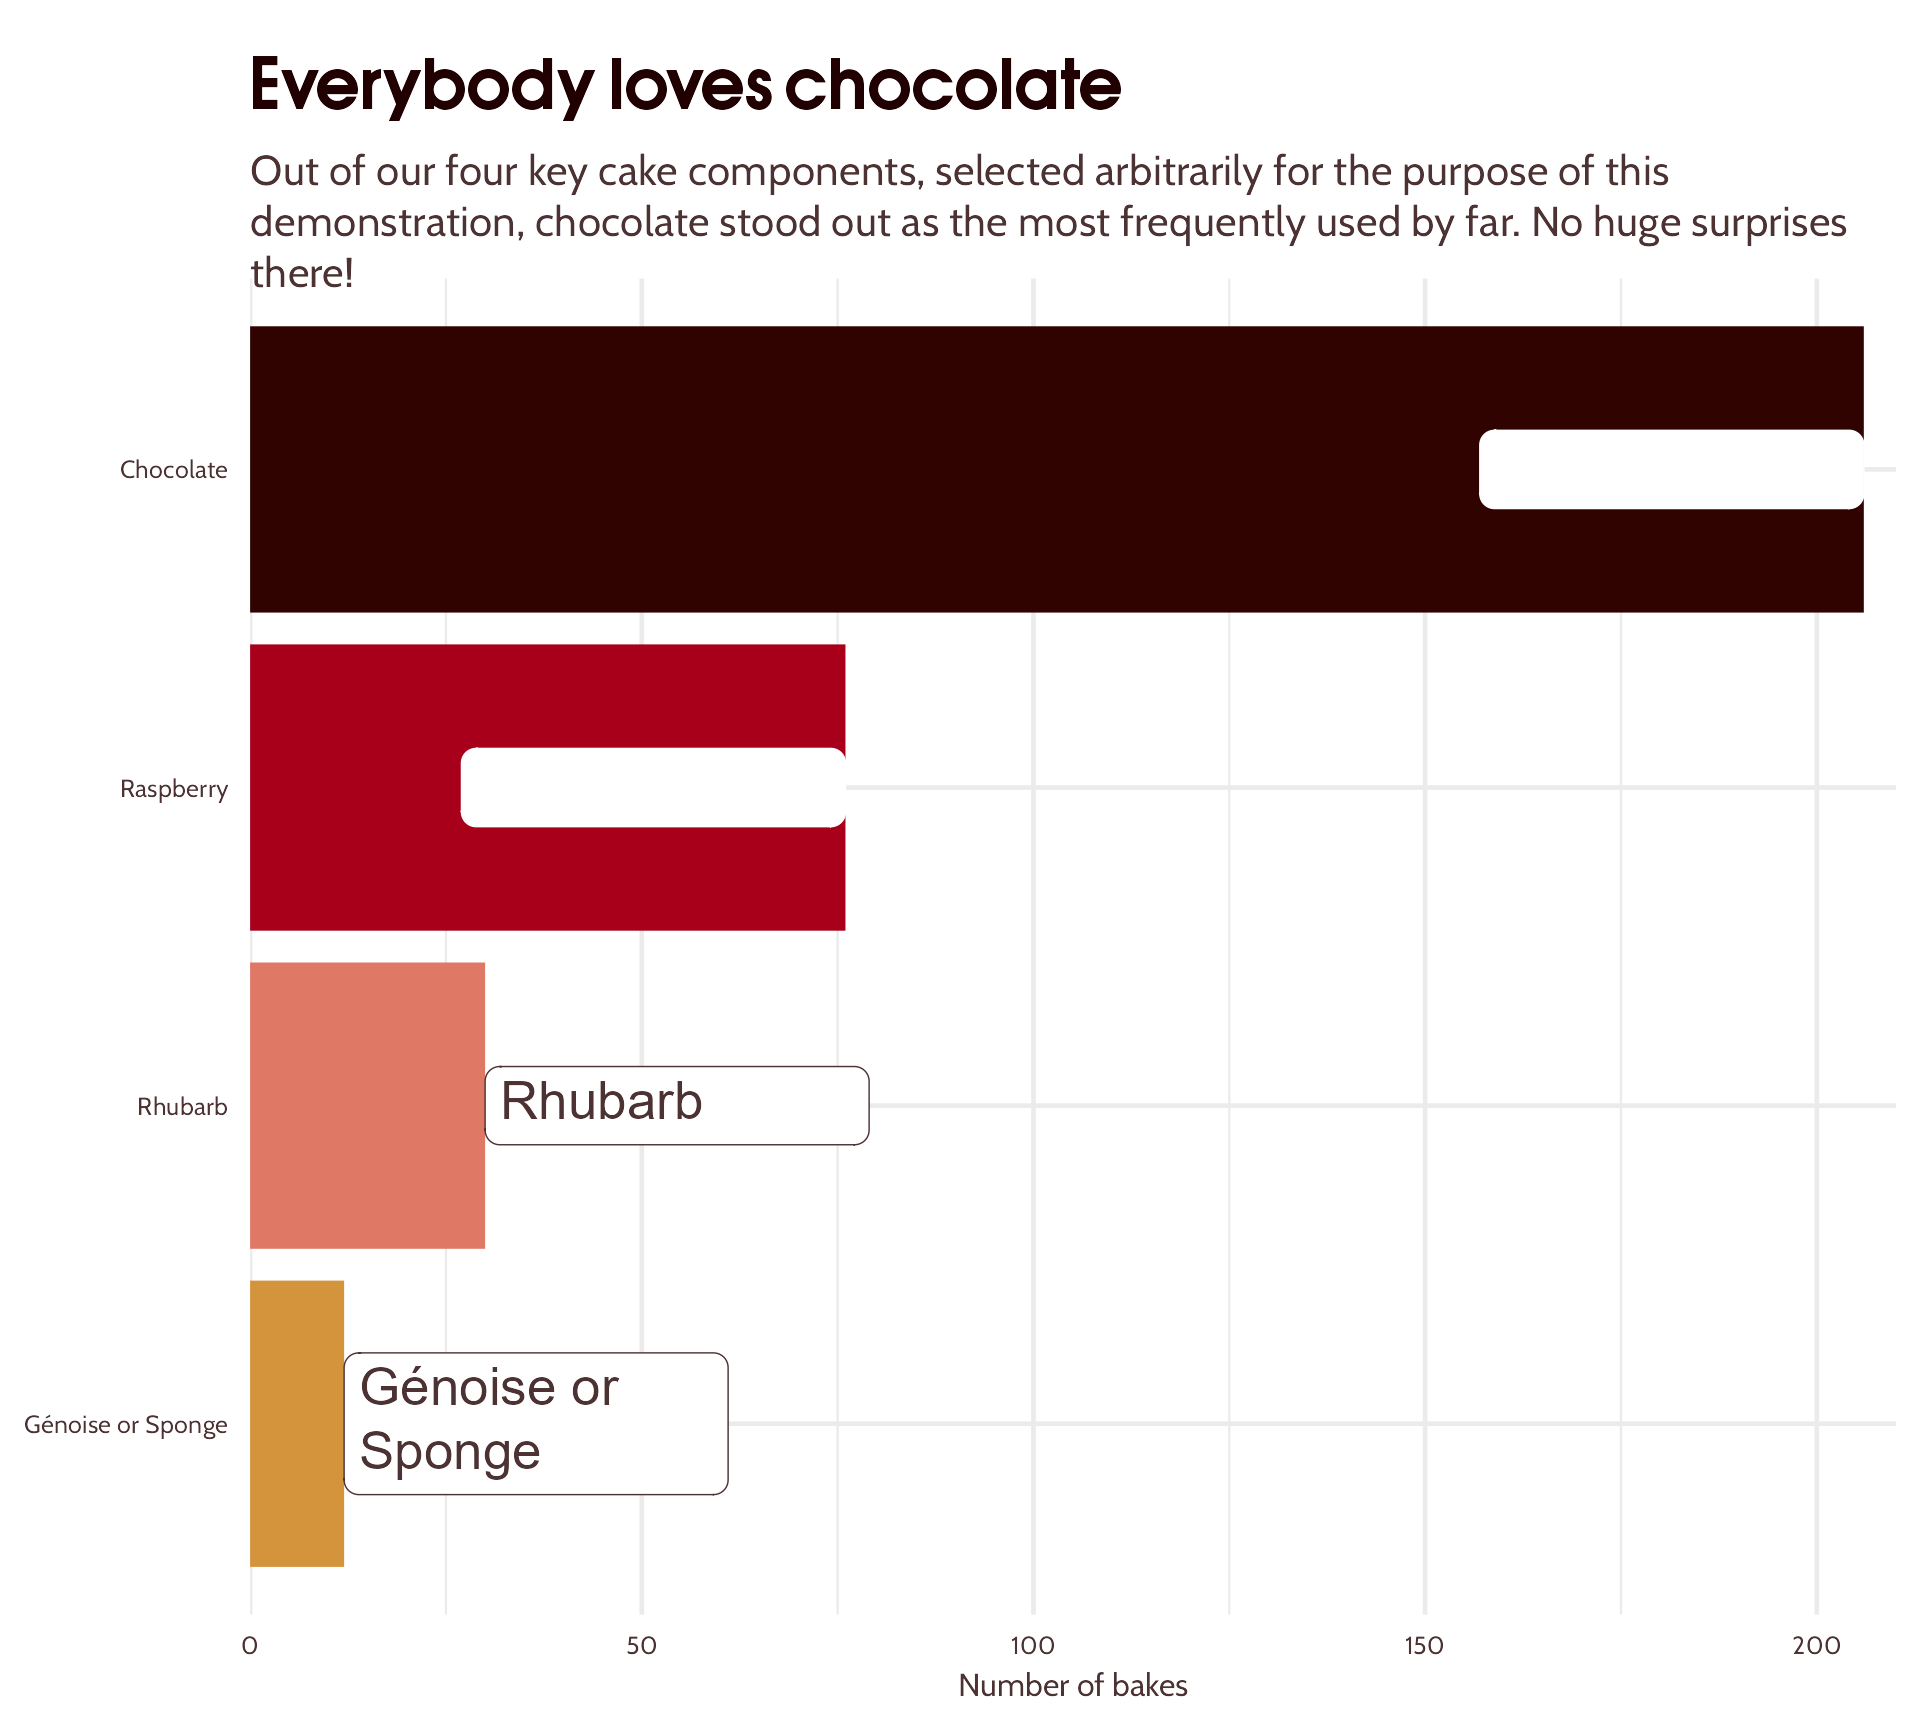
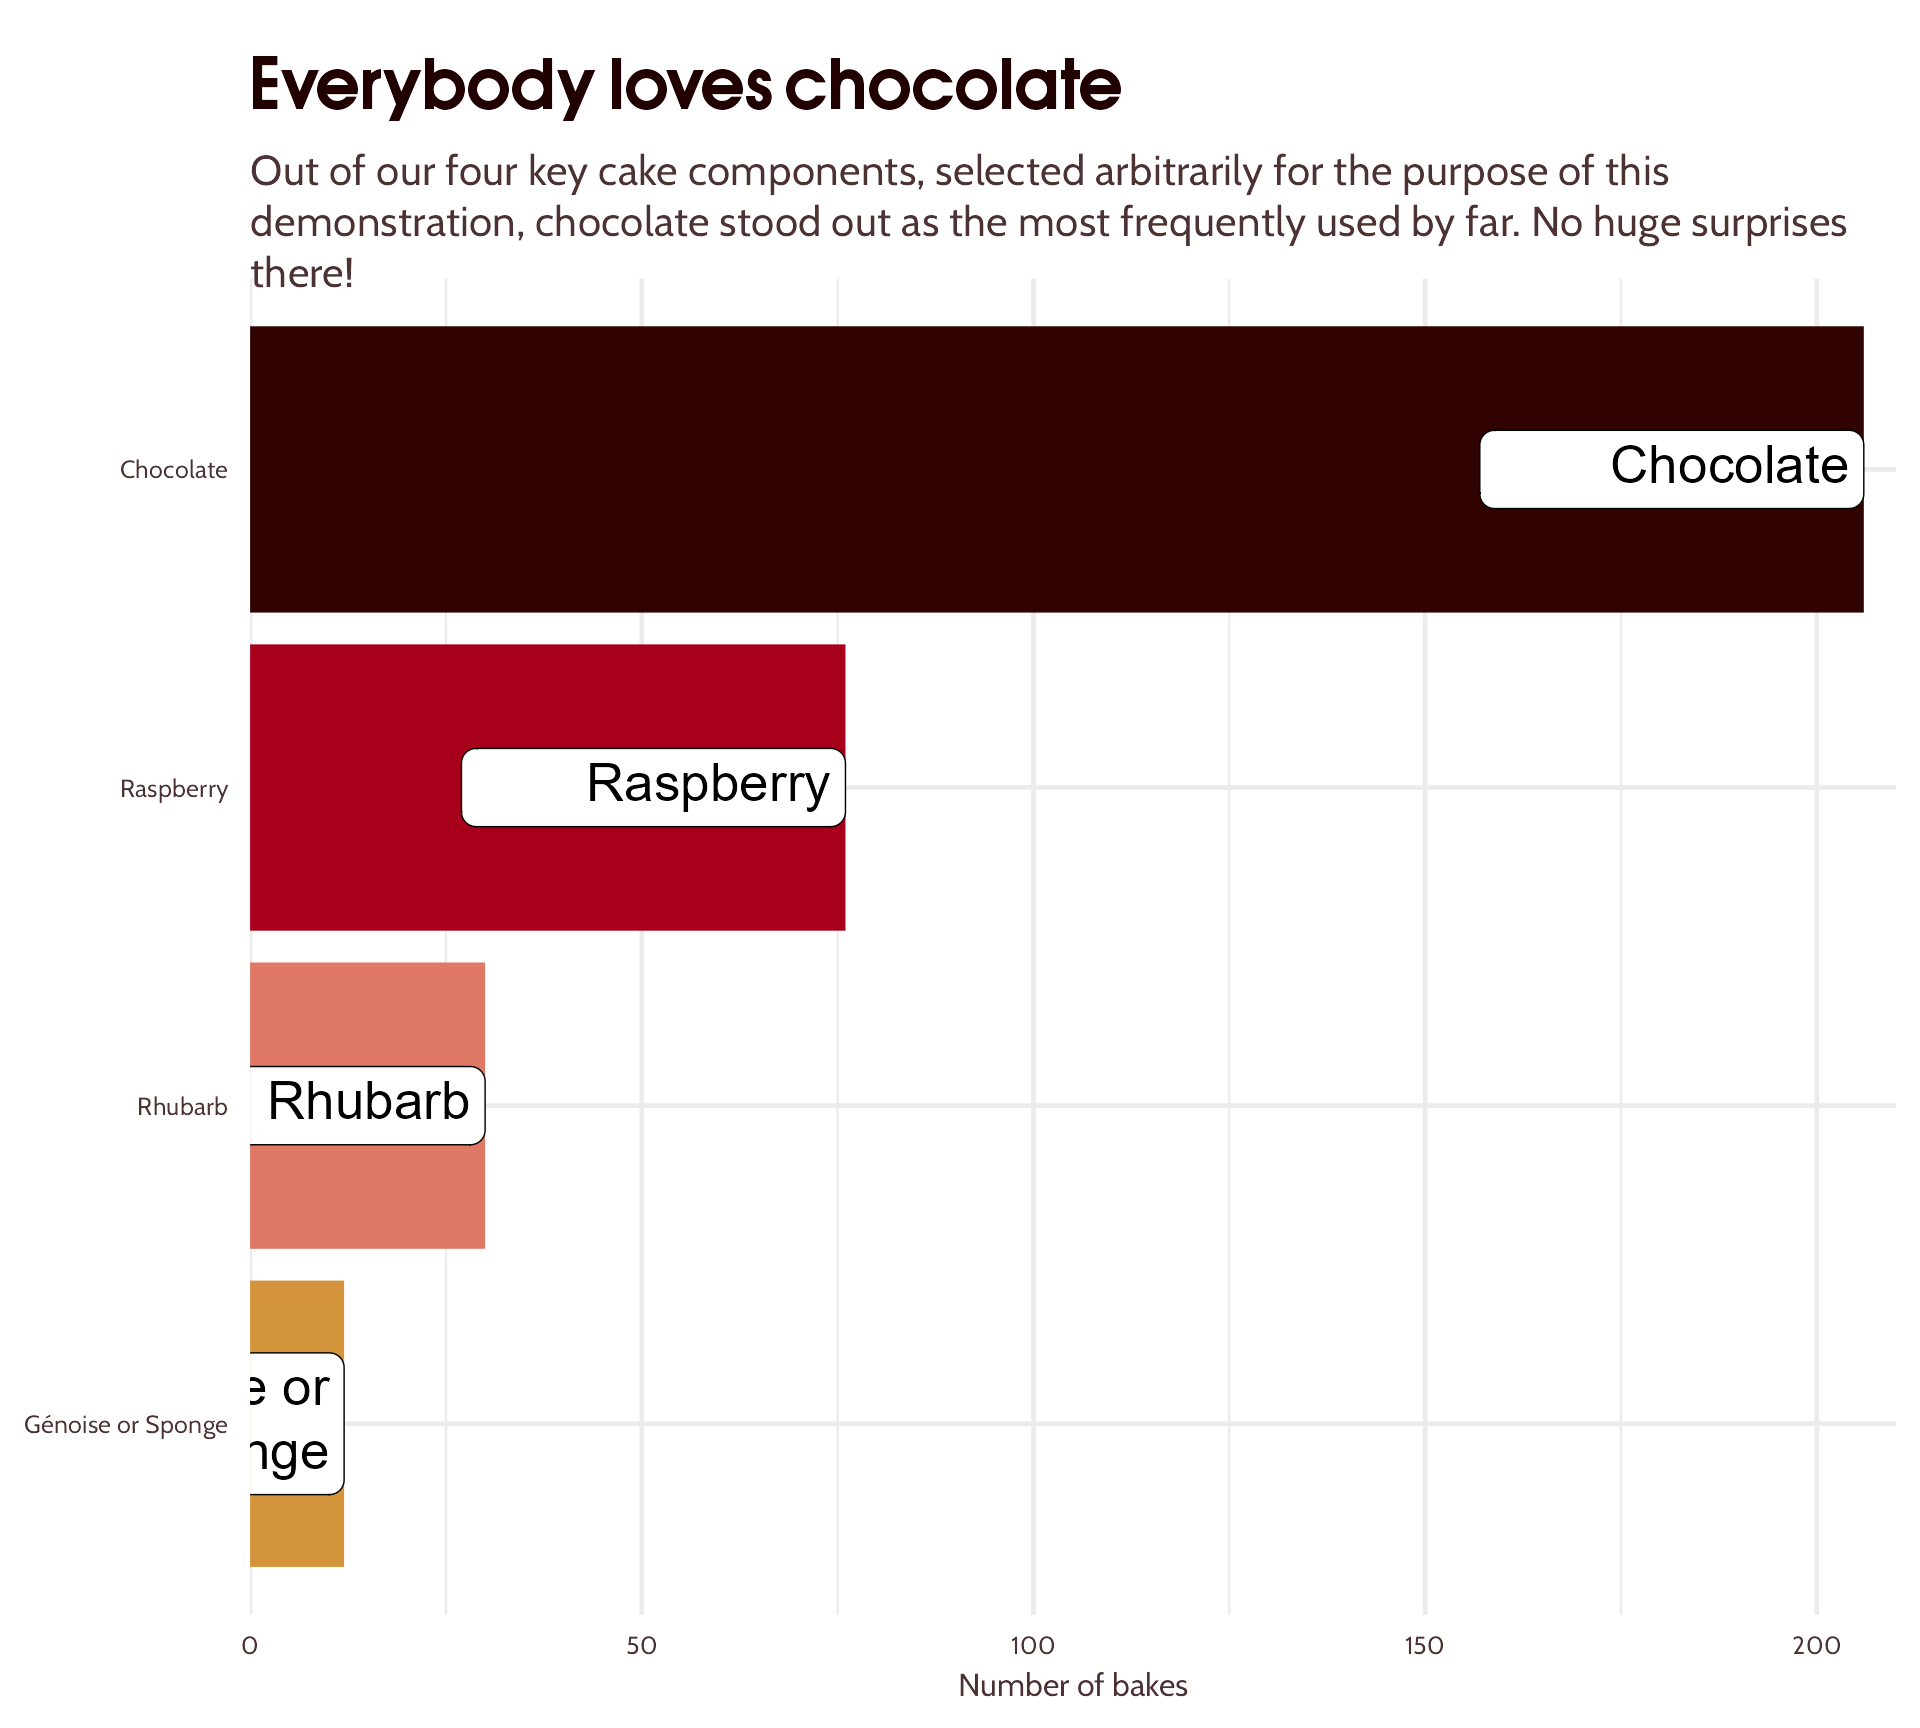
#3 Reduce unnecessary eye movement
Bring in our fonts and colours
bar_plot_text_hierarchy +
scale_y_continuous(expand = expansion(c(0, 0.02))) +
ggtext::geom_textbox(aes(label = component,
hjust = case_when(count < 50 ~ 0,
TRUE ~ 1),
halign = case_when(count < 50 ~ 0,
TRUE ~ 1),
colour = case_when(count < 50 ~ "#4C3232",
TRUE ~ "white")),
fill = NA,
box.colour = NA,
family = "Cabin",
size = 7,
fontface = "bold") +
scale_colour_identity()
#3 Reduce unnecessary eye movement
Do we need that text?
bar_plot_text_hierarchy +
scale_y_continuous(expand = expansion(c(0, 0.02))) +
ggtext::geom_textbox(aes(label = component,
hjust = case_when(count < 50 ~ 0,
TRUE ~ 1),
halign = case_when(count < 50 ~ 0,
TRUE ~ 1),
colour = case_when(count < 50 ~ "#4C3232",
TRUE ~ "white")),
fill = NA,
box.colour = NA,
family = "Cabin",
size = 7,
fontface = "bold") +
scale_colour_identity() +
theme(axis.text.y = element_blank())
#3 Reduce unnecessary eye movement
Could we make our labels more informative?
bar_plot_text_hierarchy +
scale_y_continuous(expand = expansion(c(0, 0.02))) +
ggtext::geom_textbox(aes(label = paste0(component,
"<br><span style='font-size:32pt'>",
count,
"</span>"),
hjust = case_when(count < 50 ~ 0,
TRUE ~ 1),
halign = case_when(count < 50 ~ 0,
TRUE ~ 1),
colour = case_when(count < 50 ~ "#4C3232",
TRUE ~ "white")),
fill = NA,
box.colour = NA,
family = "Cabin",
size = 7,
fontface = "bold") +
scale_colour_identity() +
theme(axis.text.y = element_blank())
#3 Reduce unnecessary eye movement
Alignment tweak
bar_plot_text_hierarchy +
scale_y_continuous(expand = expansion(c(0, 0.02))) +
ggtext::geom_textbox(aes(label = paste0(component,
"<span style='font-size:32pt'><br>",
count,
"</span>"),
hjust = case_when(count < 50 ~ 0,
TRUE ~ 1),
halign = case_when(count < 50 ~ 0,
TRUE ~ 1),
colour = case_when(count < 50 ~ "#4C3232",
TRUE ~ "white")),
vjust = 0.45,
fill = NA,
box.colour = NA,
family = "Cabin",
size = 7,
fontface = "bold") +
scale_colour_identity() +
theme(axis.text.y = element_blank())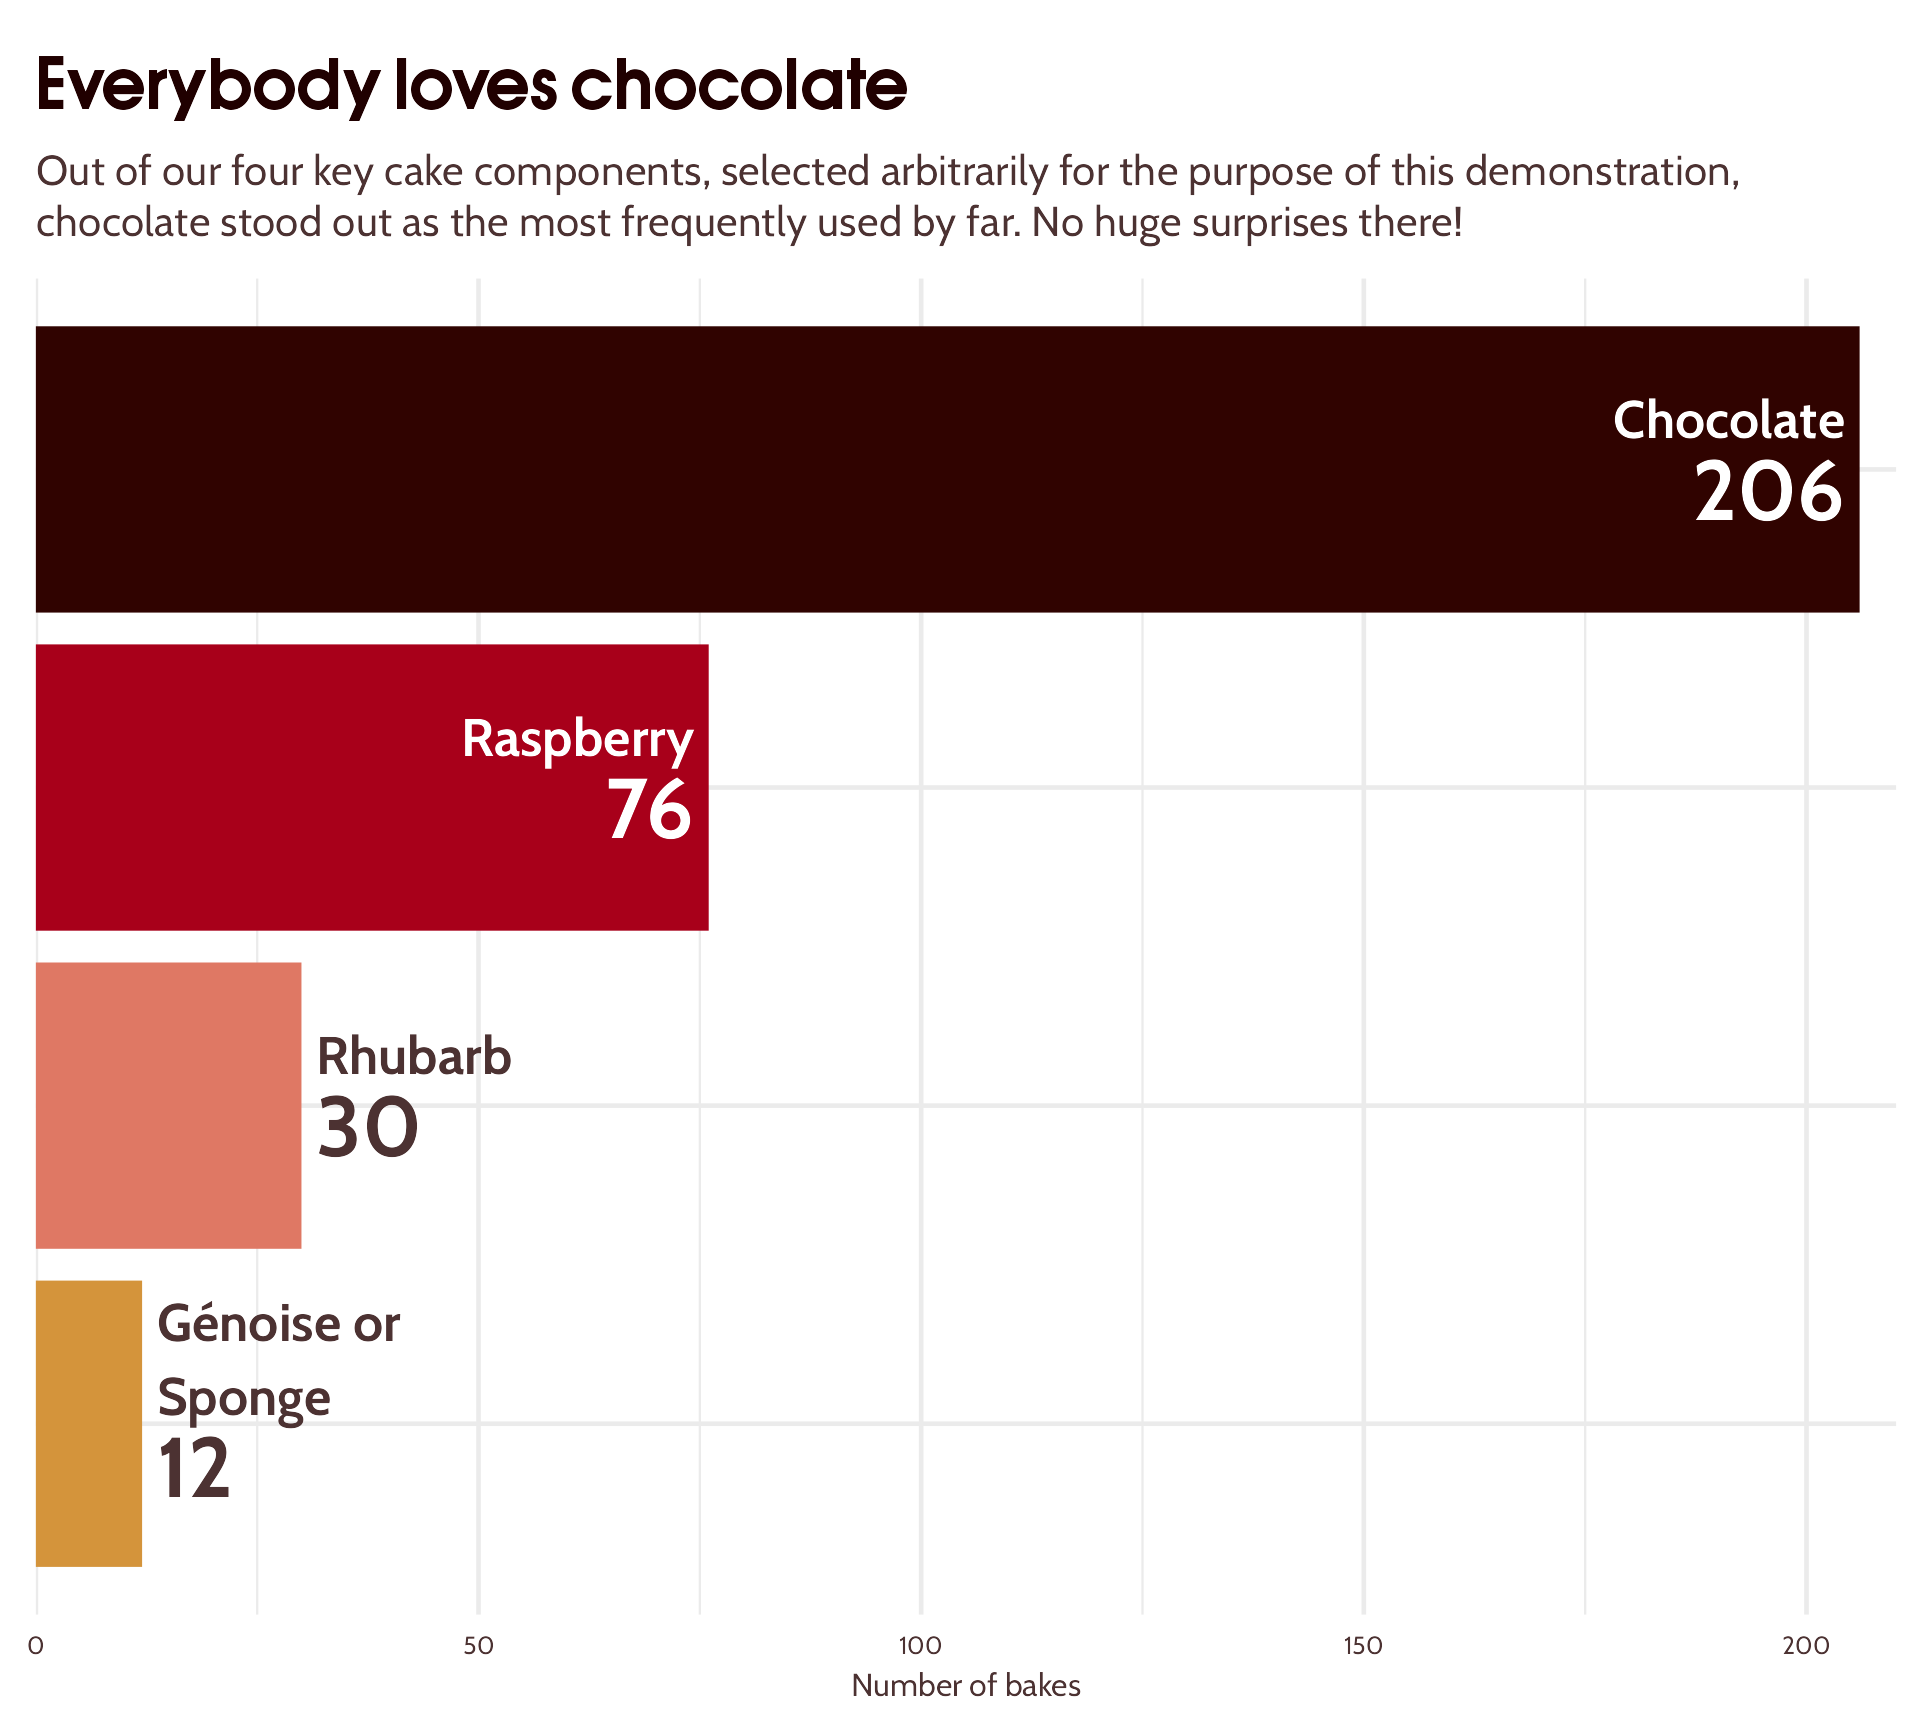
#3 Reduce unnecessary eye movement
Do we need the rest of this?
bar_plot_text_hierarchy +
scale_y_continuous(expand = expansion(c(0, 0.02))) +
ggtext::geom_textbox(aes(label = paste0(component,
" bakes<span style='font-size:32pt'><br>",
count,
"</span>"),
hjust = case_when(count < 50 ~ 0,
TRUE ~ 1),
halign = case_when(count < 50 ~ 0,
TRUE ~ 1),
colour = case_when(count < 50 ~ "#4C3232",
TRUE ~ "white")),
vjust = 0.45,
fill = NA,
box.colour = NA,
family = "Cabin",
size = 7,
fontface = "bold") +
scale_colour_identity() +
theme(axis.text.y = element_blank(),
axis.text.x = element_blank(),
axis.title.x = element_blank(),
panel.grid = element_blank())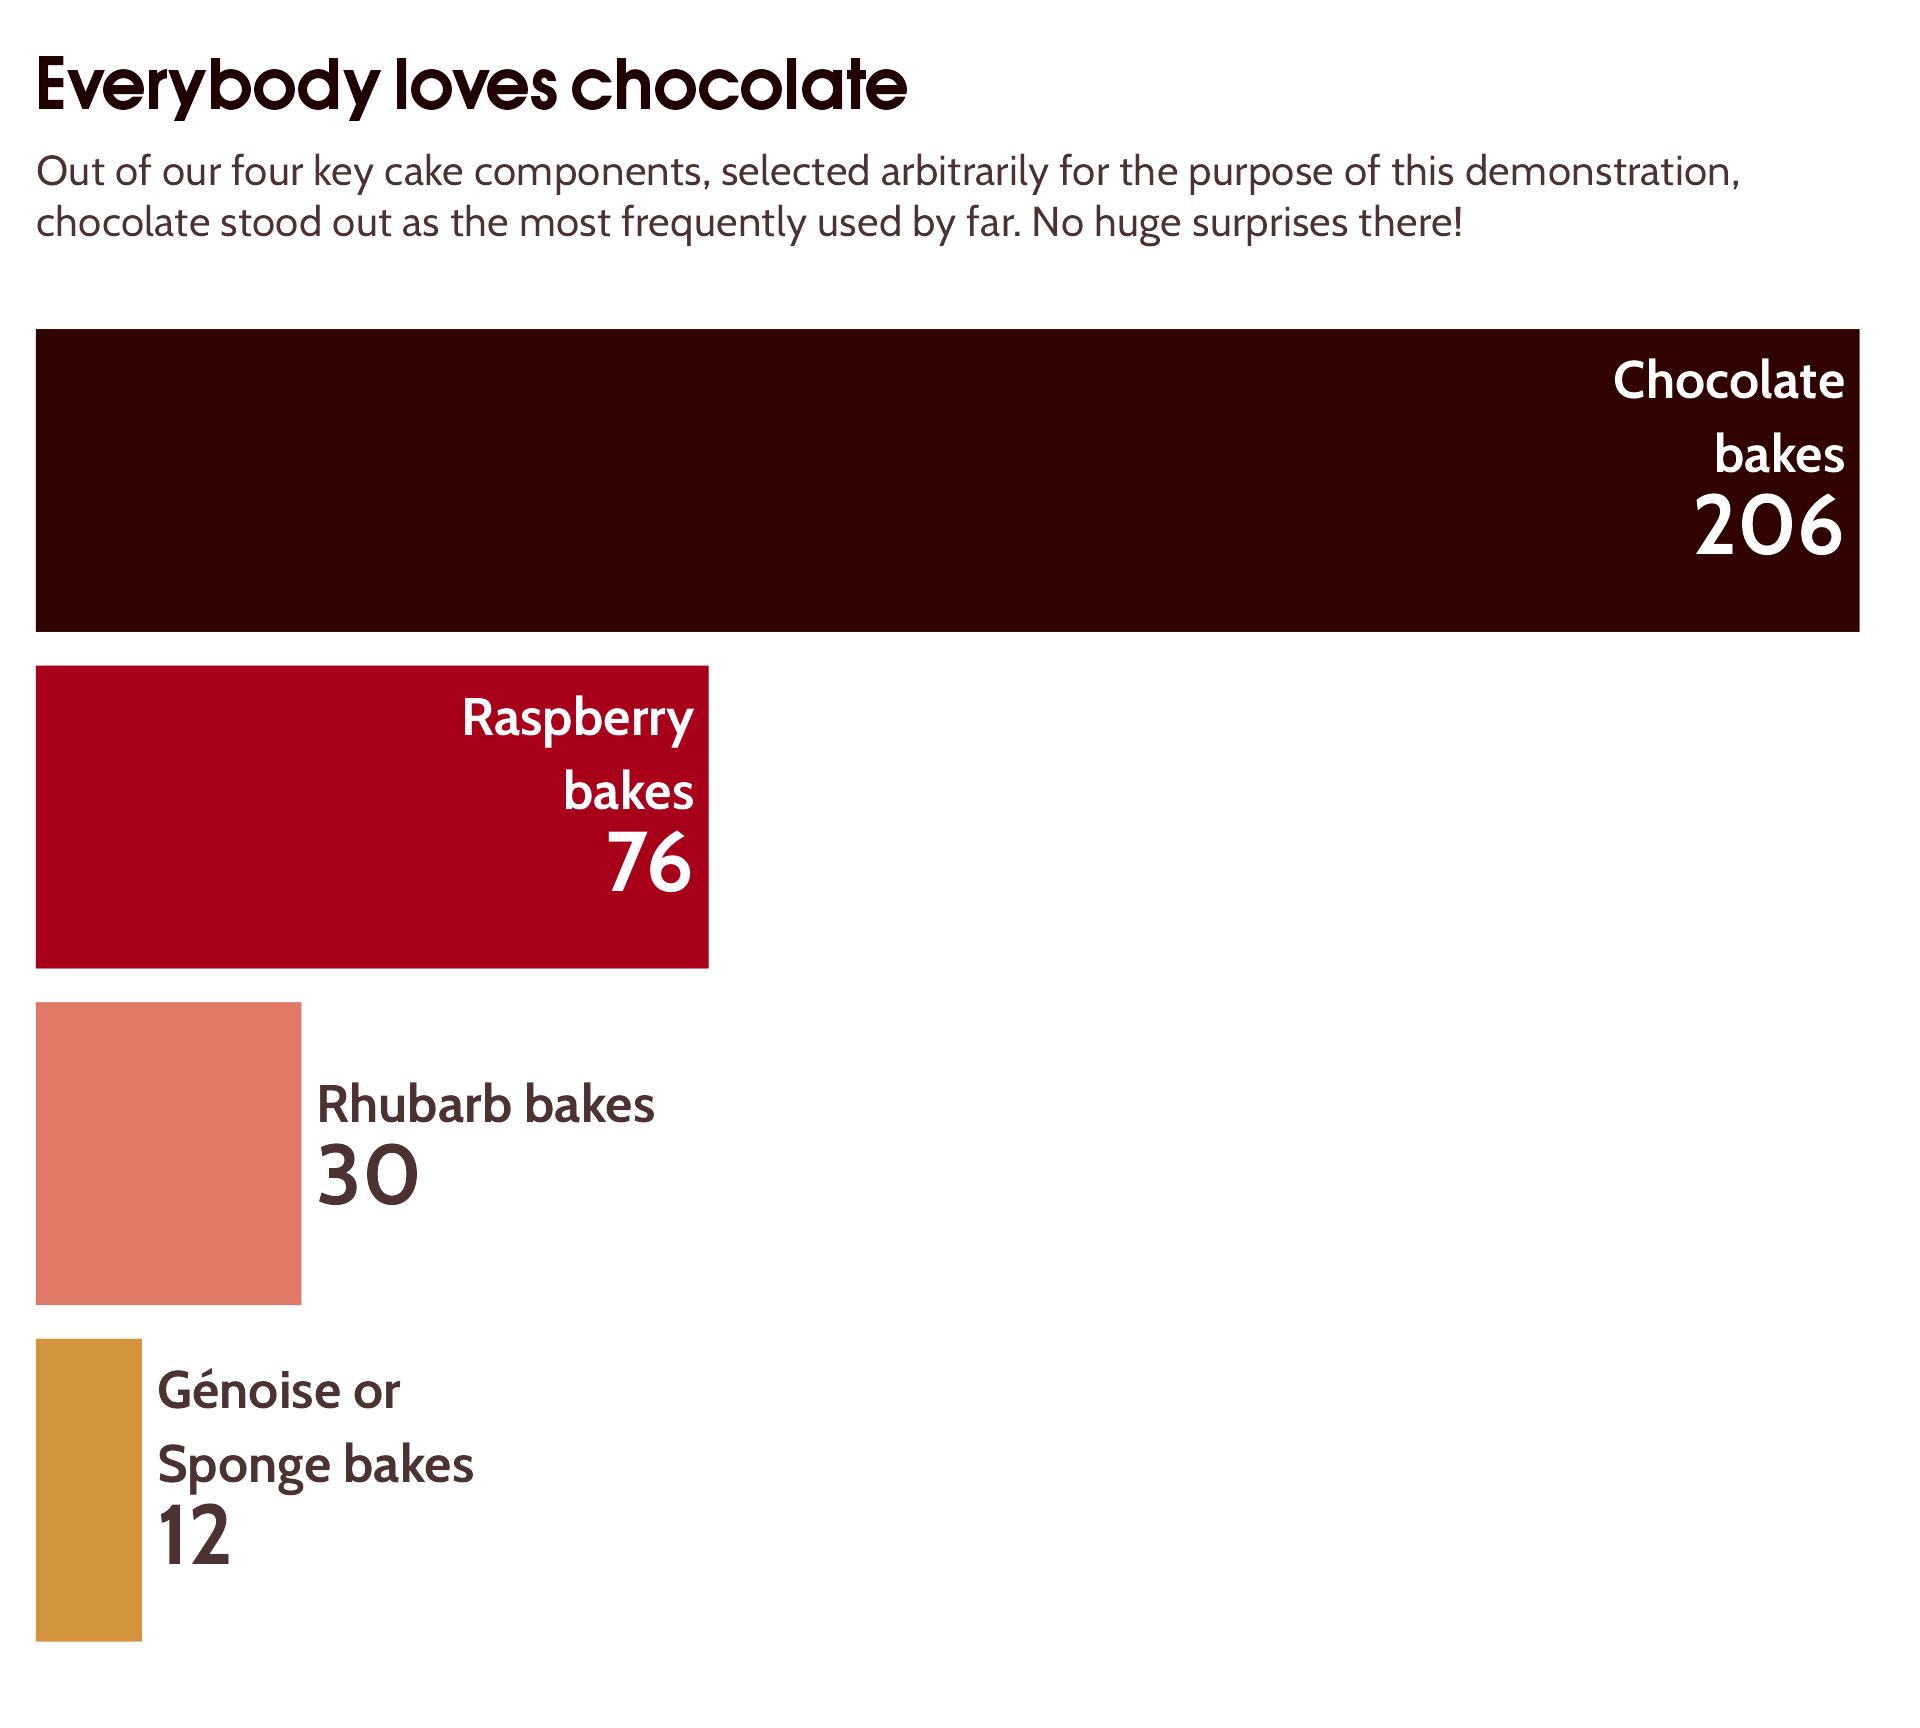
#3 Reduce unnecessary eye movement
How would I actually say that?
bar_plot_text_hierarchy +
scale_y_continuous(expand = expansion(c(0, 0.02))) +
ggtext::geom_textbox(aes(label = paste0("<span style='font-size:32pt'><br>",
count,
"<br></span>",
component, " bakes"),
hjust = case_when(count < 50 ~ 0,
TRUE ~ 1),
halign = case_when(count < 50 ~ 0,
TRUE ~ 1),
colour = case_when(count < 50 ~ "#4C3232",
TRUE ~ "white")),
vjust = 0.45,
fill = NA,
box.colour = NA,
family = "Cabin",
size = 7,
fontface = "bold") +
scale_colour_identity() +
theme(axis.text.y = element_blank(),
plot.title.position = "plot",
axis.text.x = element_blank(),
axis.title.x = element_blank(),
panel.grid = element_blank())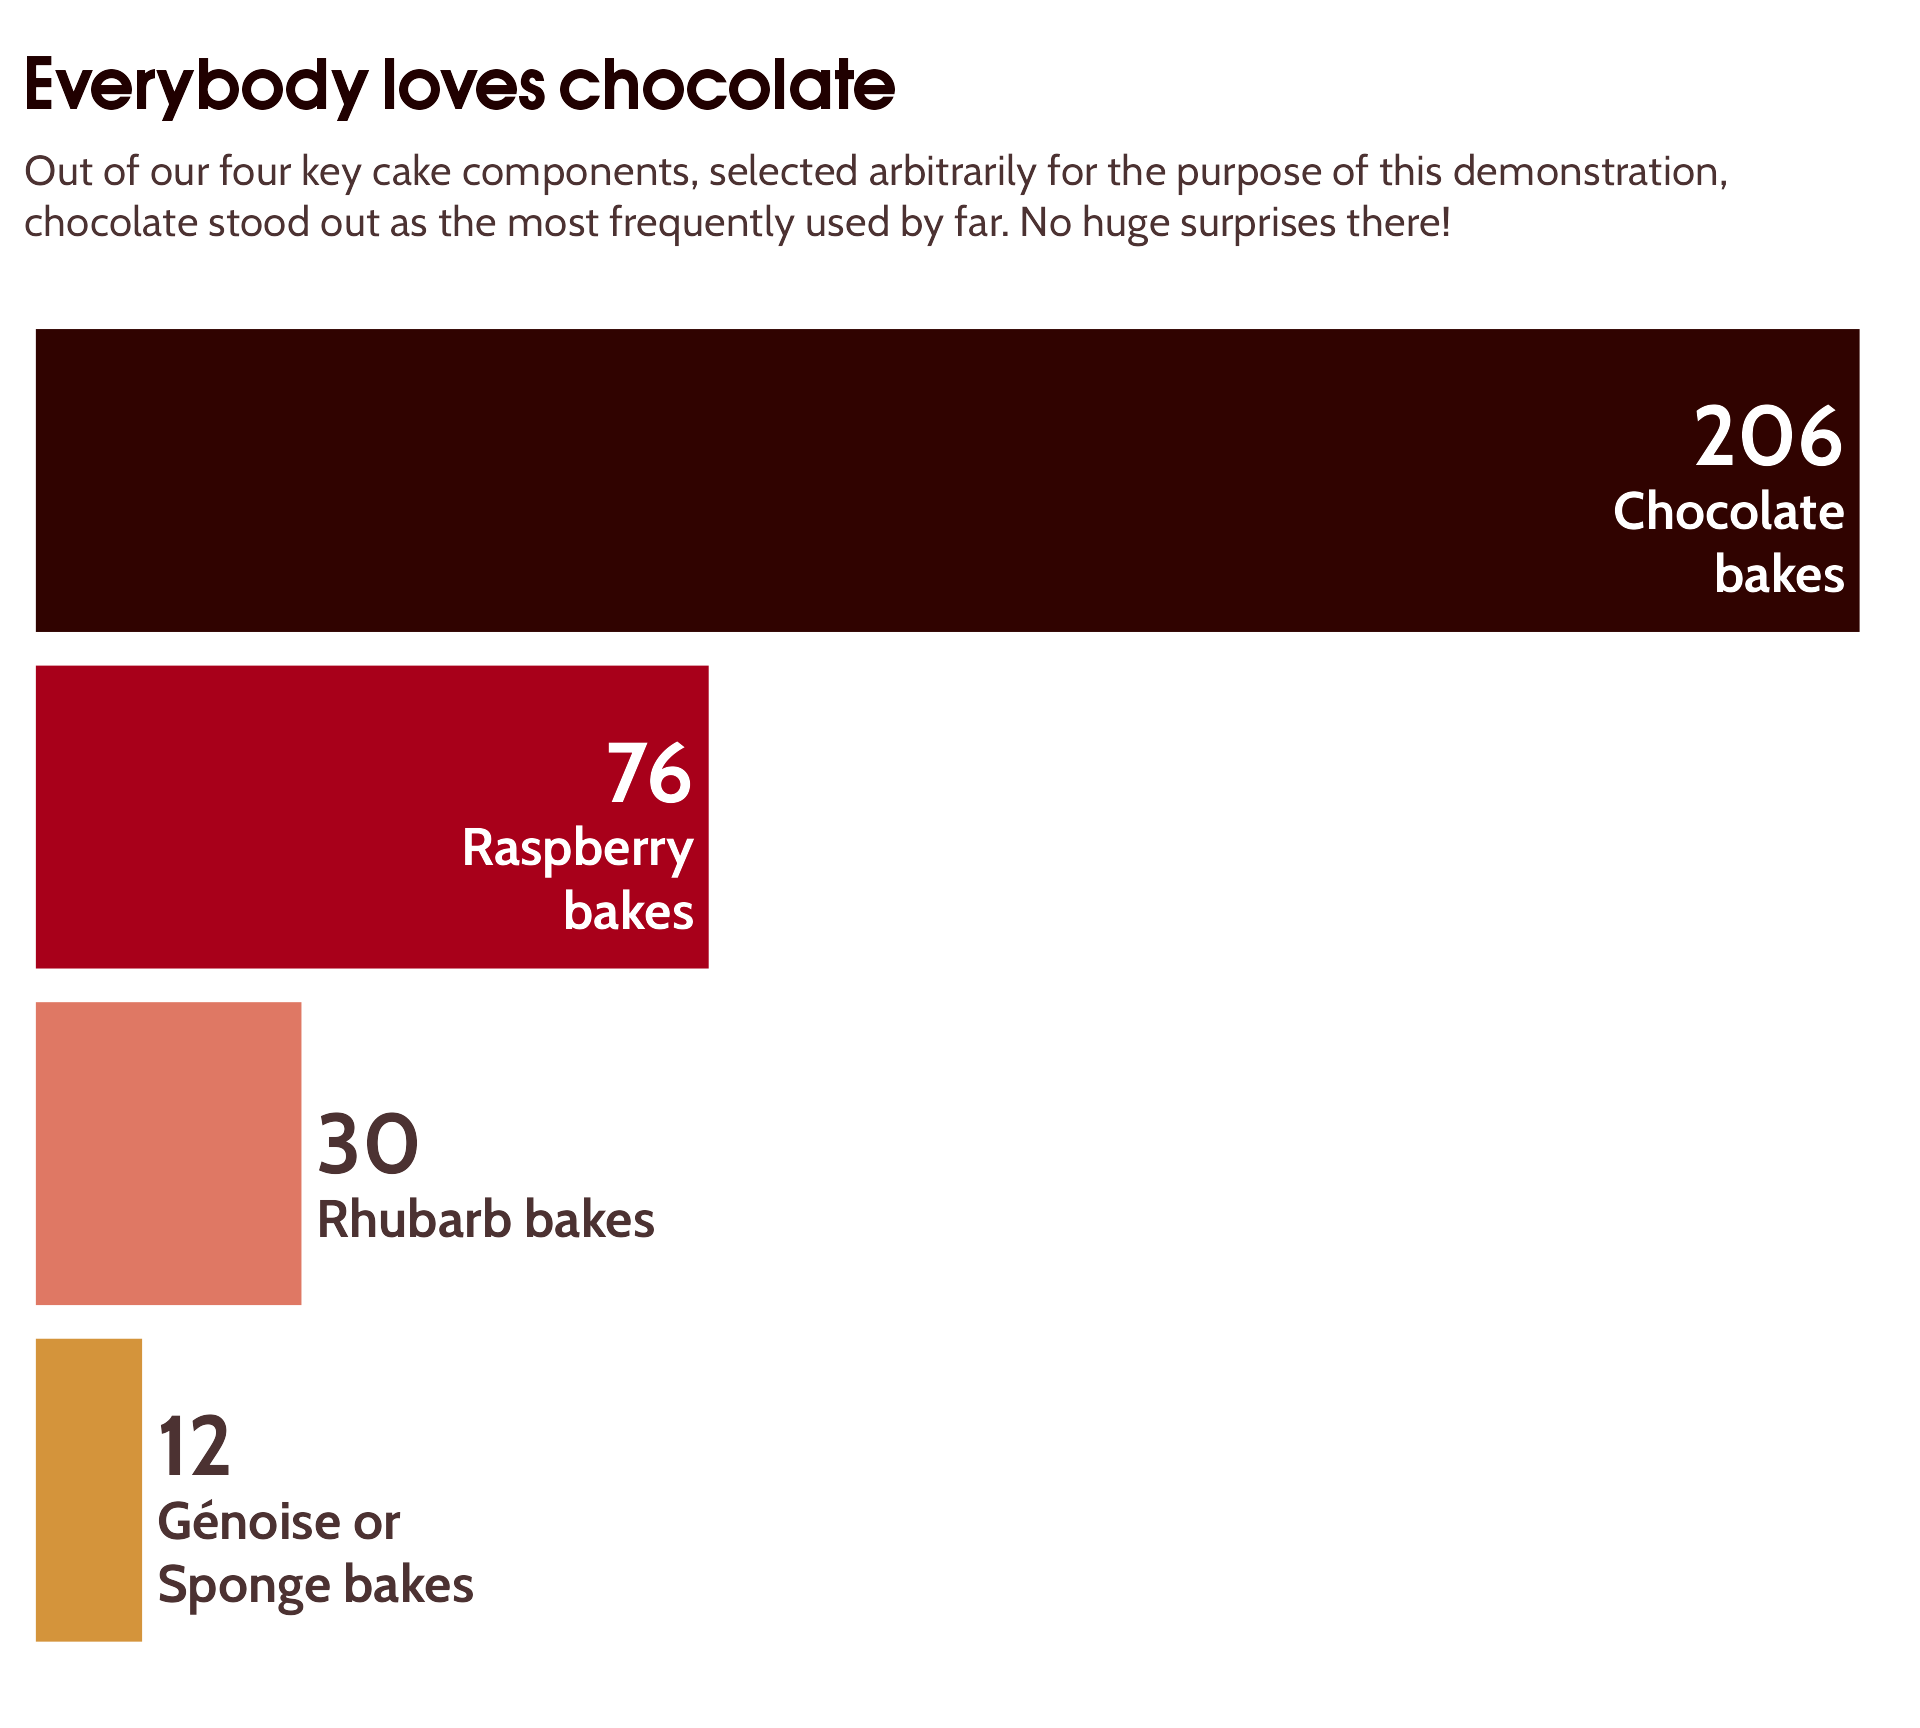
#3 Reduce unnecessary eye movement

#4 Declutter, declutter, declutter
#4 Declutter, declutter, declutter

#4 Declutter, declutter, declutter
#4 Declutter, declutter, declutter
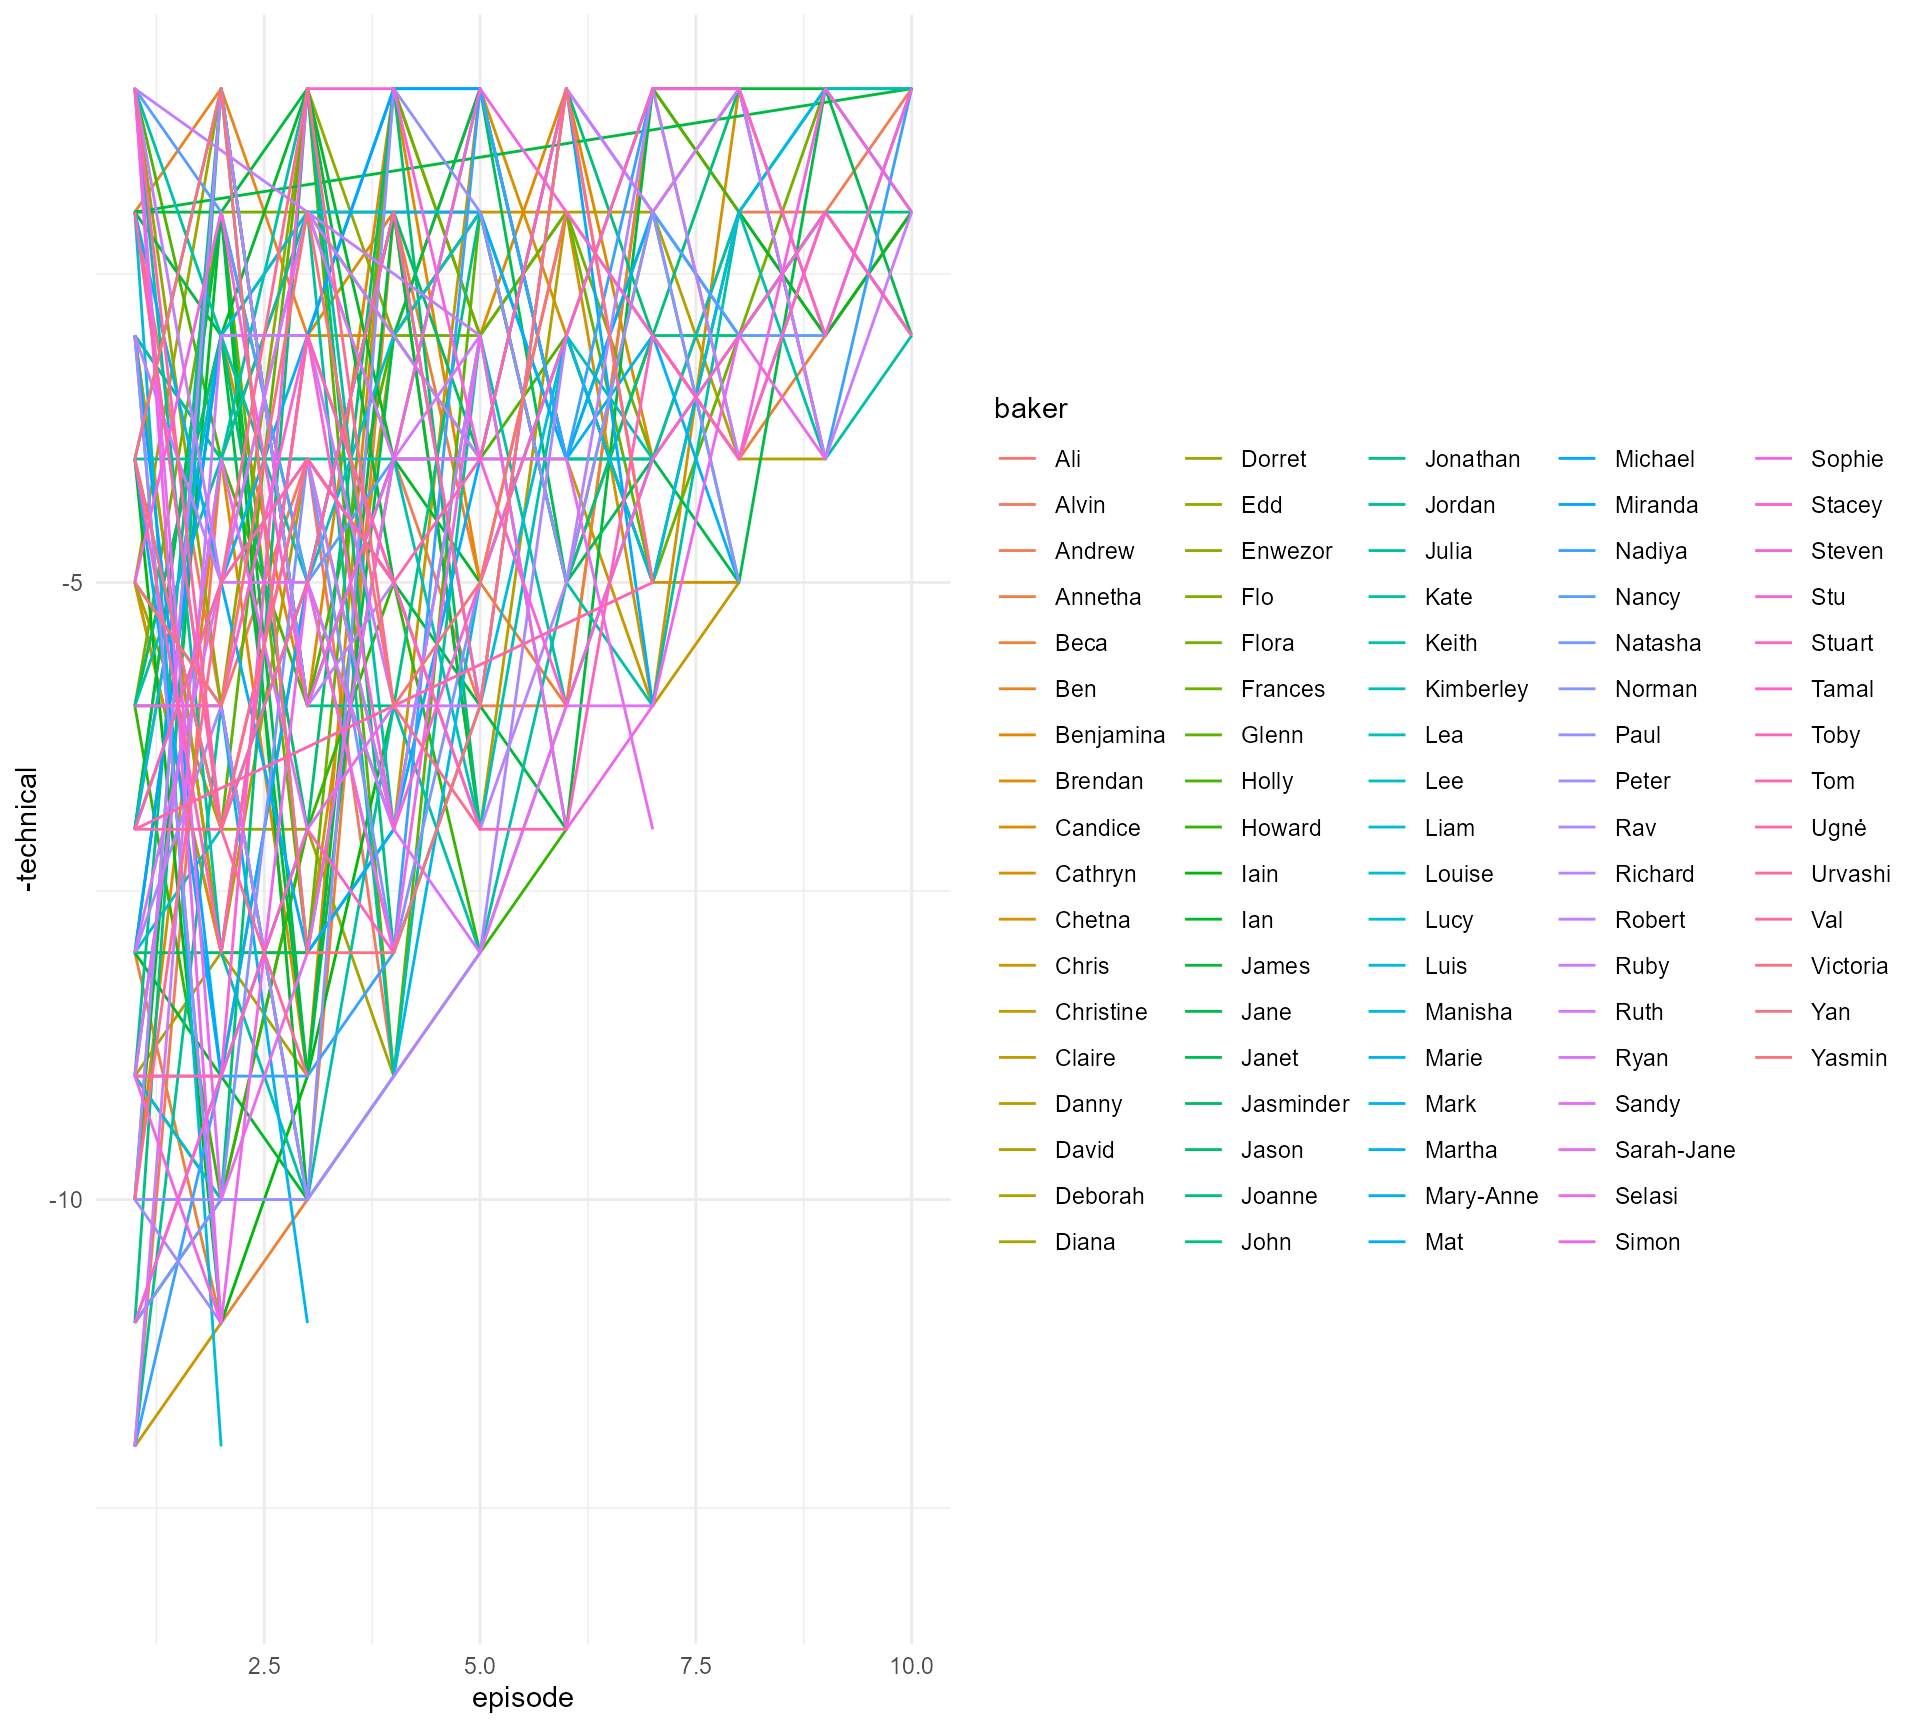
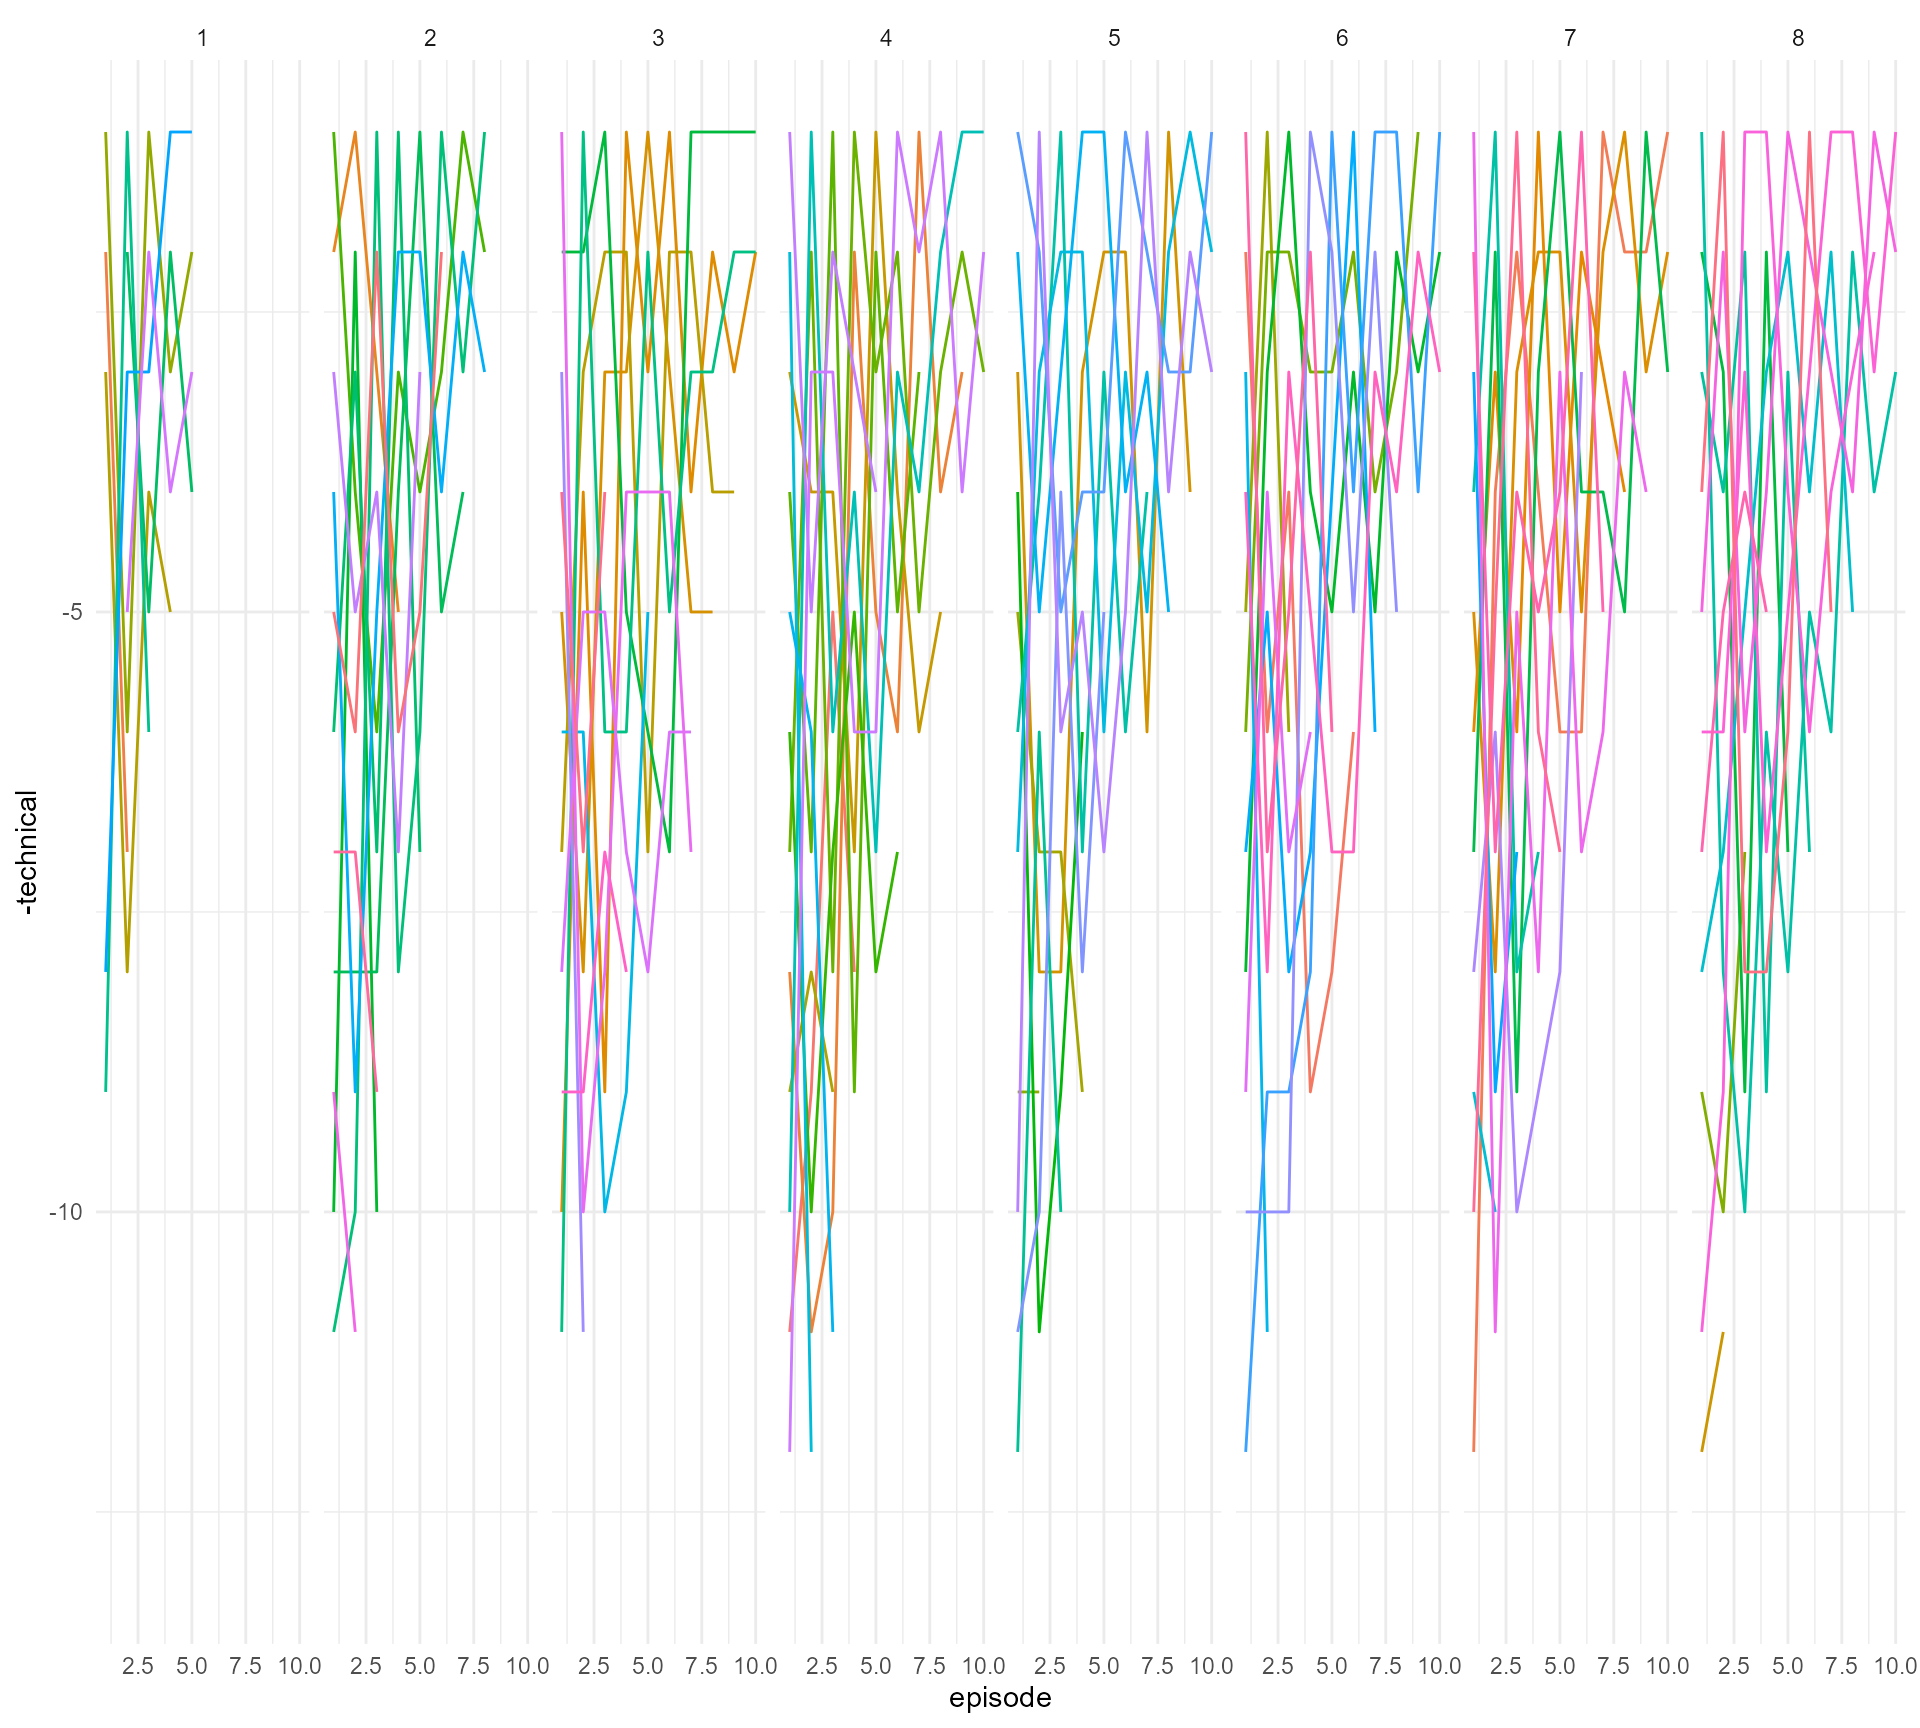
Try facets on less data?
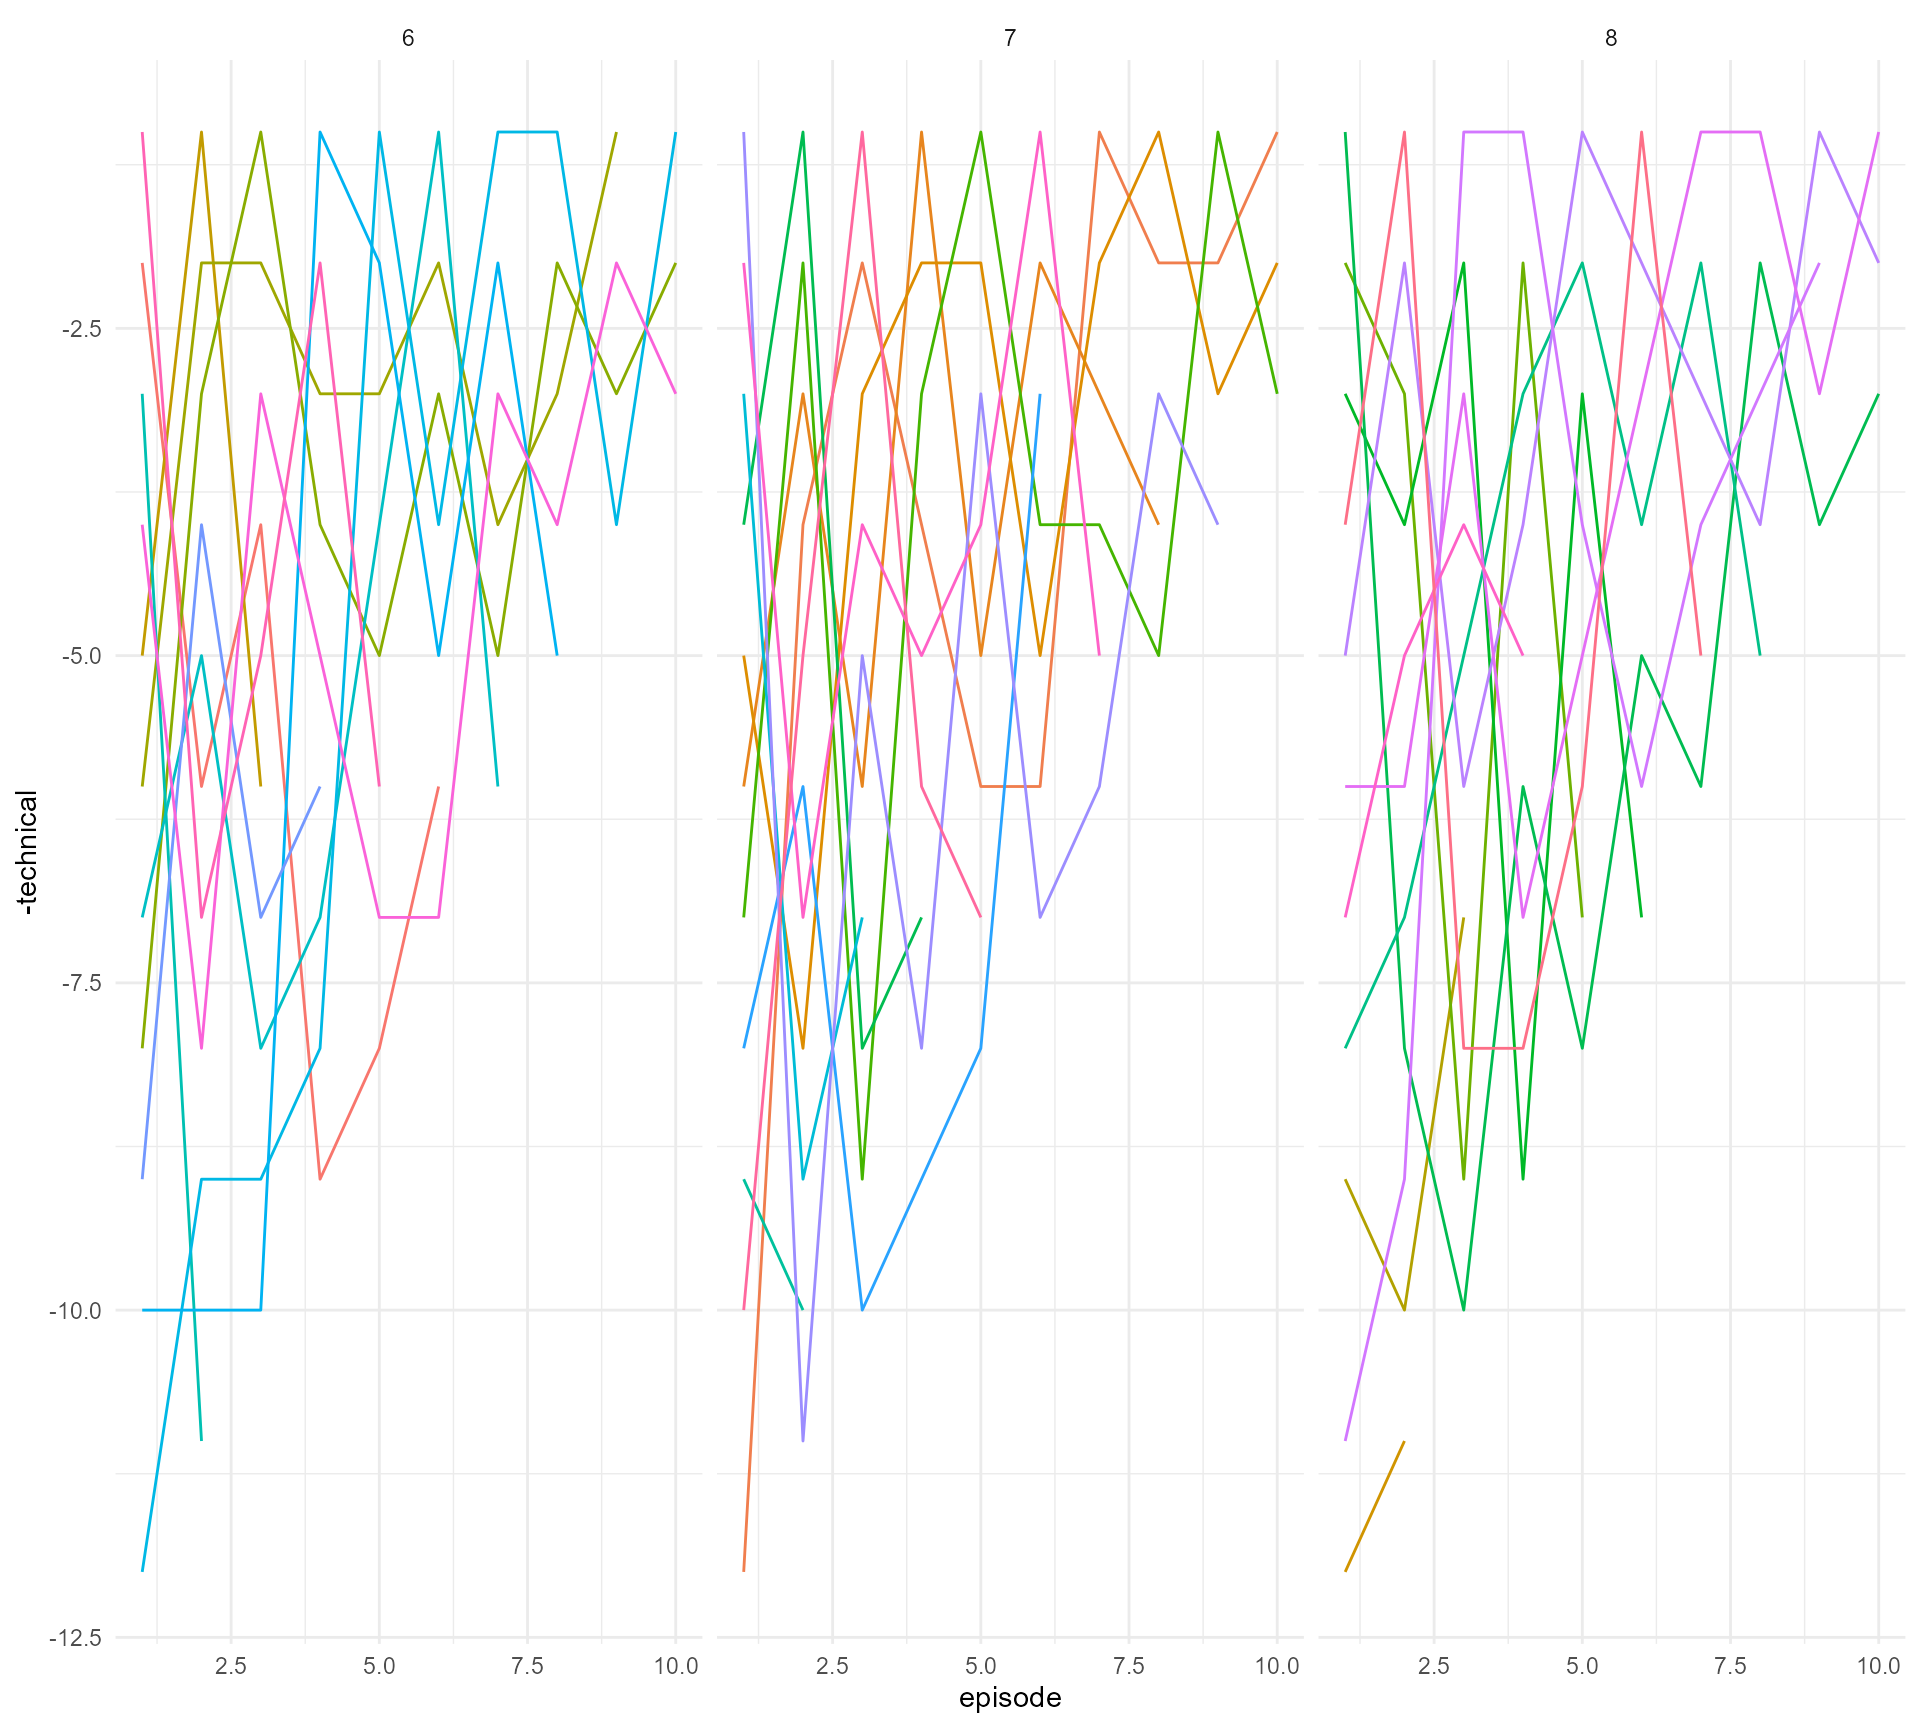
#4 Declutter, declutter, declutter
Enter {gghighlight}
bakeoff::bakes_raw %>%
filter(series %in% c(6:8)) %>%
left_join(bakeoff::bakers %>%
filter(series_winner == 1)) %>%
ggplot(aes(x = episode,
y = -technical)) +
geom_path(aes(colour = baker),
show.legend = FALSE) +
gghighlight::gghighlight(series_winner == 1) +
facet_grid(. ~ series) +
theme_minimal()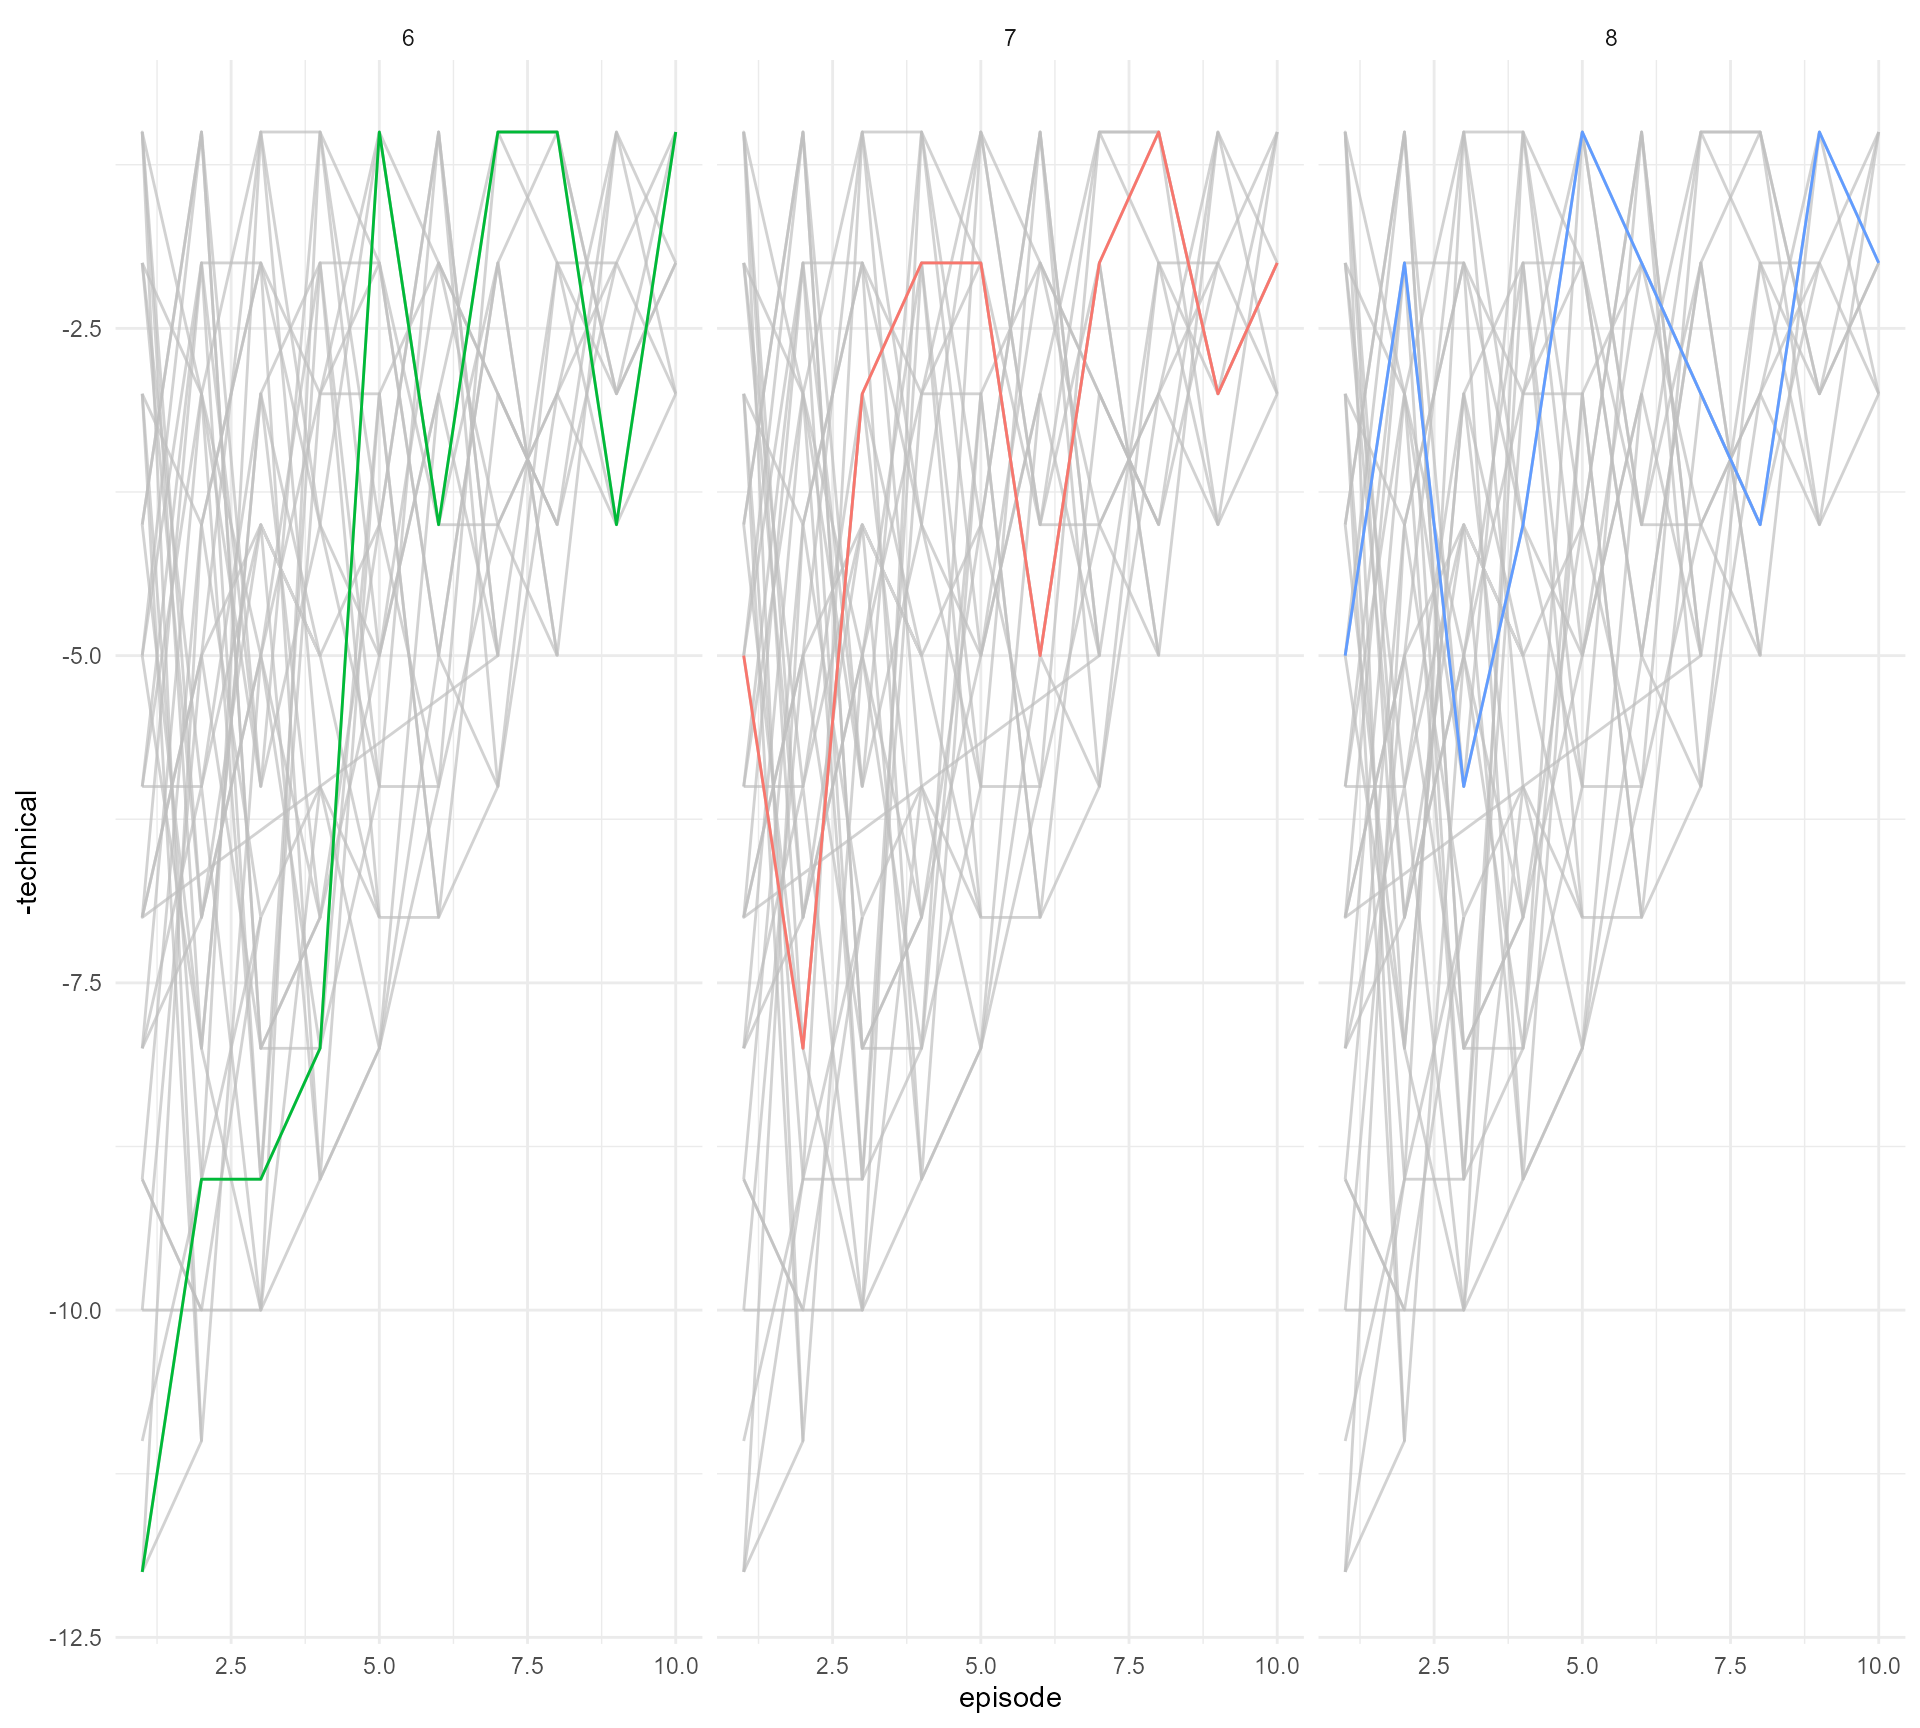
#4 Declutter, declutter, declutter
Enter {gghighlight} - calculate_per_facet
bakeoff::bakes_raw %>%
filter(series %in% c(6:8)) %>%
left_join(bakeoff::bakers %>%
filter(series_winner == 1)) %>%
ggplot(aes(x = episode,
y = -technical)) +
geom_path(aes(colour = baker),
show.legend = FALSE) +
gghighlight::gghighlight(series_winner == 1,
calculate_per_facet = TRUE) +
facet_grid(. ~ series) +
theme_minimal()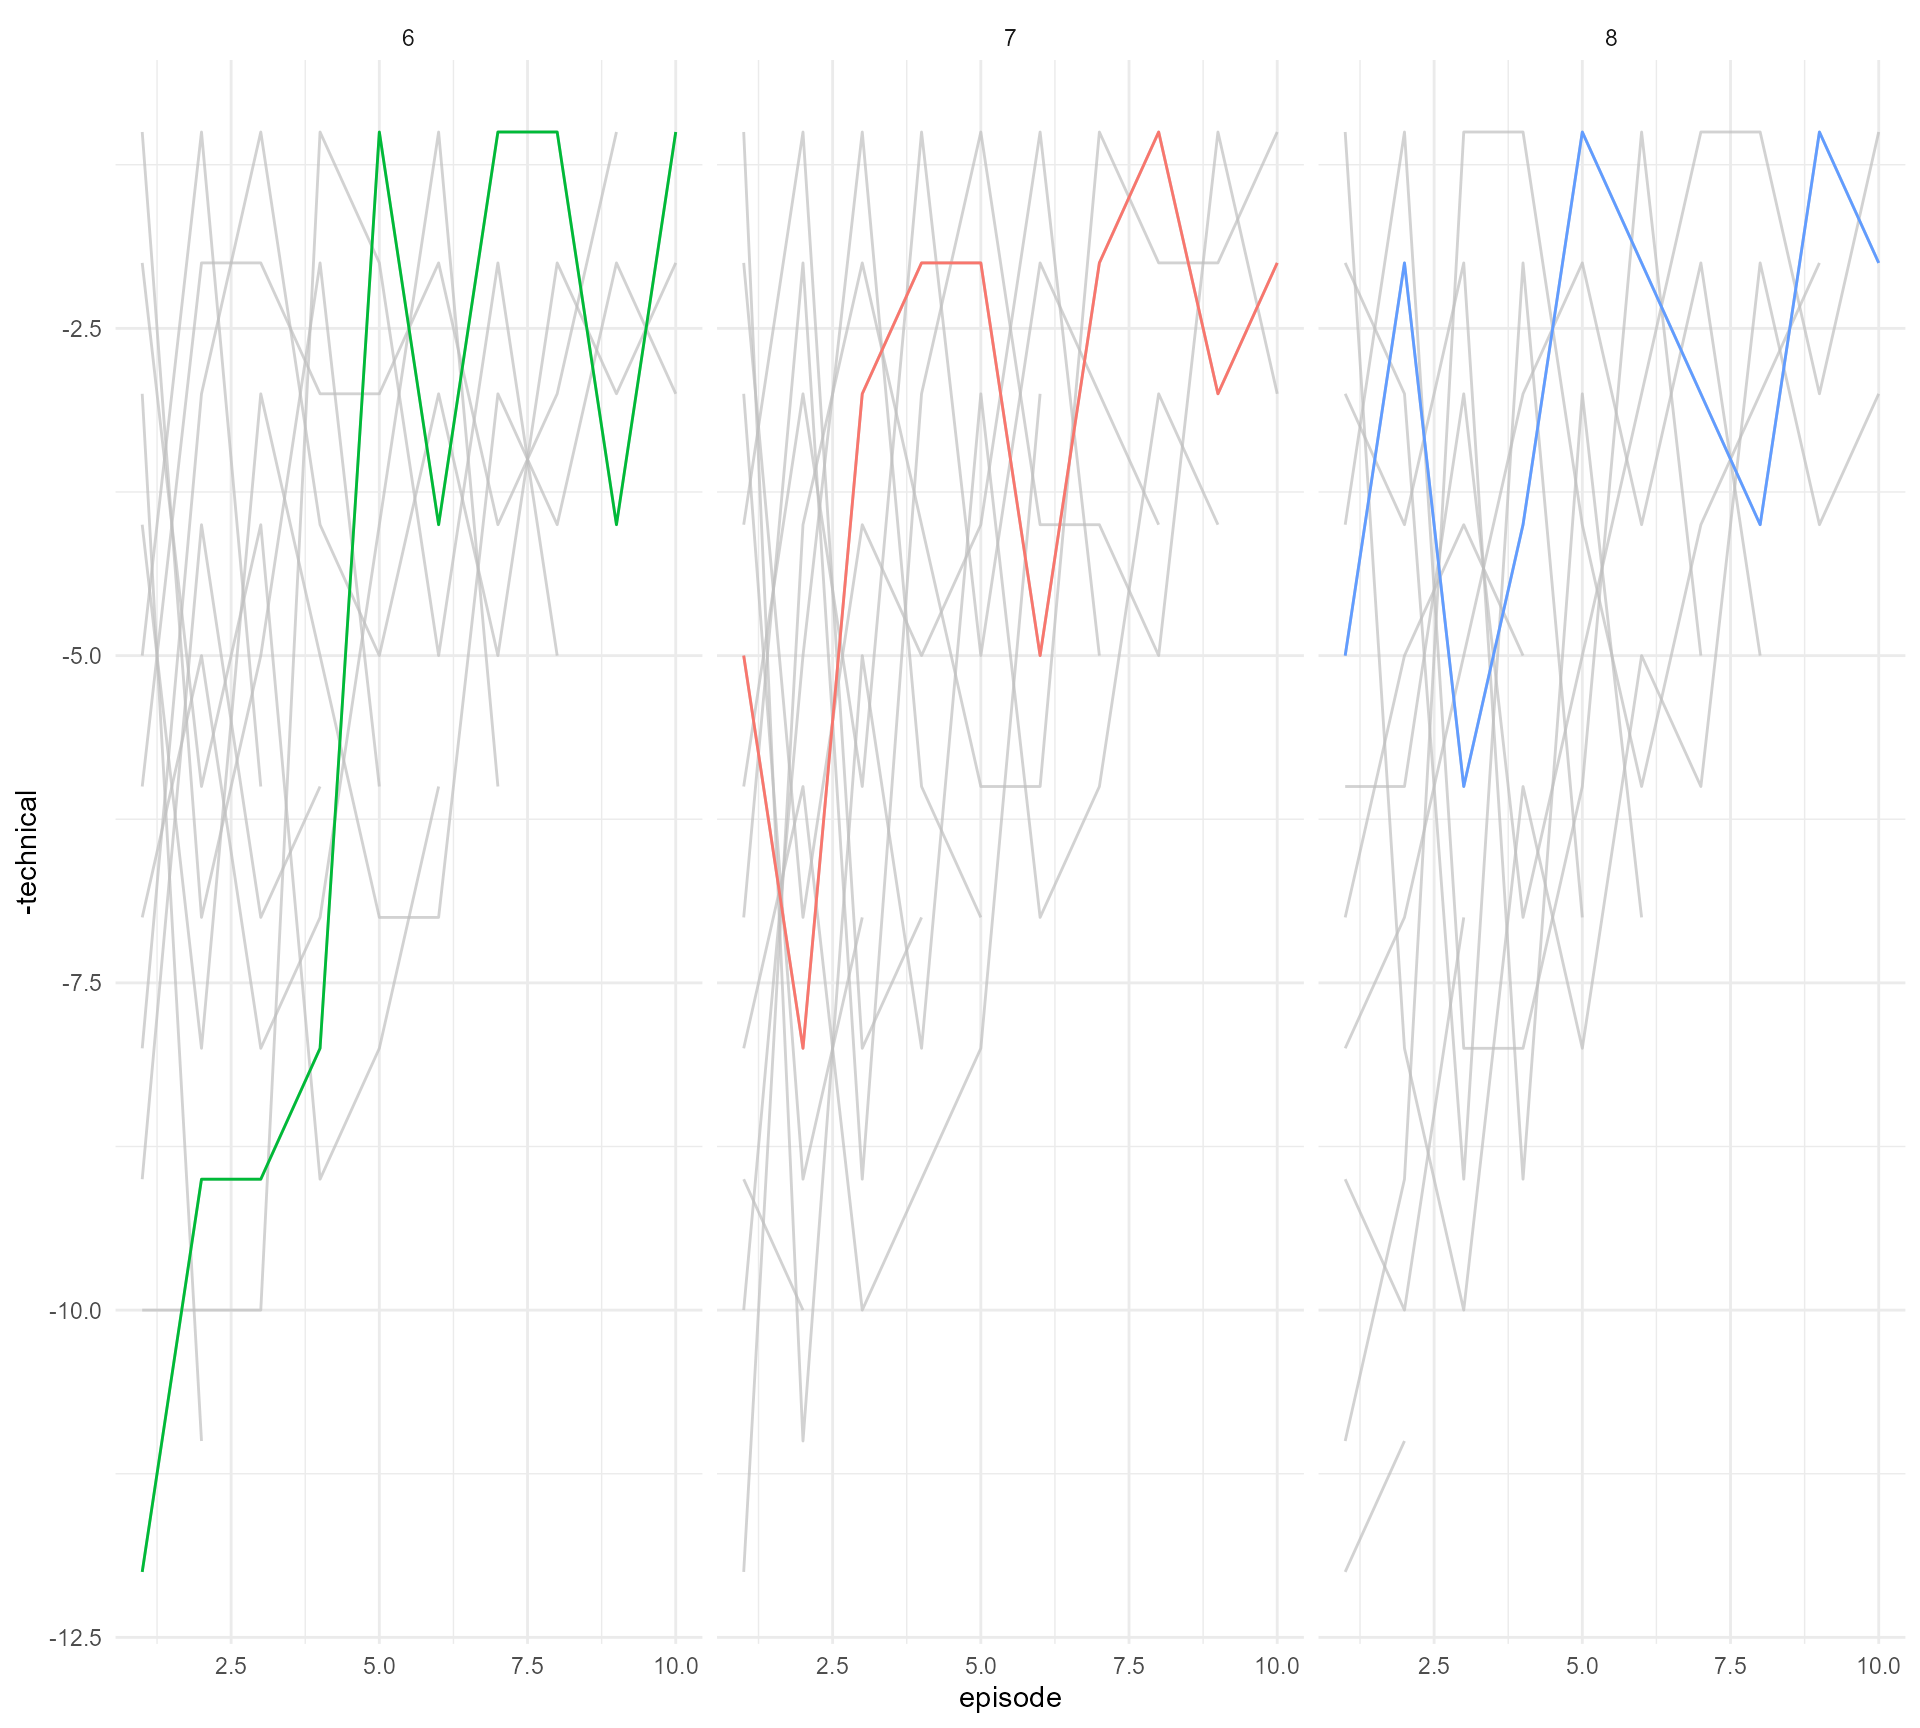
#4 Declutter, declutter, declutter
Enter {gghighlight} - calculate_per_facet
bakeoff::bakes_raw %>%
filter(series %in% c(6:8)) %>%
left_join(bakeoff::bakers %>%
filter(series_winner == 1)) %>%
ggplot(aes(x = episode,
y = -technical)) +
geom_path(aes(colour = series),
show.legend = FALSE) +
gghighlight::gghighlight(series_winner == 1,
calculate_per_facet = TRUE) +
scale_colour_gradient2(low = "#e04121", mid = "#f7238a",
high = "#ed9e00", midpoint = 7) +
facet_grid(. ~ series) +
theme_minimal()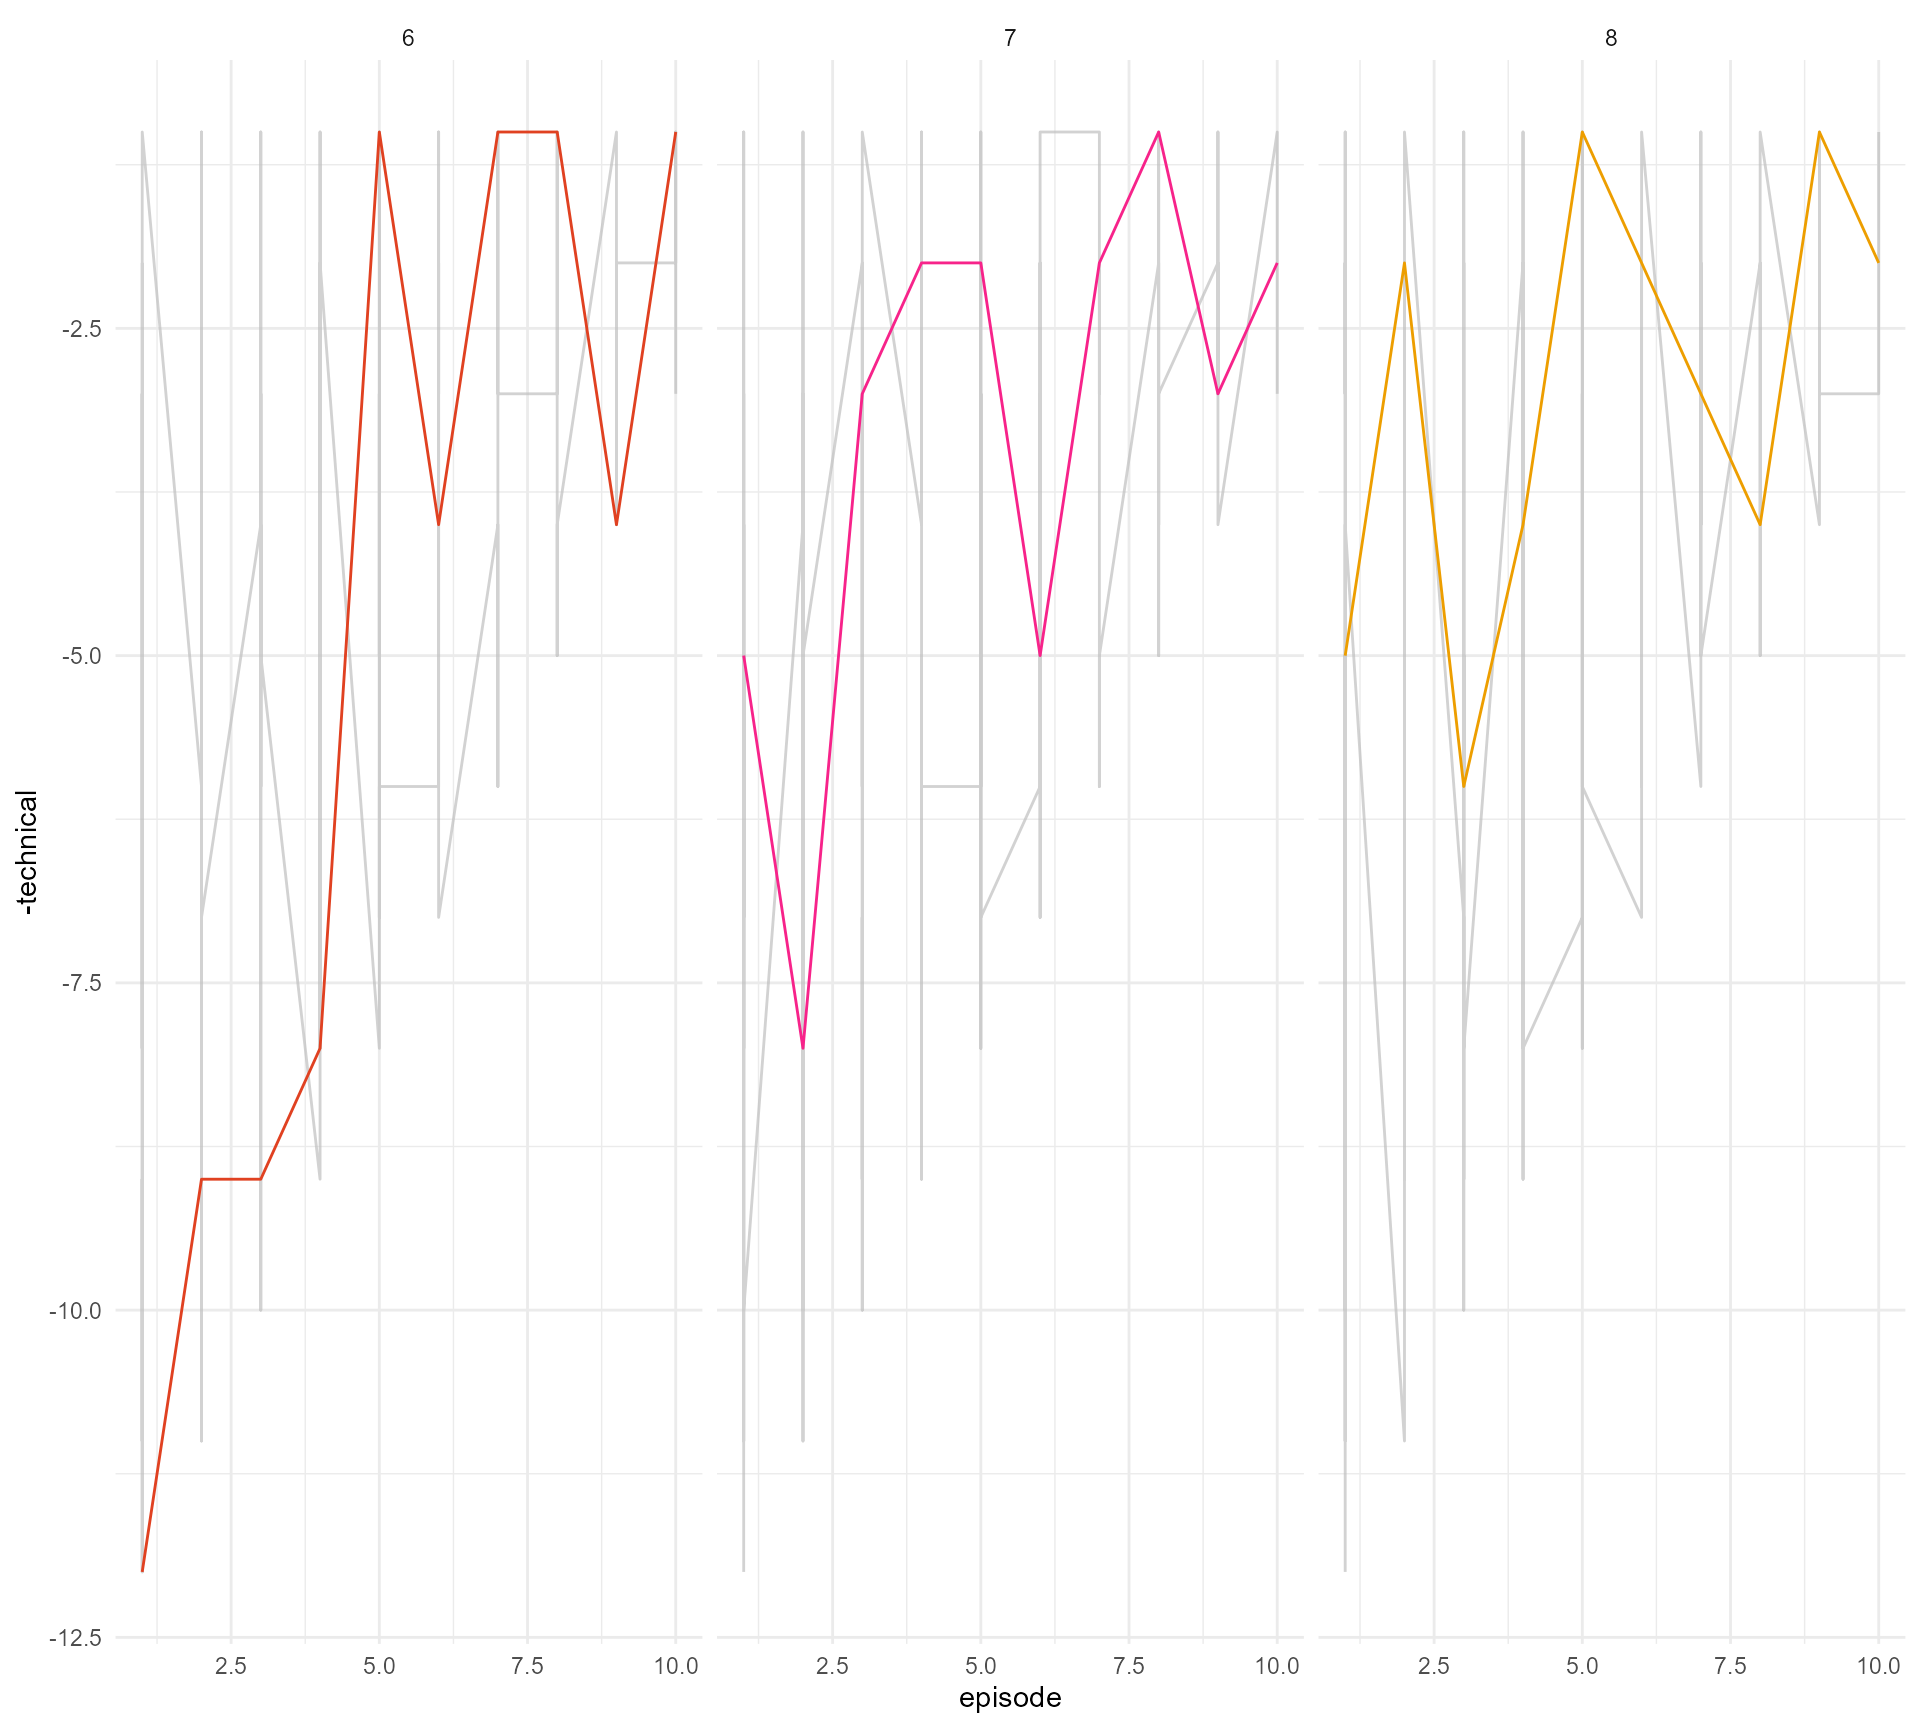
#4 Declutter, declutter, declutter
I ❤️ {geomtextpath}
bakeoff::bakes_raw %>%
filter(series %in% c(6:8)) %>%
left_join(bakeoff::bakers %>%
filter(series_winner == 1)) %>%
ggplot(aes(x = episode,
y = -technical)) +
geom_path(aes(colour = series),
show.legend = FALSE) +
gghighlight::gghighlight(series_winner == 1,
calculate_per_facet = TRUE) +
scale_colour_gradient2(low = "#e04121", mid = "#f7238a",
high = "#ed9e00", midpoint = 7.1) +
facet_grid(. ~ series) +
geomtextpath::geom_textpath(aes(label = baker),
vjust = -0.2,
text_only = TRUE,
hjust = 0.3) +
theme_minimal()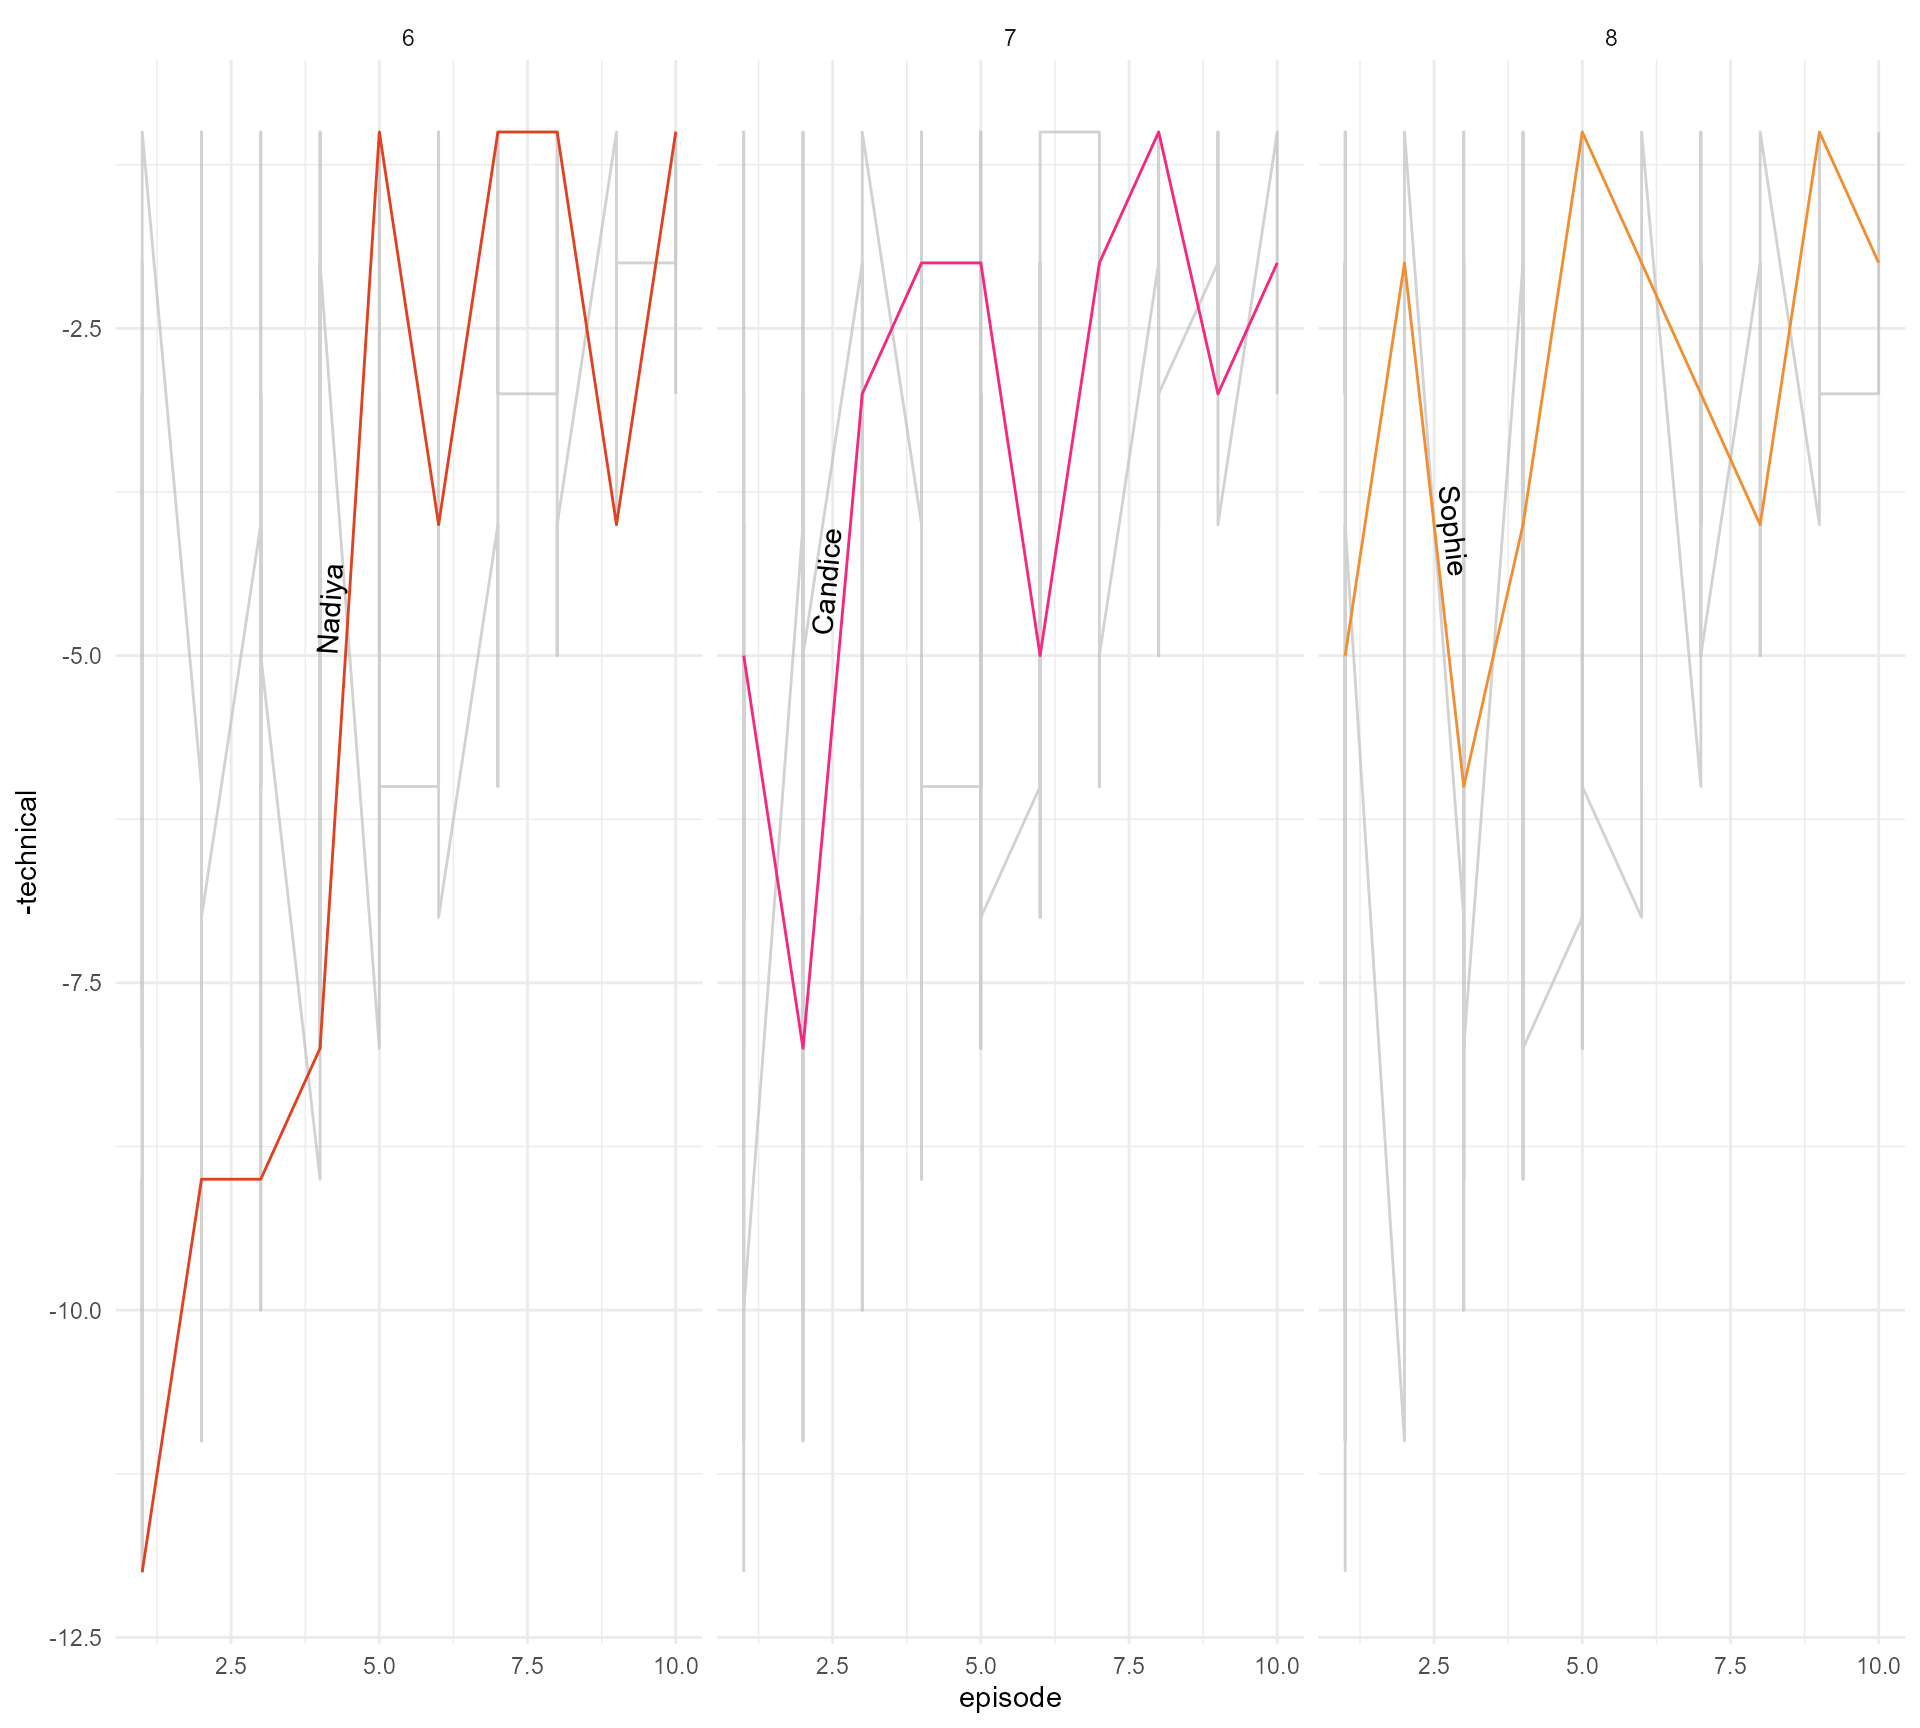
#4 Declutter, declutter, declutter
And some more {ggtext} fun!
bakeoff::bakes_raw %>%
filter(series %in% c(6:8)) %>%
left_join(bakeoff::bakers %>%
filter(series_winner == 1)) %>%
ggplot(aes(x = episode,
y = -technical)) +
geom_path(aes(colour = series),
show.legend = FALSE) +
gghighlight::gghighlight(series_winner == 1,
calculate_per_facet = TRUE) +
scale_colour_gradient2(low = "#e04121", mid = "#f7238a",
high = "#ed9e00", midpoint = 7.1) +
facet_grid(. ~ series) +
geomtextpath::geom_textpath(aes(label = baker),
vjust = -0.2,text_only = TRUE,
hjust = 0.3) +
ggtext::geom_textbox(data = bakeoff::bakes_raw %>%
filter(series %in% c(6:8)) %>%
left_join(bakeoff::bakers %>%
filter(series_winner == 1)) %>%
filter(series_winner == 1,
episode %in% c(1, 10)),
aes(label = technical)) +
theme_minimal()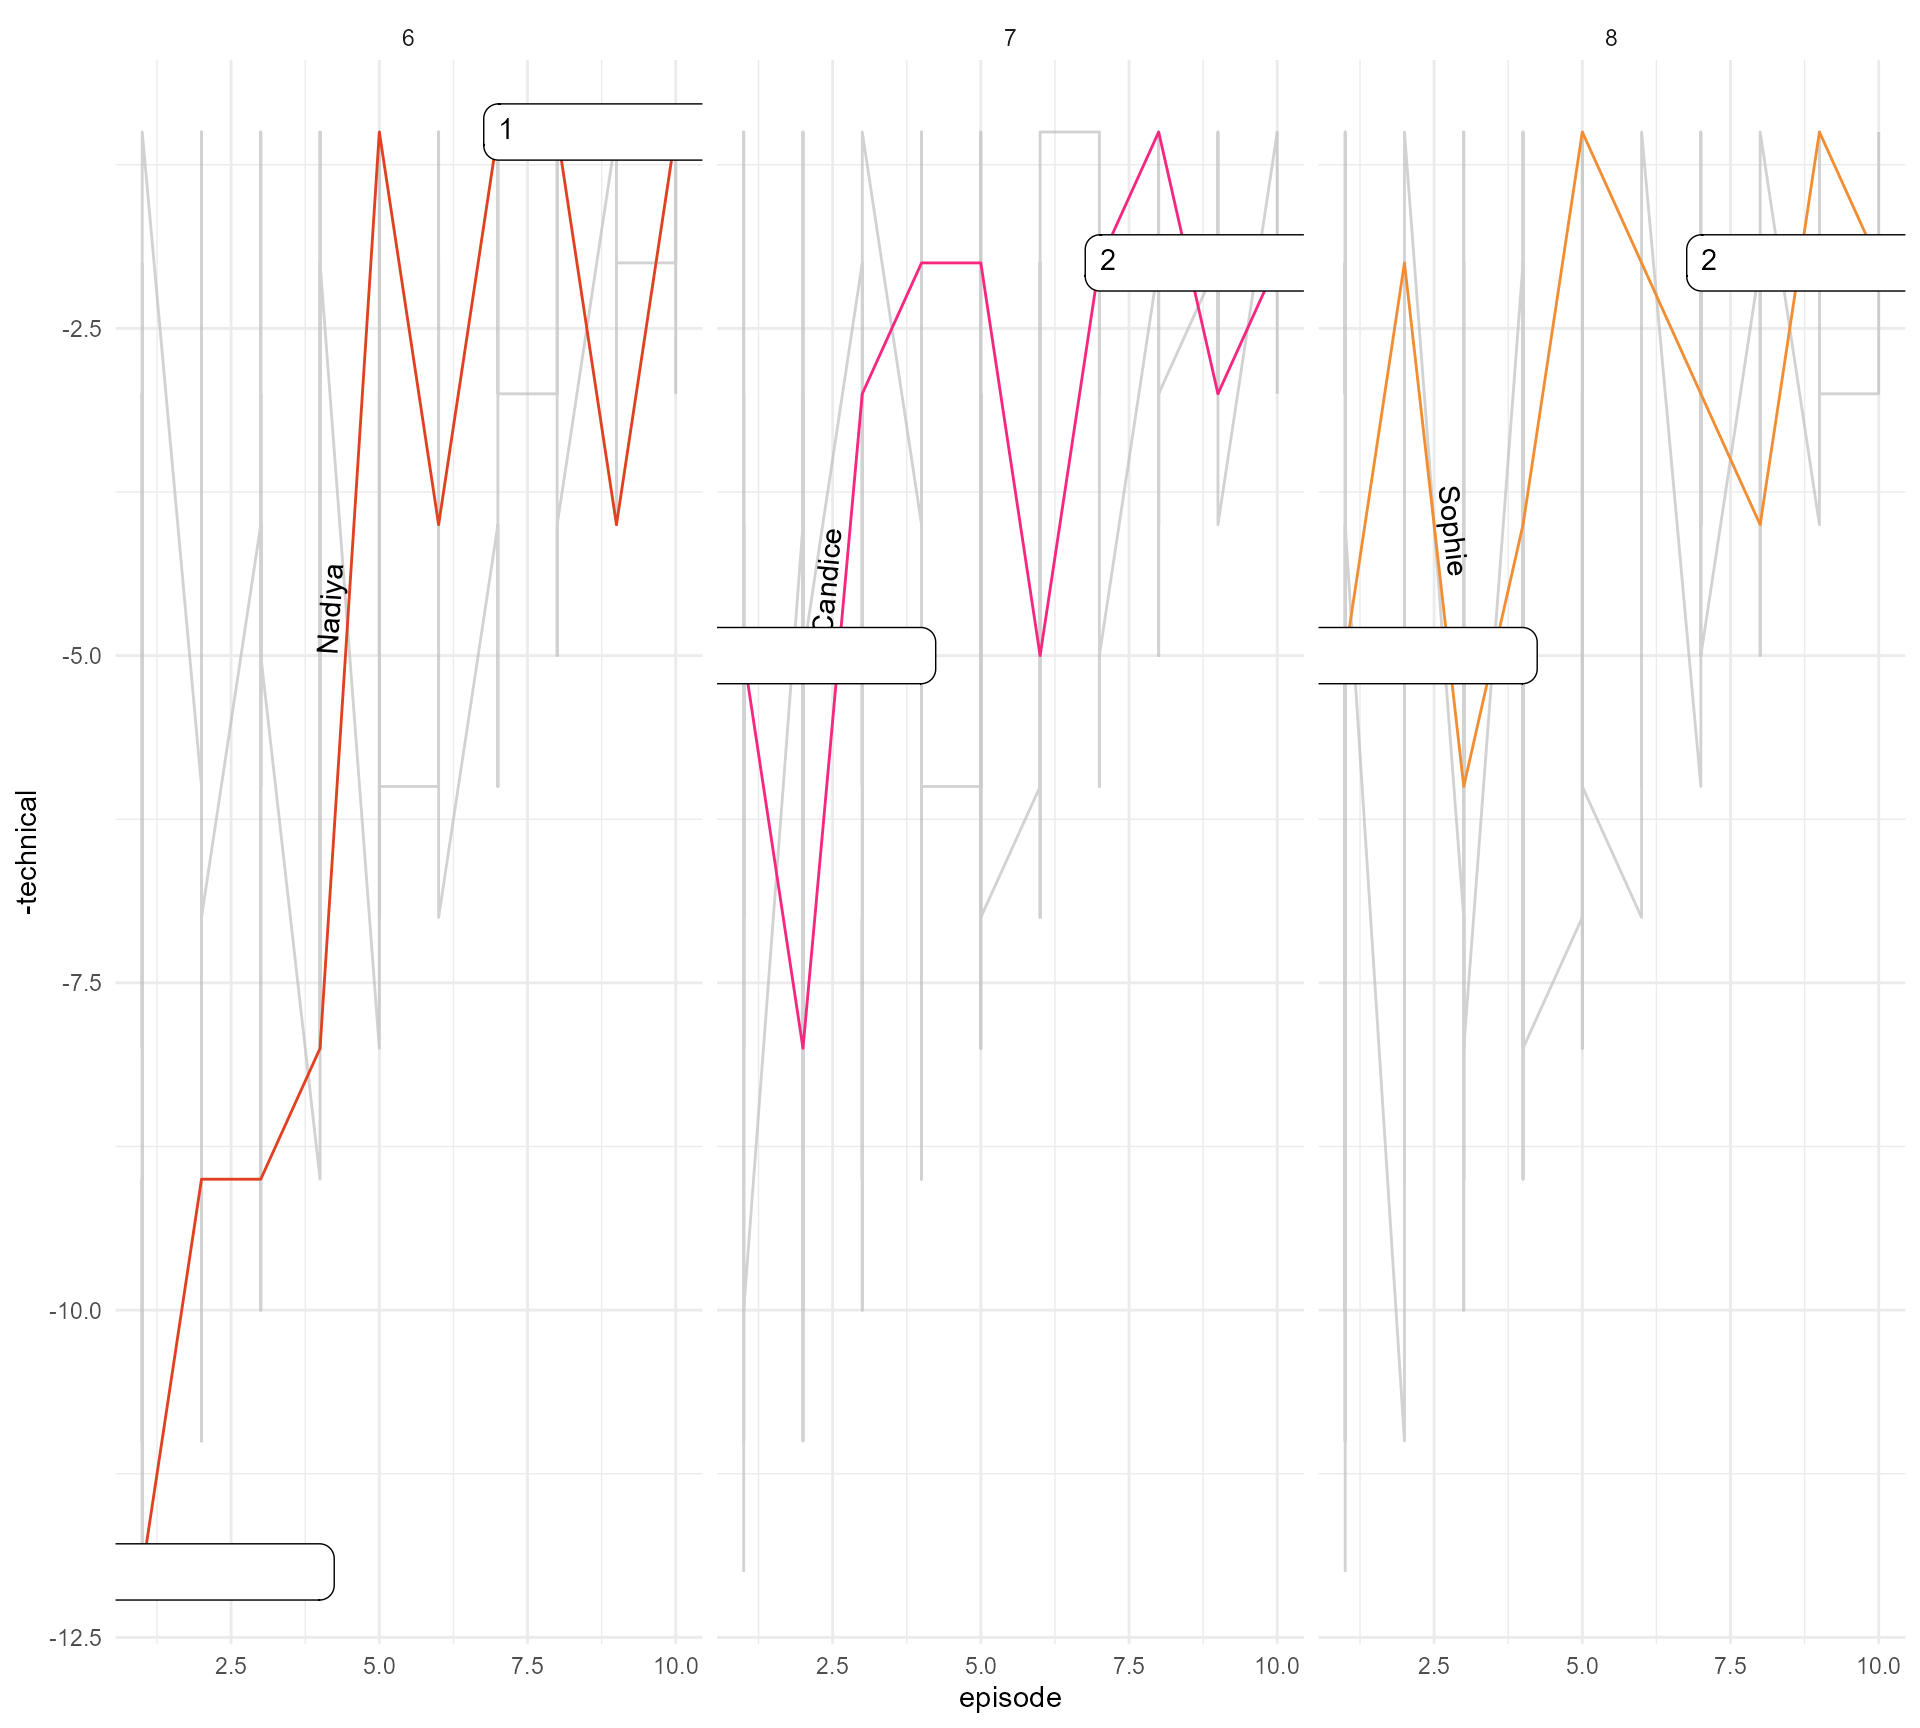
#4 Declutter, declutter, declutter
And some more {ggtext} fun!
bakeoff::bakes_raw %>%
filter(series %in% c(6:8)) %>%
left_join(bakeoff::bakers %>%
filter(series_winner == 1)) %>%
ggplot(aes(x = episode,
y = -technical)) +
geom_path(aes(colour = series),
show.legend = FALSE) +
gghighlight::gghighlight(series_winner == 1,
calculate_per_facet = TRUE) +
scale_colour_gradient2(low = "#e04121", mid = "#f7238a",
high = "#ed9e00", midpoint = 7.1) +
facet_grid(. ~ series) +
geomtextpath::geom_textpath(aes(label = baker),
vjust = -0.2,text_only = TRUE,
hjust = 0.3) +
ggtext::geom_textbox(data = bakeoff::bakes_raw %>%
filter(series %in% c(6:8)) %>%
left_join(bakeoff::bakers %>%
filter(series_winner == 1)) %>%
filter(series_winner == 1,
episode %in% c(1, 10)),
aes(label = technical,
hjust = case_when(episode == 1 ~ 1,
TRUE ~ 0),
halign = case_when(episode == 1 ~ 1,
TRUE ~ 0))) +
theme_minimal()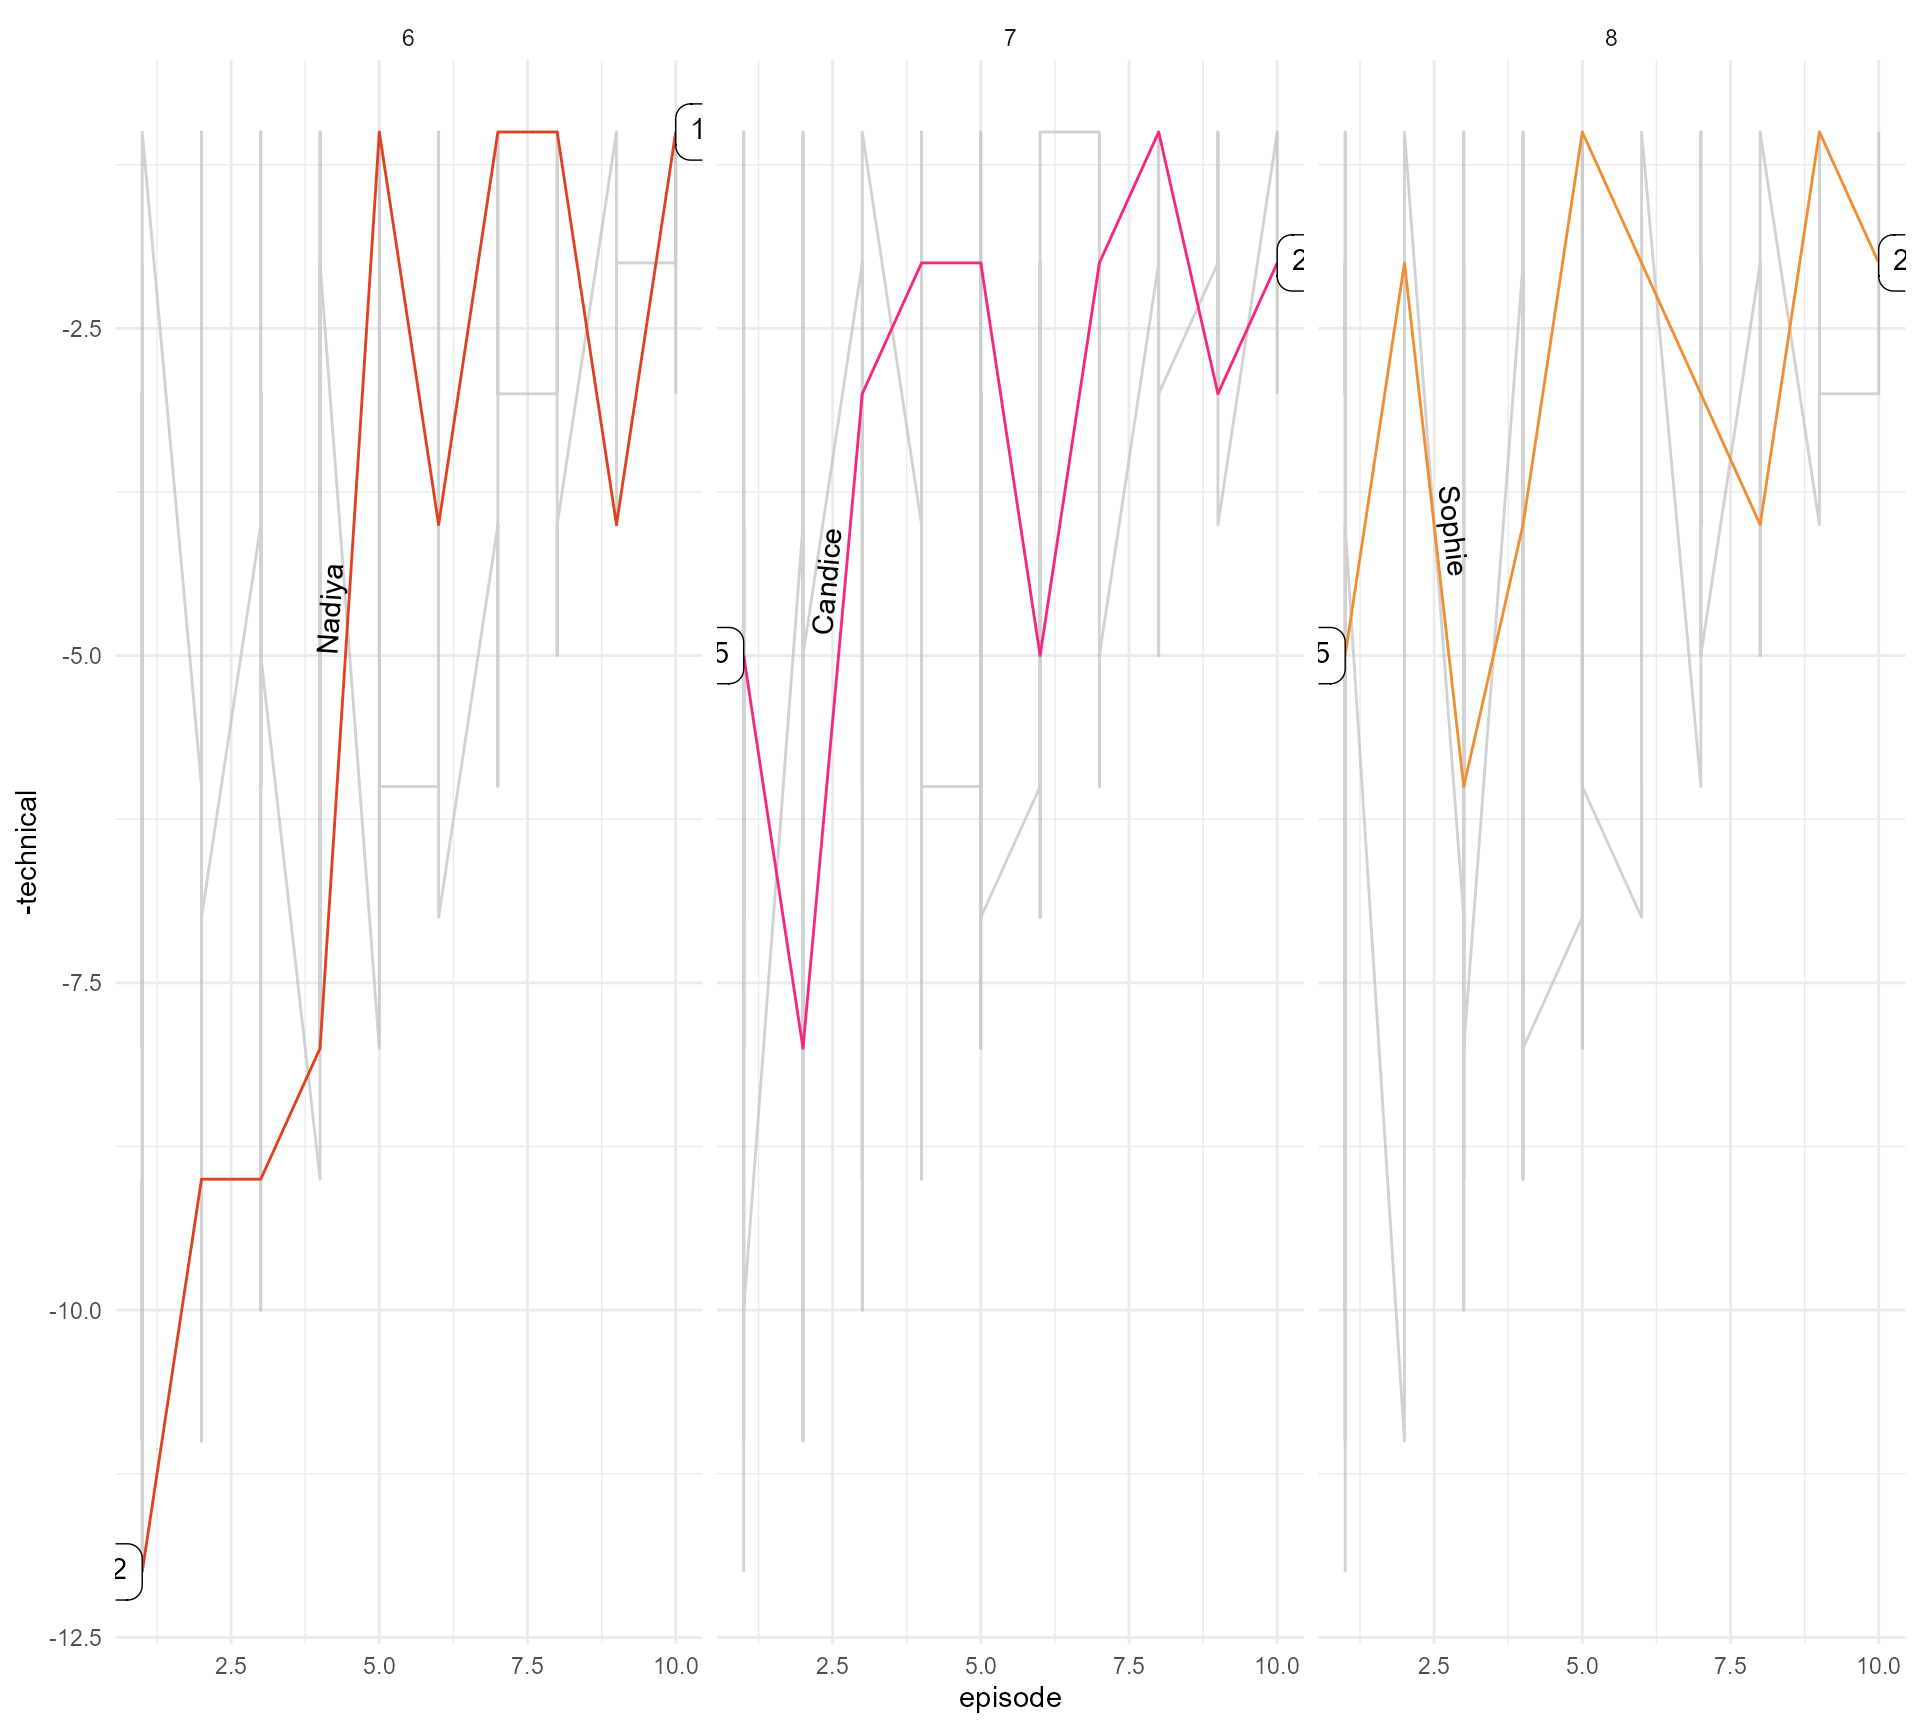
#4 Declutter, declutter, declutter
And some more {ggtext} fun!
bakeoff::bakes_raw %>%
filter(series %in% c(6:8)) %>%
left_join(bakeoff::bakers %>%
filter(series_winner == 1)) %>%
ggplot(aes(x = episode,
y = -technical)) +
geom_path(aes(colour = series),
show.legend = FALSE) +
gghighlight::gghighlight(series_winner == 1,
calculate_per_facet = TRUE) +
scale_colour_gradient2(low = "#e04121", mid = "#f7238a",
high = "#ed9e00", midpoint = 7.1) +
facet_grid(. ~ series) +
geomtextpath::geom_textpath(aes(label = baker),
vjust = -0.2,text_only = TRUE,
hjust = 0.3) +
ggtext::geom_textbox(data = bakeoff::bakes_raw %>%
filter(series %in% c(6:8)) %>%
left_join(bakeoff::bakers %>%
filter(series_winner == 1)) %>%
filter(series_winner == 1,
episode %in% c(1, 10)),
aes(label = paste0("#", technical),
hjust = case_when(episode == 1 ~ 1,
TRUE ~ 0),
halign = case_when(episode == 1 ~ 1,
TRUE ~ 0)),
box.colour = NA,
fill = NA) +
scale_x_continuous(expand = expansion(0.2)) +
theme_minimal()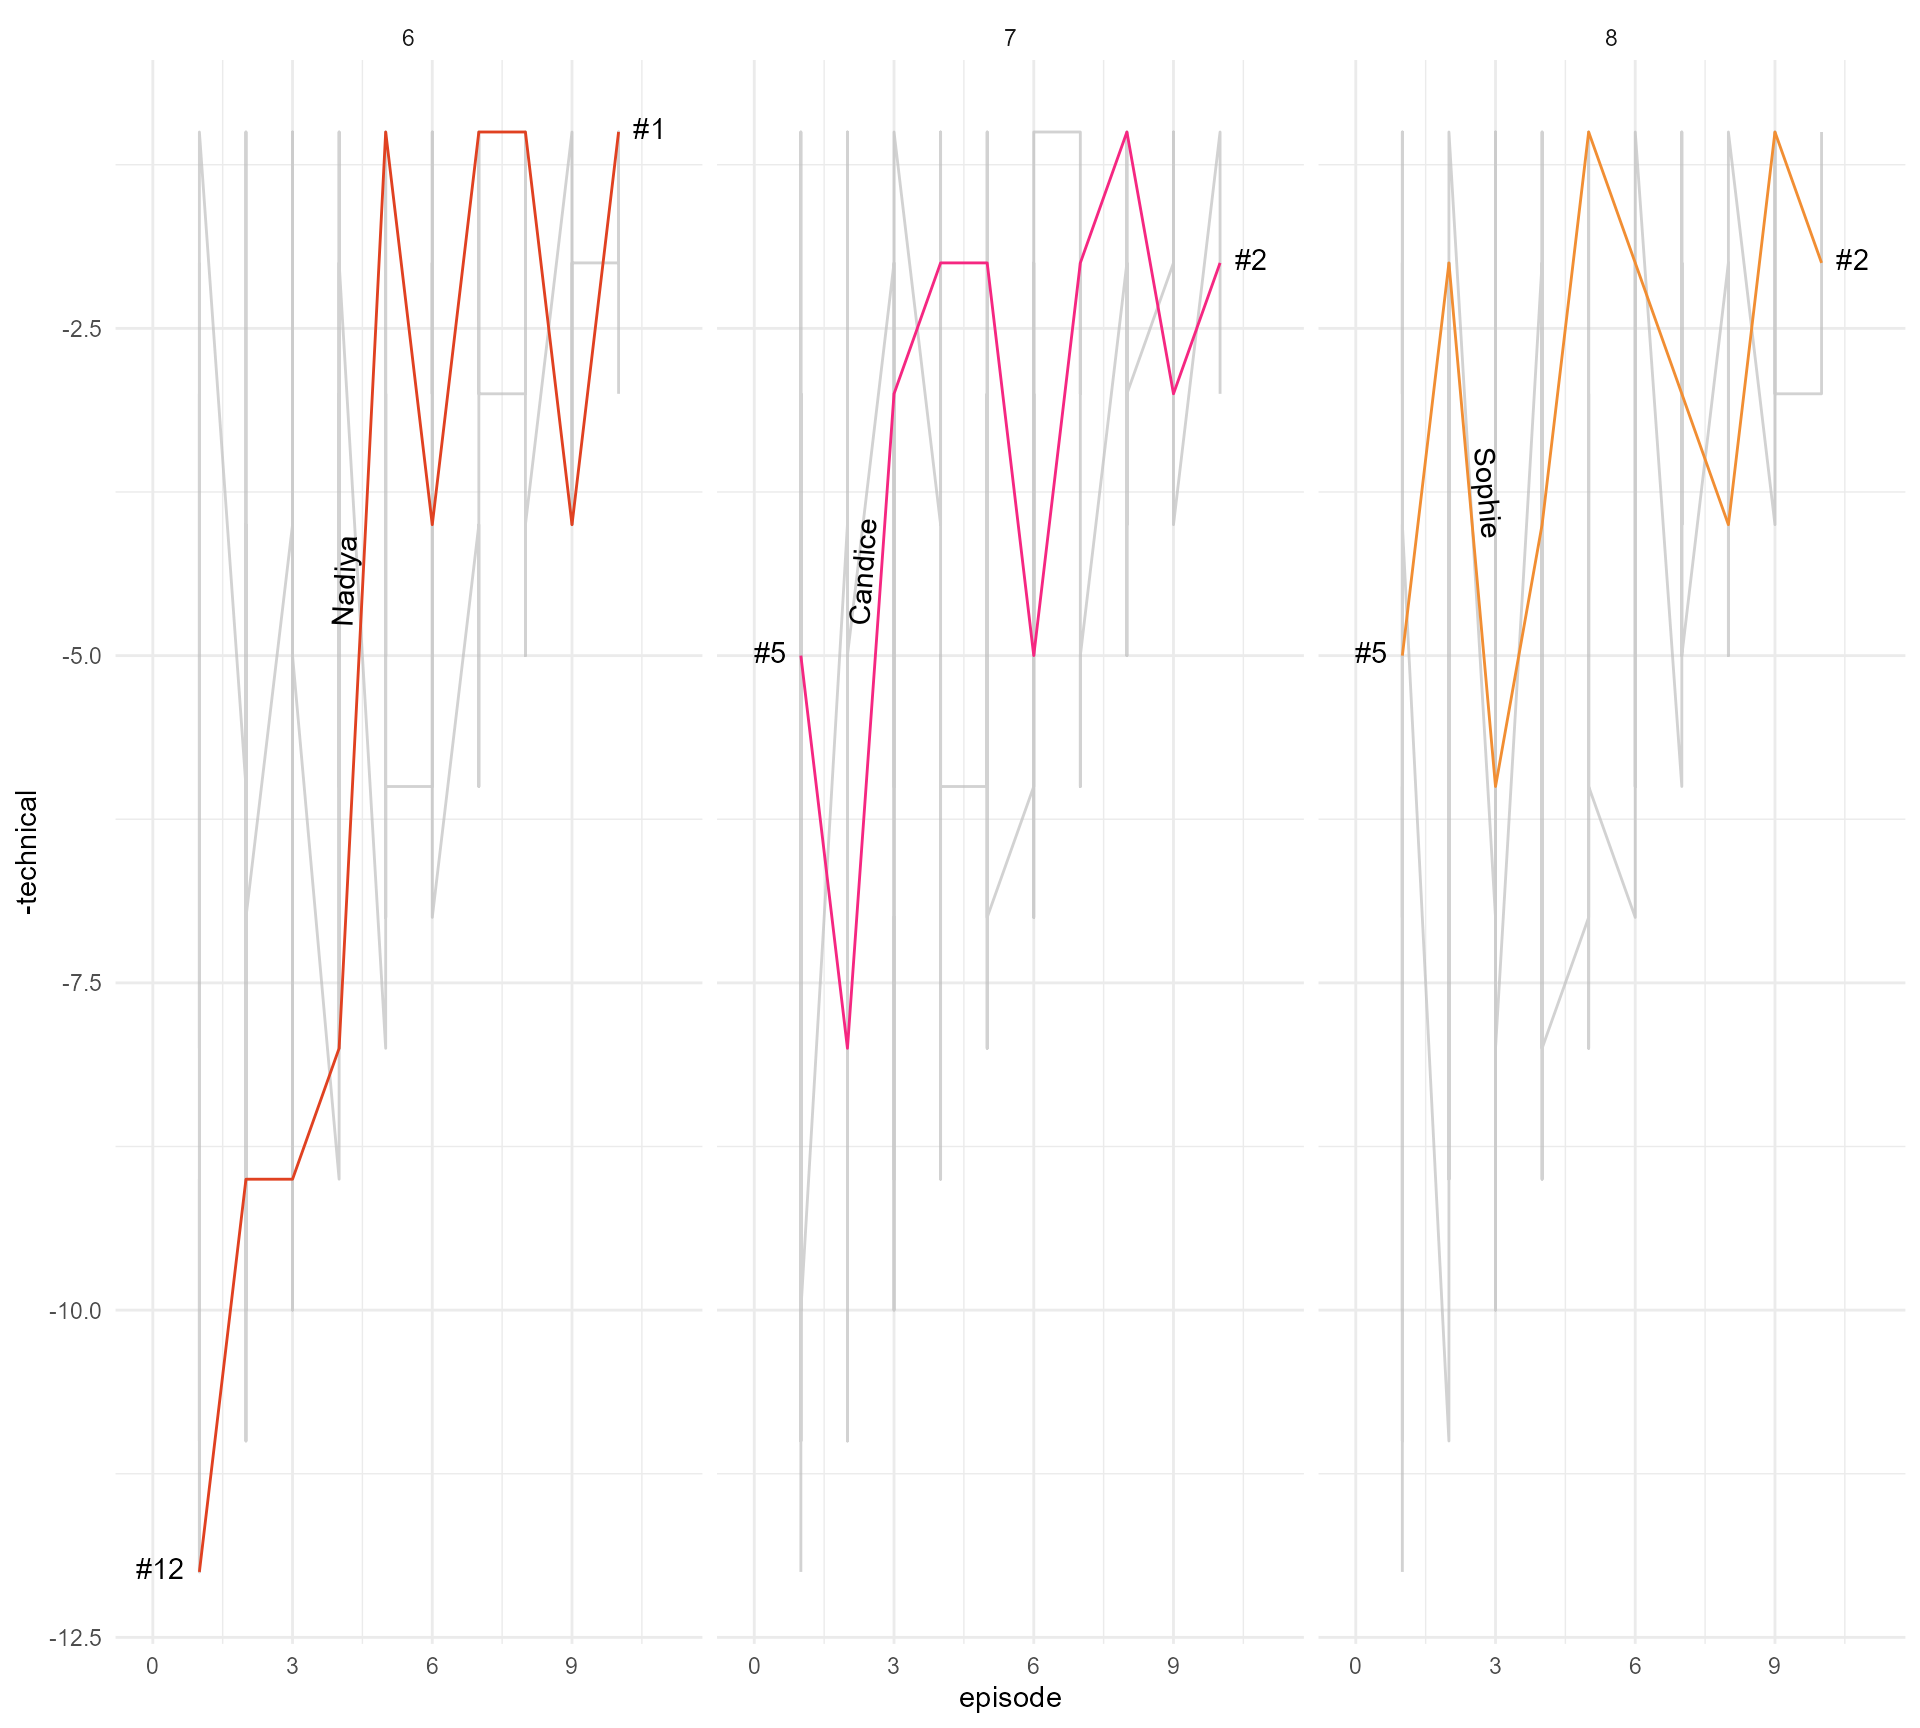
#4 Declutter, declutter, declutter
And some more {ggtext} fun!
bakeoff::bakes_raw %>%
filter(series %in% c(6:8)) %>%
left_join(bakeoff::bakers %>%
filter(series_winner == 1)) %>%
ggplot(aes(x = episode,
y = -technical)) +
geom_path(aes(colour = series),
show.legend = FALSE) +
gghighlight::gghighlight(series_winner == 1,
calculate_per_facet = TRUE) +
scale_colour_gradient2(low = "#e04121", mid = "#f7238a",
high = "#ed9e00", midpoint = 7.1) +
facet_grid(. ~ series) +
geomtextpath::geom_textpath(aes(label = baker),
vjust = -0.2,text_only = TRUE,
hjust = 0.3,
family = "Cabin") +
ggtext::geom_textbox(data = bakeoff::bakes_raw %>%
filter(series %in% c(6:8)) %>%
left_join(bakeoff::bakers %>%
filter(series_winner == 1)) %>%
filter(series_winner == 1,
episode %in% c(1, 10)),
aes(label = paste0("#", technical),
hjust = case_when(episode == 1 ~ 1,
TRUE ~ 0),
halign = case_when(episode == 1 ~ 1,
TRUE ~ 0)),
box.colour = NA,
family = "Cabin",
fill = NA) +
scale_x_continuous(expand = expansion(0.2)) +
theme_minimal()
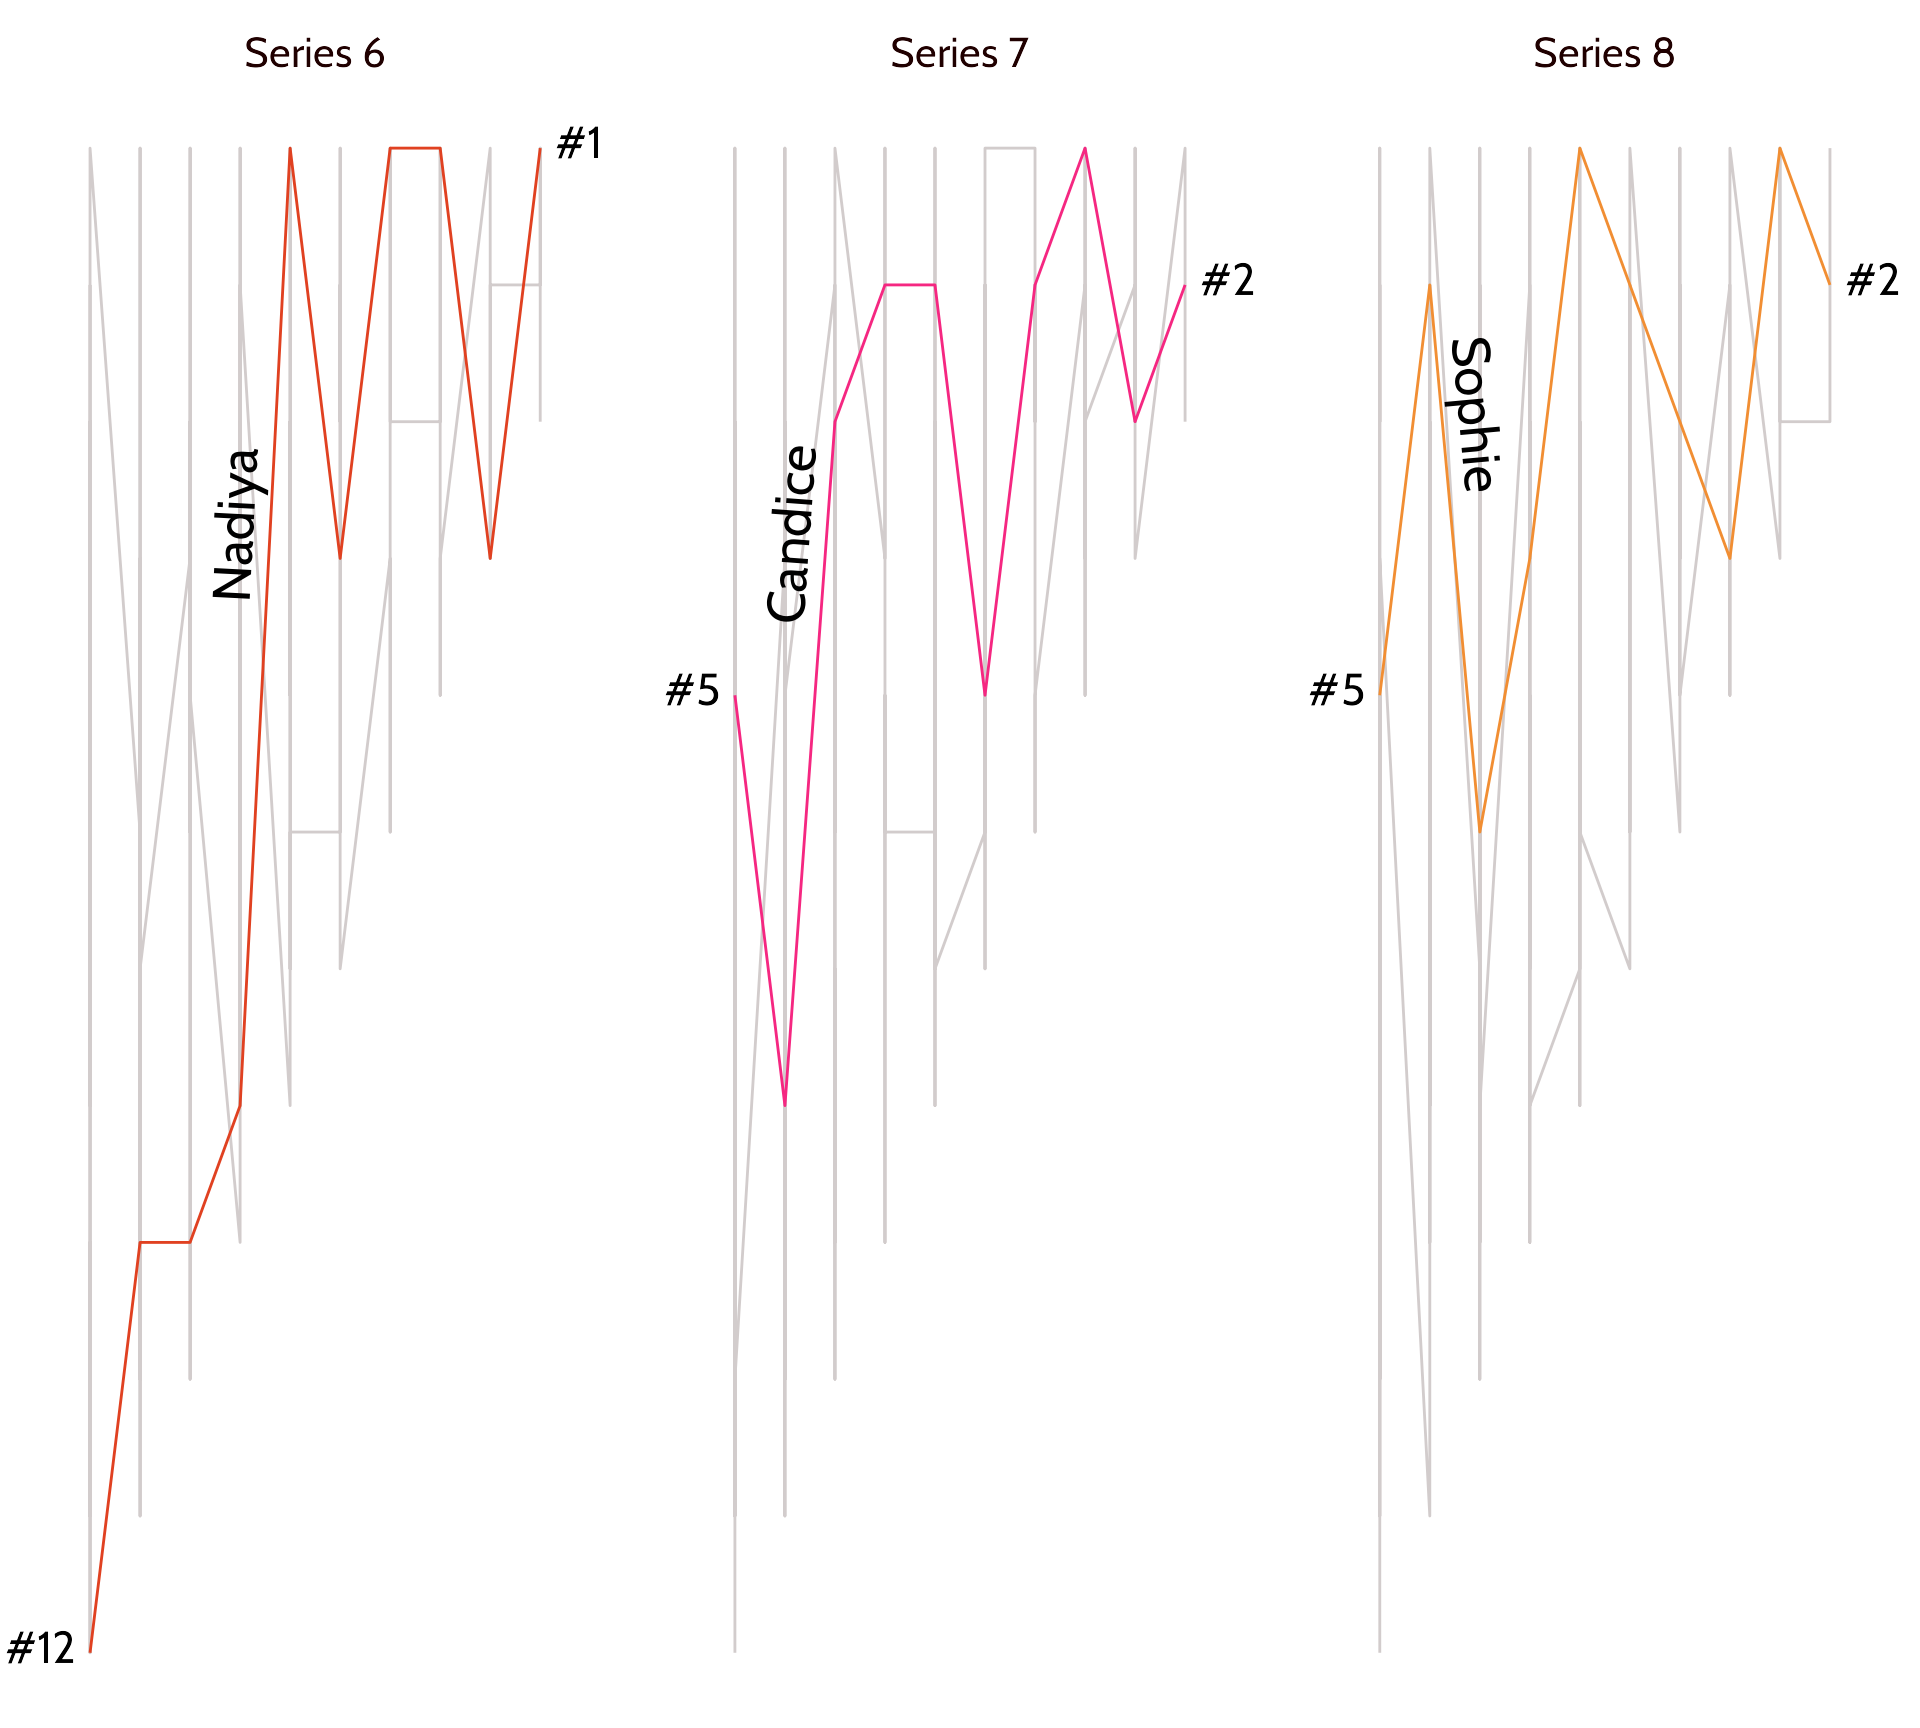
#4 Declutter, declutter, declutter
Format the facet titles
bakeoff::bakes_raw %>%
filter(series %in% c(6:8)) %>%
left_join(bakeoff::bakers %>%
filter(series_winner == 1)) %>%
ggplot(aes(x = episode,
y = -technical)) +
geom_path(aes(colour = series),
show.legend = FALSE) +
gghighlight::gghighlight(series_winner == 1,
calculate_per_facet = TRUE) +
scale_colour_gradient2(low = "#e04121", mid = "#f7238a",
high = "#ed9e00", midpoint = 7.1) +
facet_grid(. ~ series,
labeller = as_labeller(function(x)
paste("Series", x))) +
geomtextpath::geom_textpath(aes(label = baker),
vjust = -0.2,text_only = TRUE,
hjust = 0.3,
family = "Cabin") +
ggtext::geom_textbox(data = bakeoff::bakes_raw %>%
filter(series %in% c(6:8)) %>%
left_join(bakeoff::bakers %>%
filter(series_winner == 1)) %>%
filter(series_winner == 1,
episode %in% c(1, 10)),
aes(label = paste0("#", technical),
hjust = case_when(episode == 1 ~ 1,
TRUE ~ 0),
halign = case_when(episode == 1 ~ 1,
TRUE ~ 0)),
box.colour = NA,
family = "Cabin",
fill = NA) +
scale_x_continuous(expand = expansion(0.2)) +
theme_void() +
theme(strip.text = element_text(family = "Cabin", colour = "#200000",
size = 16))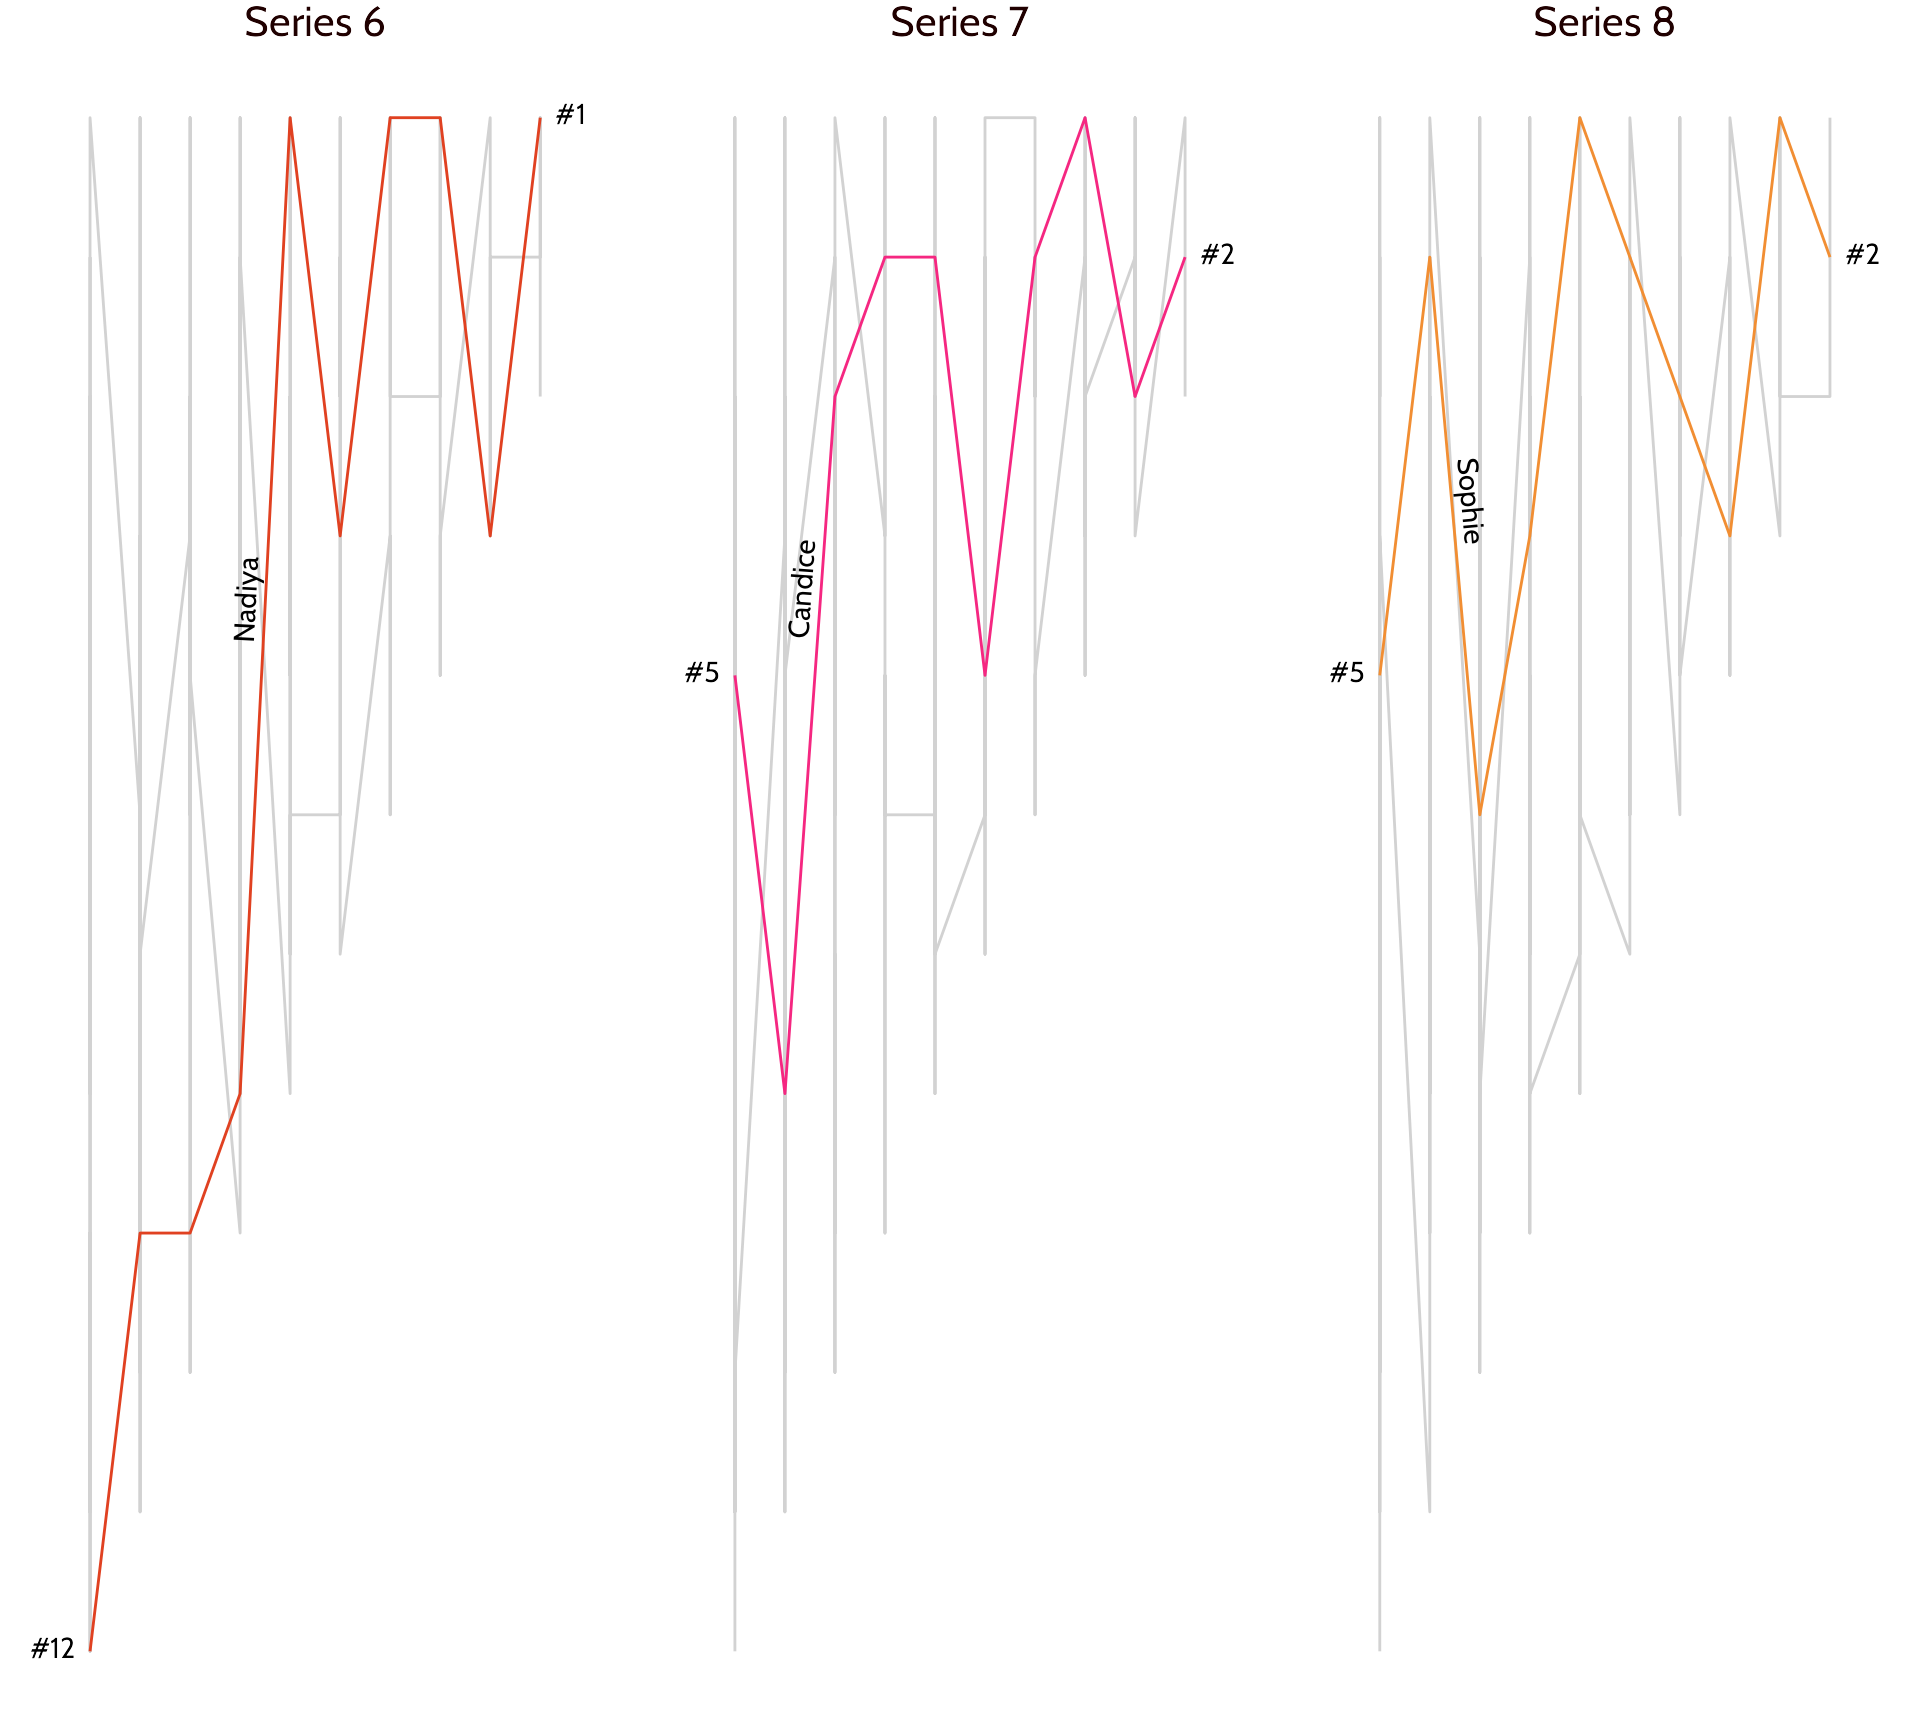
#4 Declutter, declutter, declutter
Format the facet titles
bakeoff::bakes_raw %>%
filter(series %in% c(6:8)) %>%
left_join(bakeoff::bakers %>%
filter(series_winner == 1)) %>%
ggplot(aes(x = episode,
y = -technical)) +
geom_path(aes(colour = series),
show.legend = FALSE) +
gghighlight::gghighlight(series_winner == 1,
calculate_per_facet = TRUE) +
scale_colour_gradient2(low = "#e04121", mid = "#f7238a",
high = "#ed9e00", midpoint = 7.1) +
facet_grid(. ~ series, labeller = as_labeller(function(x) paste("Series", x))) +
geomtextpath::geom_textpath(aes(label = baker),
vjust = -0.2,text_only = TRUE,
hjust = 0.3,
family = "Cabin") +
ggtext::geom_textbox(data = bakeoff::bakes_raw %>%
filter(series %in% c(6:8)) %>%
left_join(bakeoff::bakers %>%
filter(series_winner == 1)) %>%
filter(series_winner == 1,
episode %in% c(1, 10)),
aes(label = paste0("#", technical),
hjust = case_when(episode == 1 ~ 1,
TRUE ~ 0),
halign = case_when(episode == 1 ~ 1,
TRUE ~ 0)),
box.colour = NA,
family = "Cabin",
fill = NA) +
scale_x_continuous(expand = expansion(0.2)) +
theme_void() +
theme(strip.text = element_text(family = "Cabin", colour = "#200000",
size = 16,
margin = margin(c(16, 0, 0, 0))))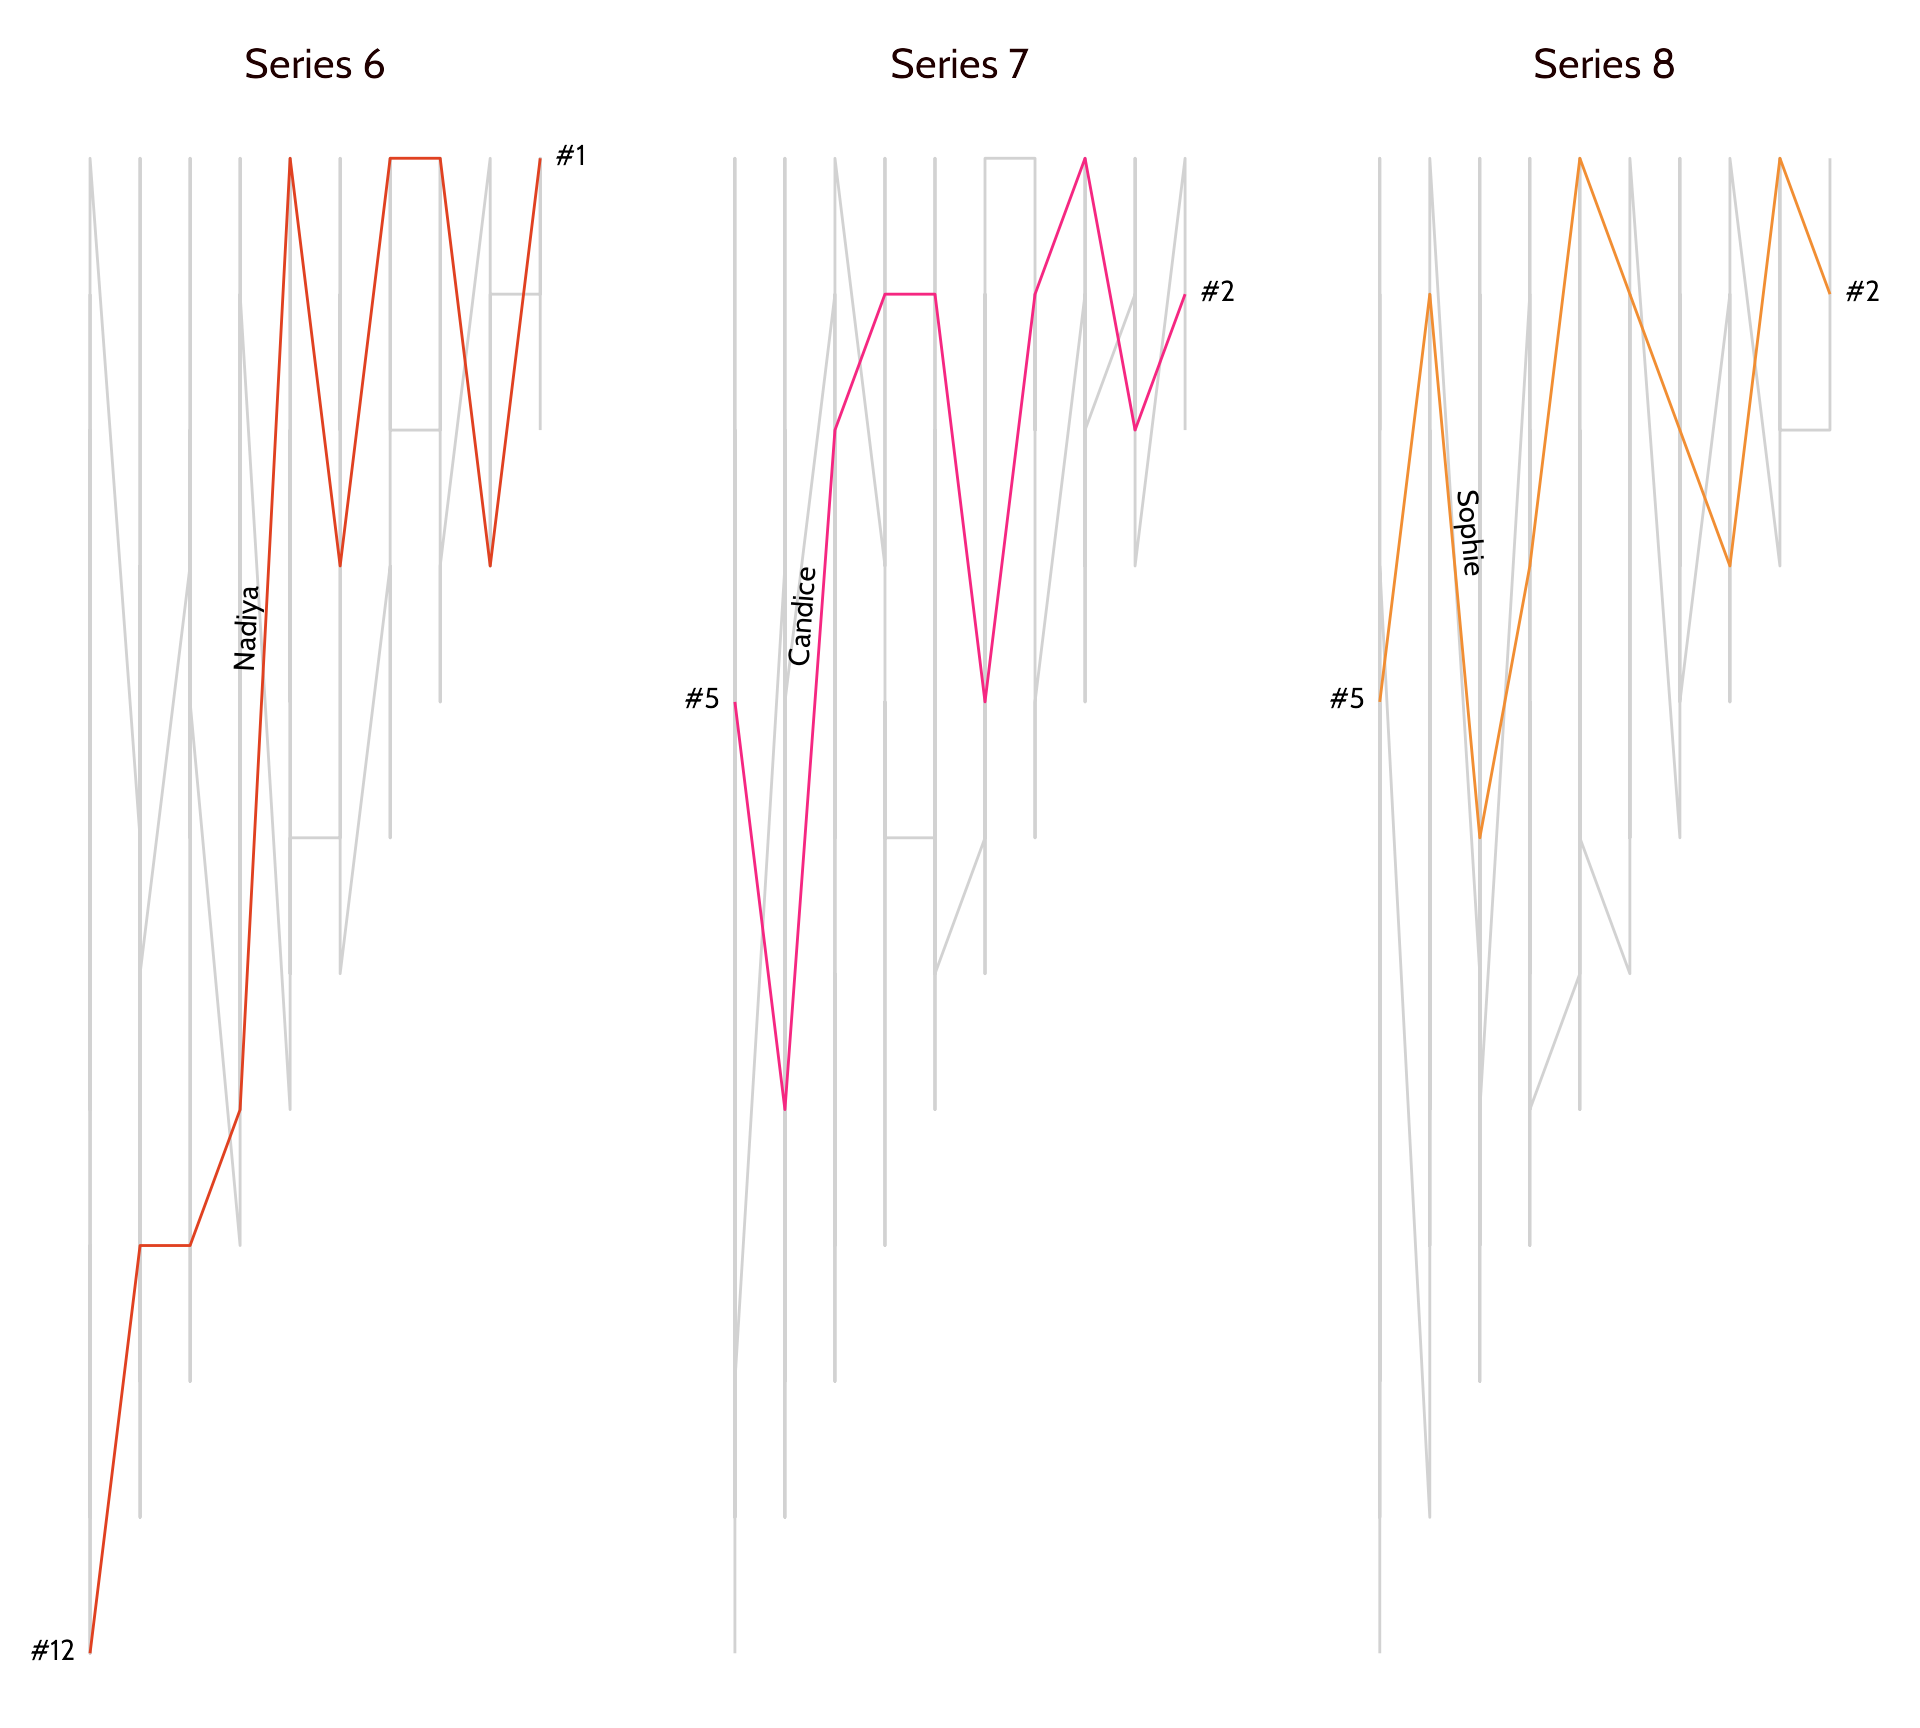
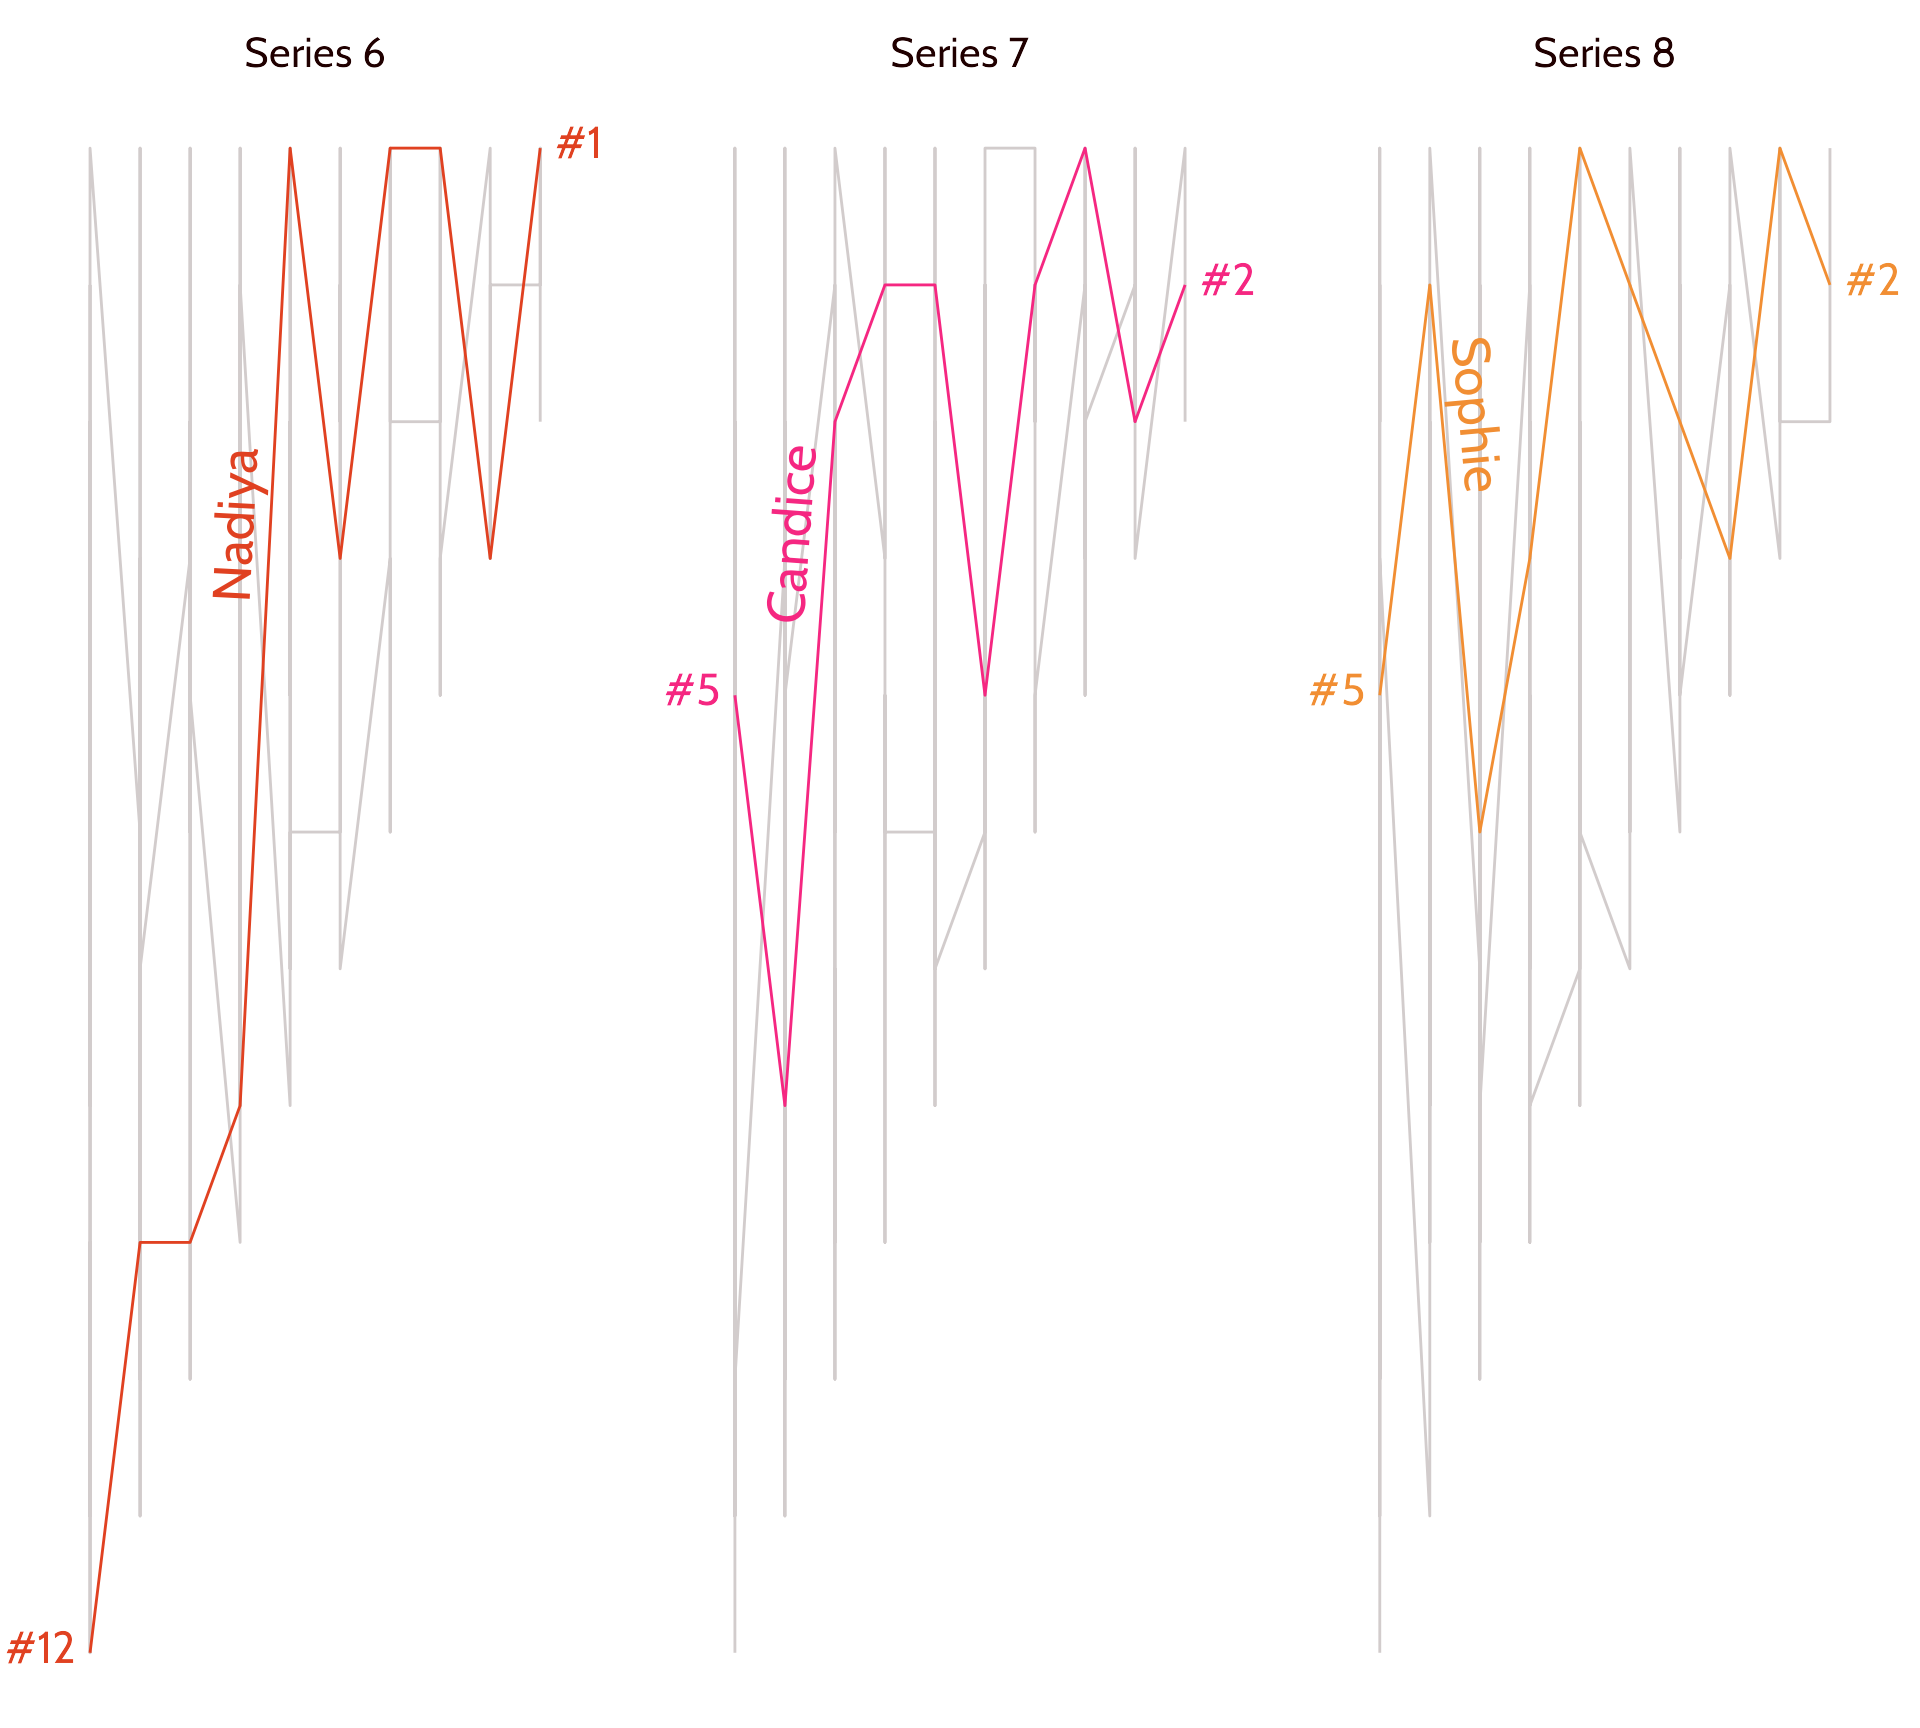
#4 Declutter, declutter, declutter
Very subtle decluttering - NA colours!
bakeoff::bakes_raw %>%
filter(series %in% c(6:8)) %>%
left_join(bakeoff::bakers %>%
filter(series_winner == 1)) %>%
ggplot(aes(x = episode,
y = -technical)) +
geom_path(aes(colour = series),
show.legend = FALSE) +
gghighlight::gghighlight(series_winner == 1,
calculate_per_facet = TRUE,
unhighlighted_params =
list(color = "#D2CCCC")) +
scale_colour_gradient2(low = "#e04121", mid = "#f7238a",
high = "#ed9e00", midpoint = 7.1) +
facet_grid(. ~ series, labeller = as_labeller(function(x) paste("Series", x))) +
geomtextpath::geom_textpath(aes(label = baker),
vjust = -0.2,text_only = TRUE,
hjust = 0.3,
family = "Cabin") +
ggtext::geom_textbox(data = bakeoff::bakes_raw %>%
filter(series %in% c(6:8)) %>%
left_join(bakeoff::bakers %>%
filter(series_winner == 1)) %>%
filter(series_winner == 1,
episode %in% c(1, 10)),
aes(label = paste0("#", technical),
hjust = case_when(episode == 1 ~ 1,
TRUE ~ 0),
halign = case_when(episode == 1 ~ 1,
TRUE ~ 0)),
box.colour = NA,
family = "Cabin",
fill = NA) +
scale_x_continuous(expand = expansion(0.2)) +
theme_void() +
theme(strip.text = element_text(family = "Cabin", colour = "#200000",
size = 16,
margin = margin(c(16, 0, 0, 0))))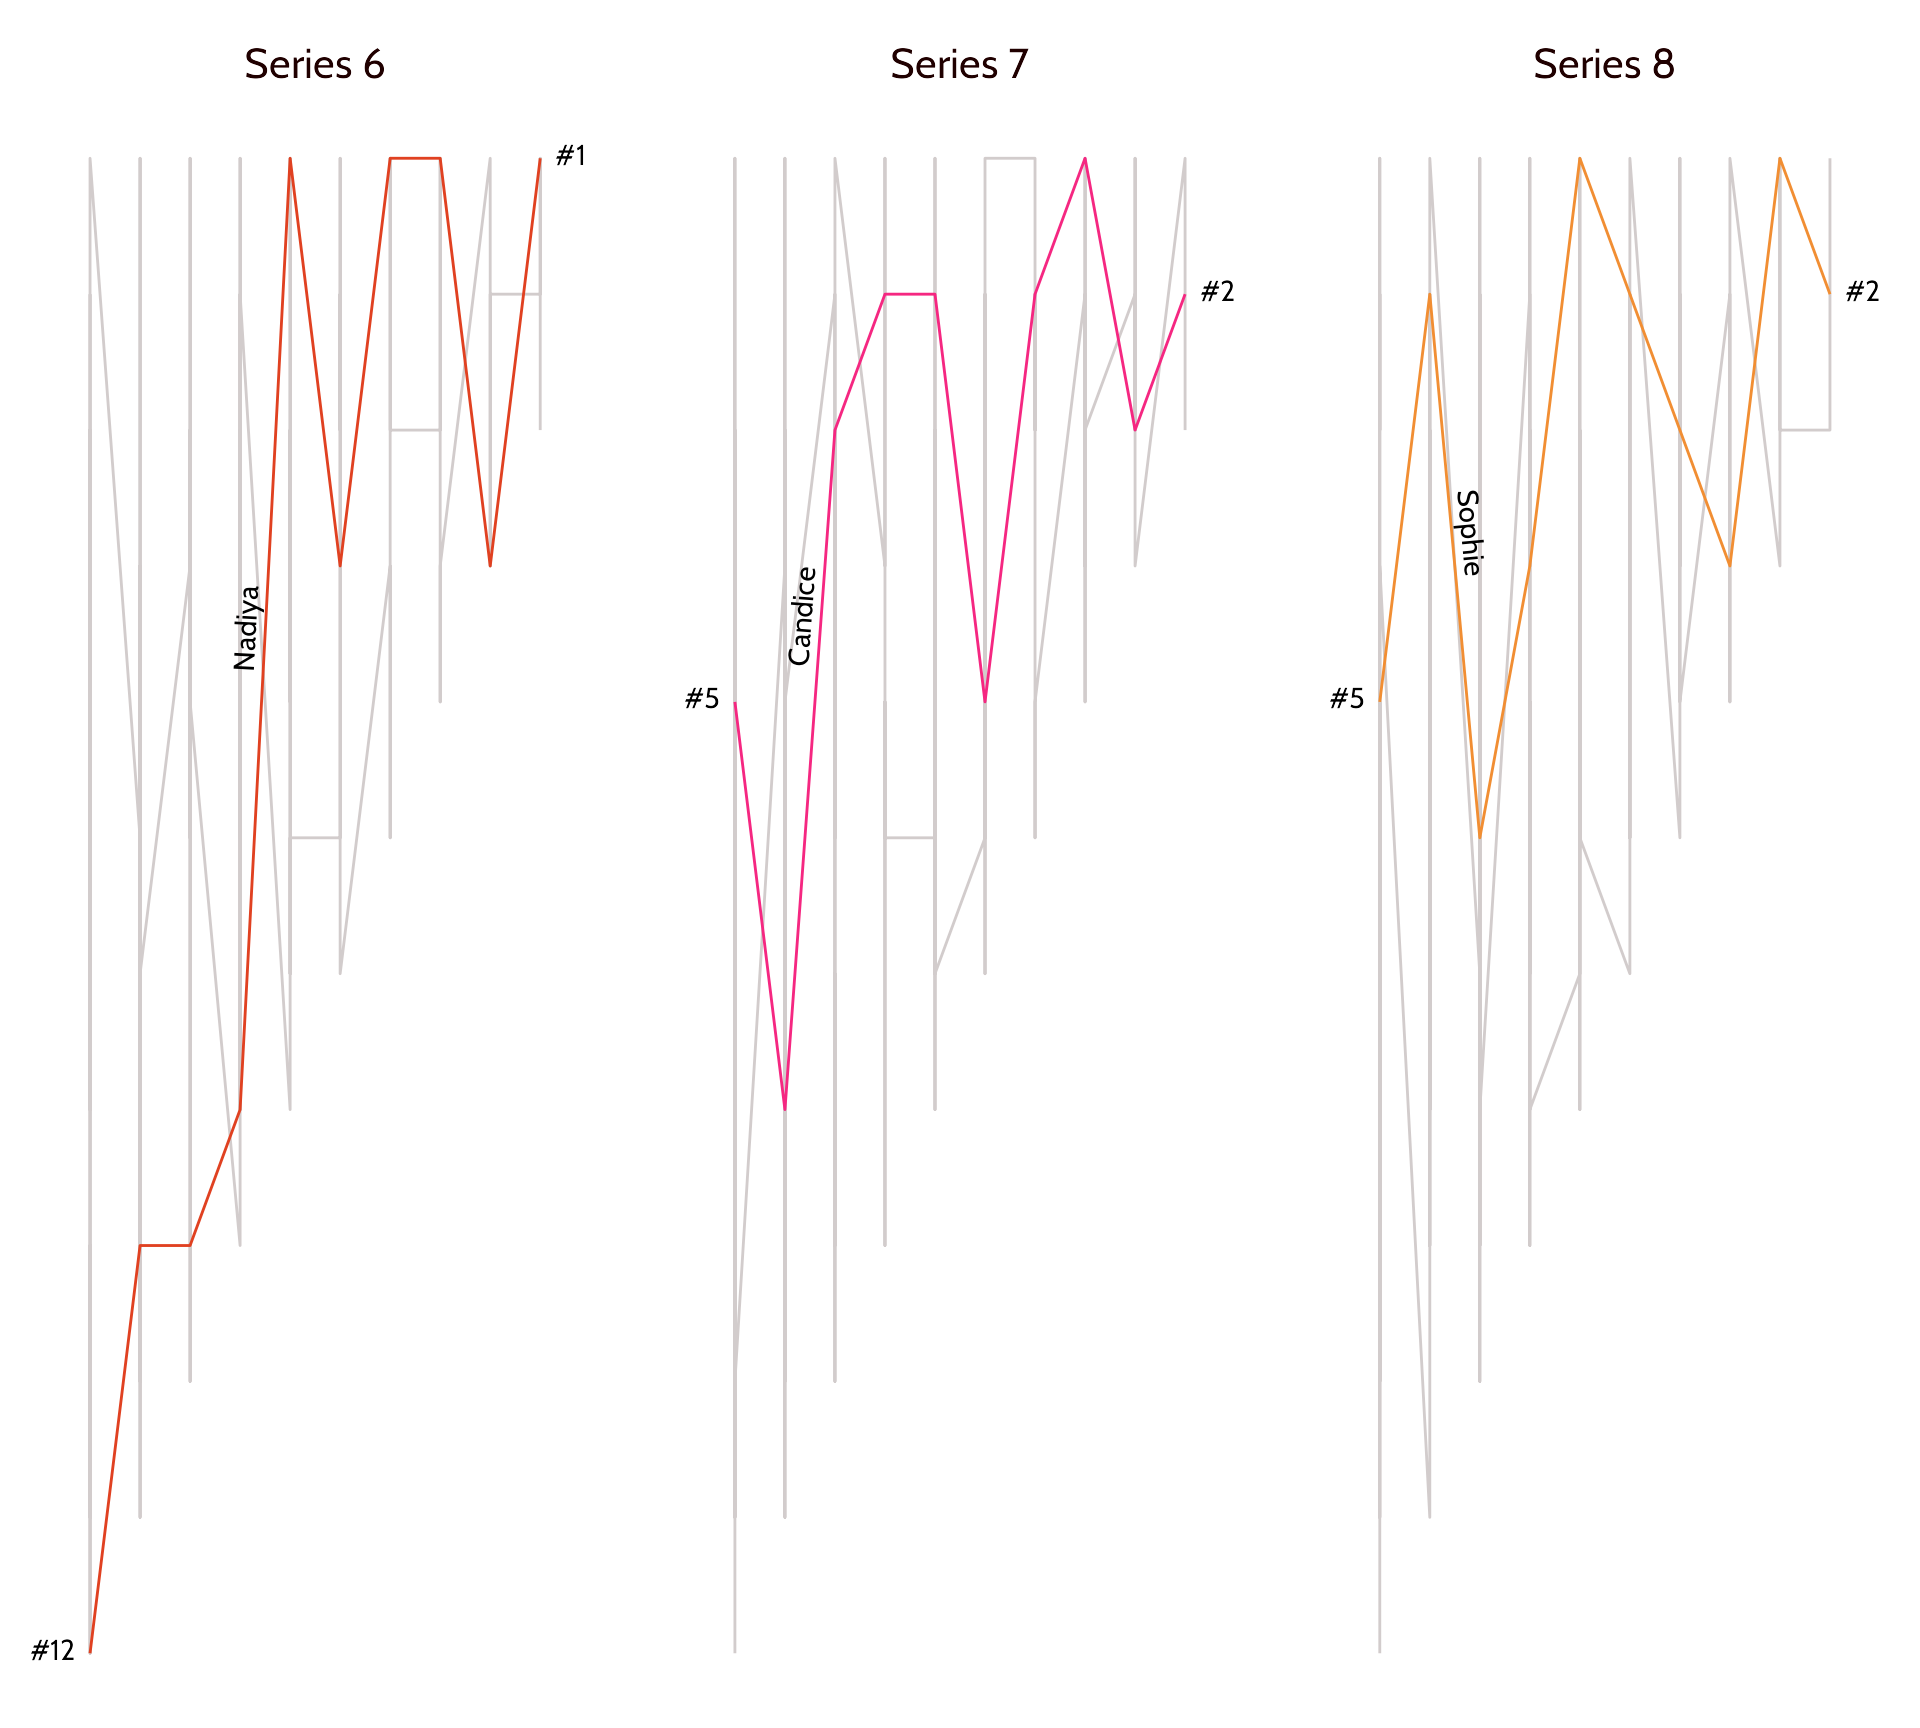
#4 Declutter, declutter, declutter
Adjust text hierarchy
bakeoff::bakes_raw %>%
filter(series %in% c(6:8)) %>%
left_join(bakeoff::bakers %>%
filter(series_winner == 1)) %>%
ggplot(aes(x = episode,
y = -technical)) +
geom_path(aes(colour = series),
show.legend = FALSE) +
gghighlight::gghighlight(series_winner == 1,
calculate_per_facet = TRUE,
unhighlighted_params = list(color = "#D2CCCC")) +
scale_colour_gradient2(low = "#e04121", mid = "#f7238a",
high = "#ed9e00", midpoint = 7.1) +
facet_grid(. ~ series, labeller = as_labeller(function(x) paste("Series", x))) +
geomtextpath::geom_textpath(aes(label = baker),
vjust = -0.2,text_only = TRUE,
hjust = 0.3,
size = 7,
family = "Cabin") +
ggtext::geom_textbox(data = bakeoff::bakes_raw %>%
filter(series %in% c(6:8)) %>%
left_join(bakeoff::bakers %>%
filter(series_winner == 1)) %>%
filter(series_winner == 1,
episode %in% c(1, 10)),
aes(label = paste0("#", technical),
hjust = case_when(episode == 1 ~ 1,
TRUE ~ 0),
halign = case_when(episode == 1 ~ 1,
TRUE ~ 0)),
box.colour = NA,
size = 6,
family = "Cabin",
fill = NA) +
scale_x_continuous(expand = expansion(0.2)) +
theme_void() +
theme(strip.text = element_text(family = "Cabin", colour = "#200000",
size = 16,
margin = margin(c(12, 0, 0, 0))))
#4 Declutter, declutter, declutter


#5 Tie your text to the data
Use colour!
bakeoff::bakes_raw %>%
filter(series %in% c(6:8)) %>%
left_join(bakeoff::bakers %>%
filter(series_winner == 1)) %>%
ggplot(aes(x = episode,
y = -technical)) +
geom_path(aes(colour = series),
show.legend = FALSE) +
gghighlight::gghighlight(series_winner == 1,
calculate_per_facet = TRUE,
unhighlighted_params = list(color = "#D2CCCC")) +
scale_colour_gradient2(low = "#e04121", mid = "#f7238a",
high = "#ed9e00", midpoint = 7.1) +
facet_grid(. ~ series, labeller = as_labeller(function(x) paste("Series", x))) +
geomtextpath::geom_textpath(aes(label = baker),
vjust = -0.2,text_only = TRUE,
hjust = 0.3,
size = 7,
family = "Cabin") +
ggtext::geom_textbox(data = bakeoff::bakes_raw %>%
filter(series %in% c(6:8)) %>%
left_join(bakeoff::bakers %>%
filter(series_winner == 1)) %>%
filter(series_winner == 1,
episode %in% c(1, 10)),
aes(label = paste0("#", technical),
hjust = case_when(episode == 1 ~ 1,
TRUE ~ 0),
halign = case_when(episode == 1 ~ 1,
TRUE ~ 0)),
box.colour = NA,
size = 6,
family = "Cabin",
fill = NA) +
scale_x_continuous(expand = expansion(0.2)) +
theme_void() +
theme(strip.text = element_text(family = "Cabin", colour = "#200000",
size = 16,
margin = margin(c(12, 0, 0, 0))))
#5 Tie your text to the data
Use colour!
bakeoff::bakes_raw %>%
filter(series %in% c(6:8)) %>%
left_join(bakeoff::bakers %>%
filter(series_winner == 1)) %>%
ggplot(aes(x = episode,
y = -technical)) +
geom_path(aes(colour = series),
show.legend = FALSE) +
gghighlight::gghighlight(series_winner == 1,
calculate_per_facet = TRUE,
unhighlighted_params = list(color = "#D2CCCC")) +
scale_colour_gradient2(low = "#e04121", mid = "#f7238a",
high = "#ed9e00", midpoint = 7.1) +
facet_grid(. ~ series, labeller = as_labeller(function(x) paste("Series", x))) +
geomtextpath::geom_textpath(aes(label = baker,
colour = series),
vjust = -0.2,text_only = TRUE,
hjust = 0.3,
size = 7,
family = "Cabin") +
ggtext::geom_textbox(data = bakeoff::bakes_raw %>%
filter(series %in% c(6:8)) %>%
left_join(bakeoff::bakers %>%
filter(series_winner == 1)) %>%
filter(series_winner == 1,
episode %in% c(1, 10)),
aes(label = paste0("#", technical),
hjust = case_when(episode == 1 ~ 1,
TRUE ~ 0),
halign = case_when(episode == 1 ~ 1,
TRUE ~ 0)),
box.colour = NA,
size = 6,
family = "Cabin",
fill = NA) +
scale_x_continuous(expand = expansion(0.2)) +
theme_void() +
theme(strip.text = element_text(family = "Cabin", colour = "#200000",
size = 16,
margin = margin(c(12, 0, 0, 0))))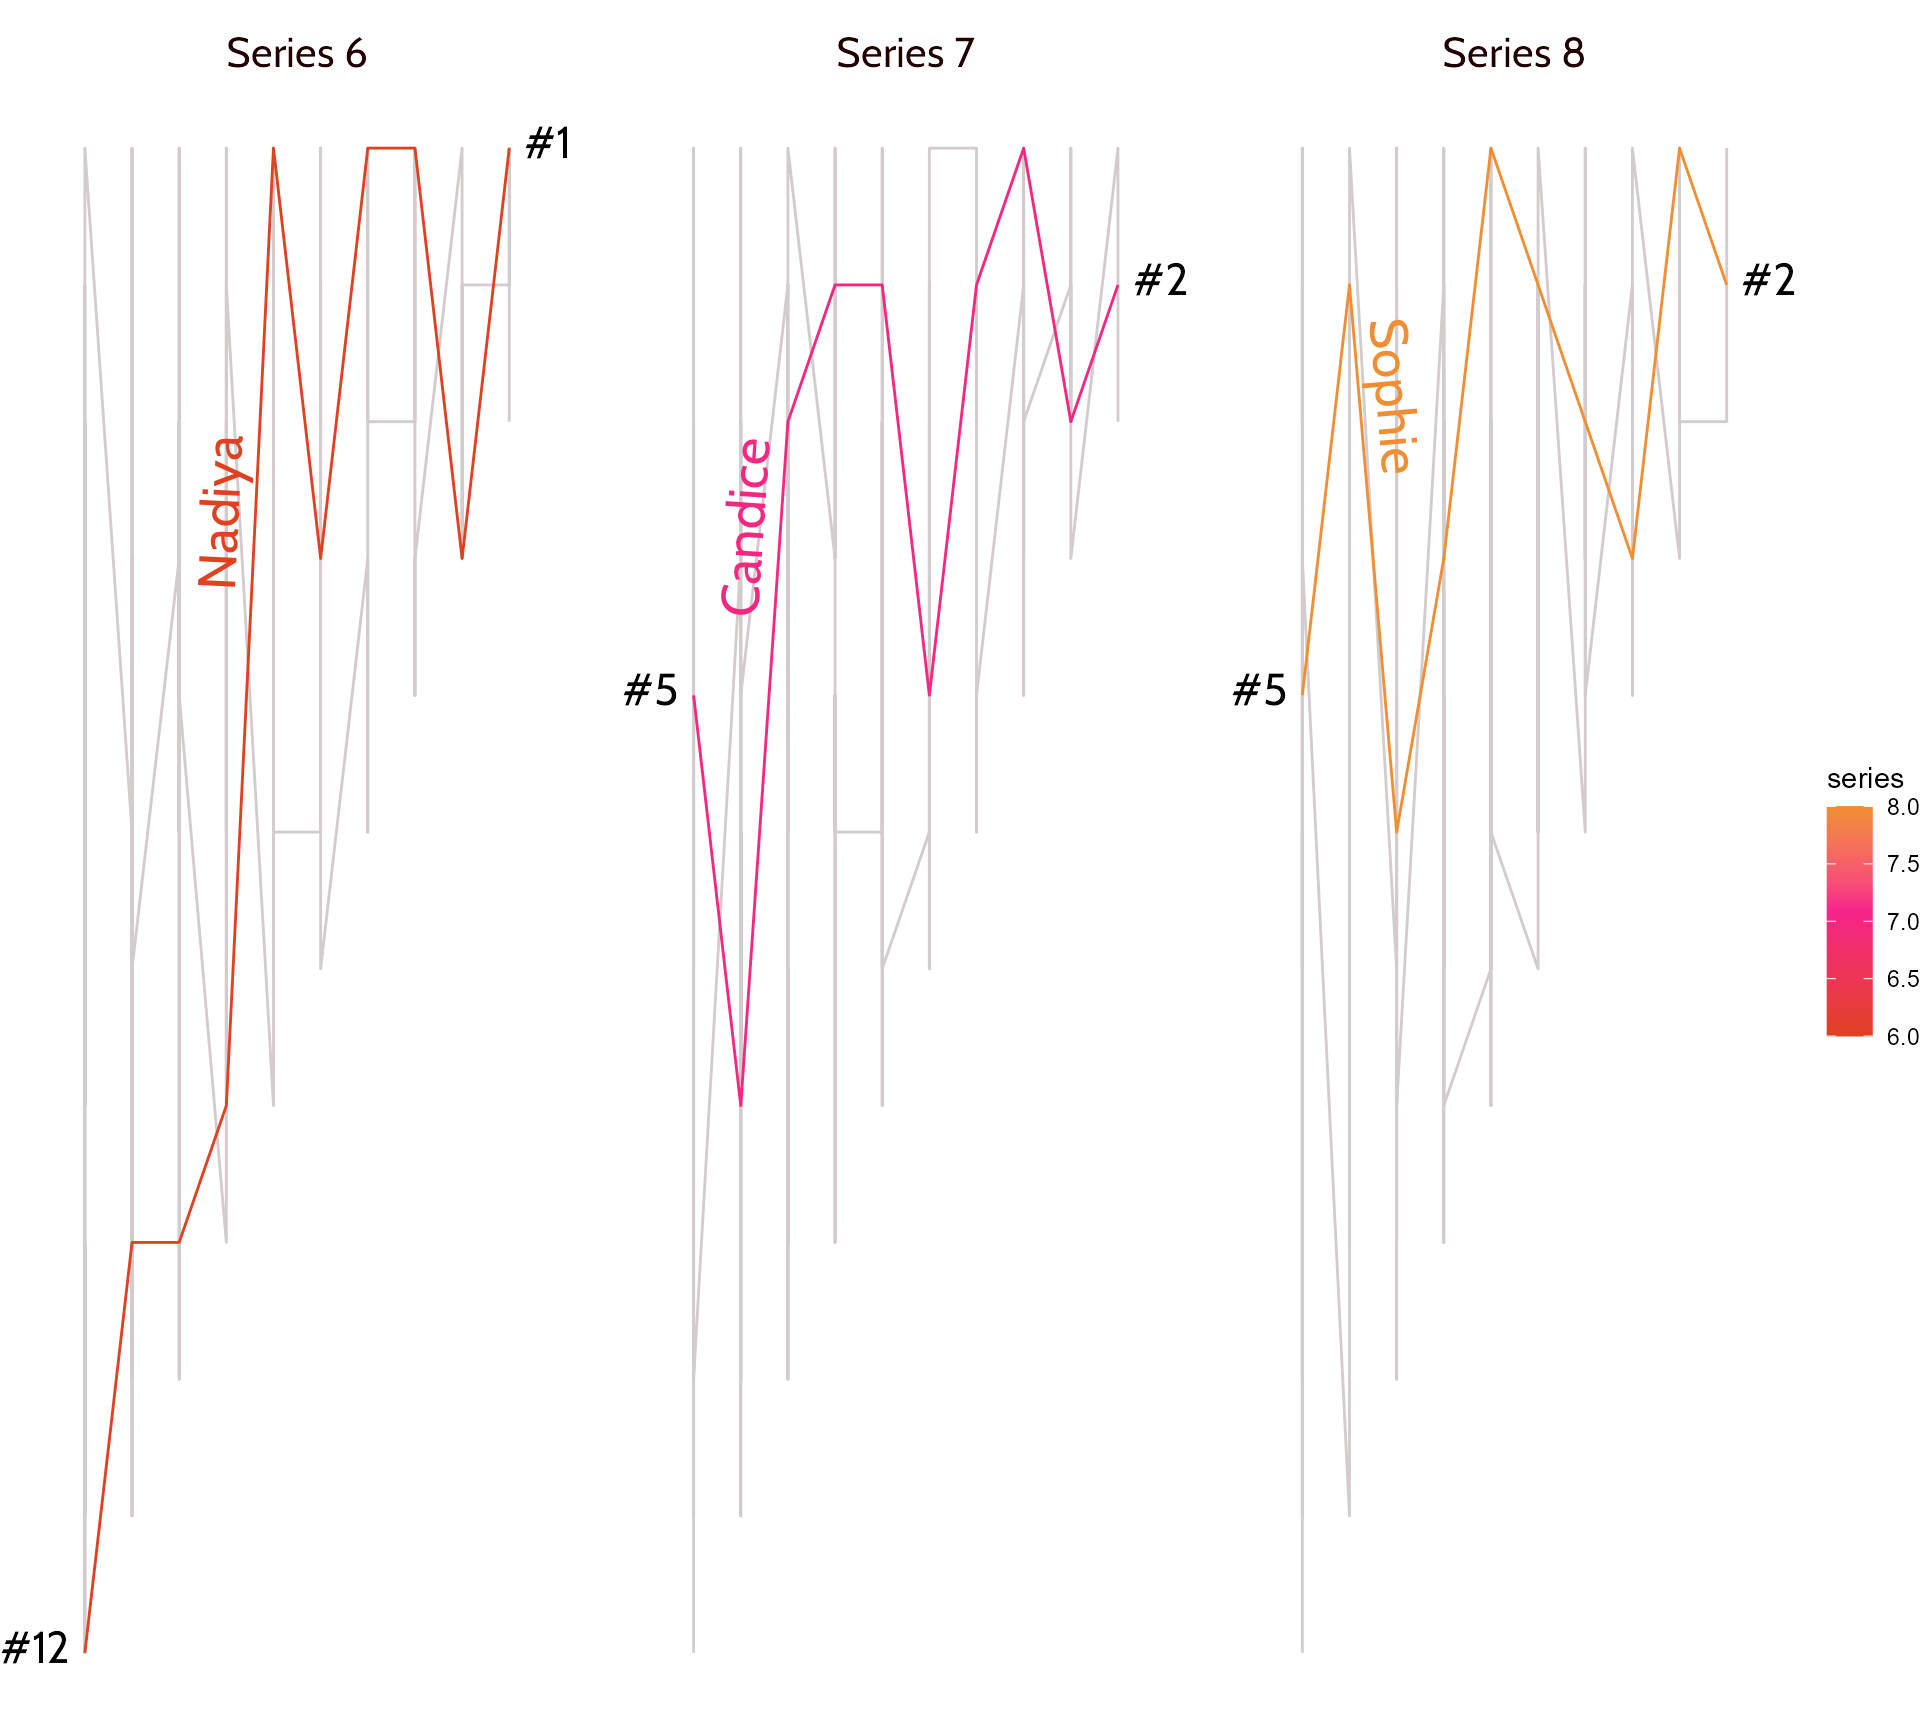
#5 Tie your text to the data
Use colour!
bakeoff::bakes_raw %>%
filter(series %in% c(6:8)) %>%
left_join(bakeoff::bakers %>%
filter(series_winner == 1)) %>%
ggplot(aes(x = episode,
y = -technical)) +
geom_path(aes(colour = series),
show.legend = FALSE) +
gghighlight::gghighlight(series_winner == 1,
calculate_per_facet = TRUE,
unhighlighted_params = list(color = "#D2CCCC")) +
scale_colour_gradient2(low = "#e04121", mid = "#f7238a",
high = "#ed9e00", midpoint = 7.1) +
facet_grid(. ~ series, labeller = as_labeller(function(x) paste("Series", x))) +
geomtextpath::geom_textpath(aes(label = baker,
colour = series),
vjust = -0.2,text_only = TRUE,
hjust = 0.3,
size = 7,
family = "Cabin",
show.legend = FALSE) +
ggtext::geom_textbox(data = bakeoff::bakes_raw %>%
filter(series %in% c(6:8)) %>%
left_join(bakeoff::bakers %>%
filter(series_winner == 1)) %>%
filter(series_winner == 1,
episode %in% c(1, 10)),
aes(label = paste0("#", technical),
hjust = case_when(episode == 1 ~ 1,
TRUE ~ 0),
halign = case_when(episode == 1 ~ 1,
TRUE ~ 0),
colour = series),
box.colour = NA,
size = 6,
family = "Cabin",
fill = NA) +
scale_x_continuous(expand = expansion(0.2)) +
theme_void() +
theme(strip.text = element_text(family = "Cabin", colour = "#200000",
size = 16,
margin = margin(c(12, 0, 0, 0))))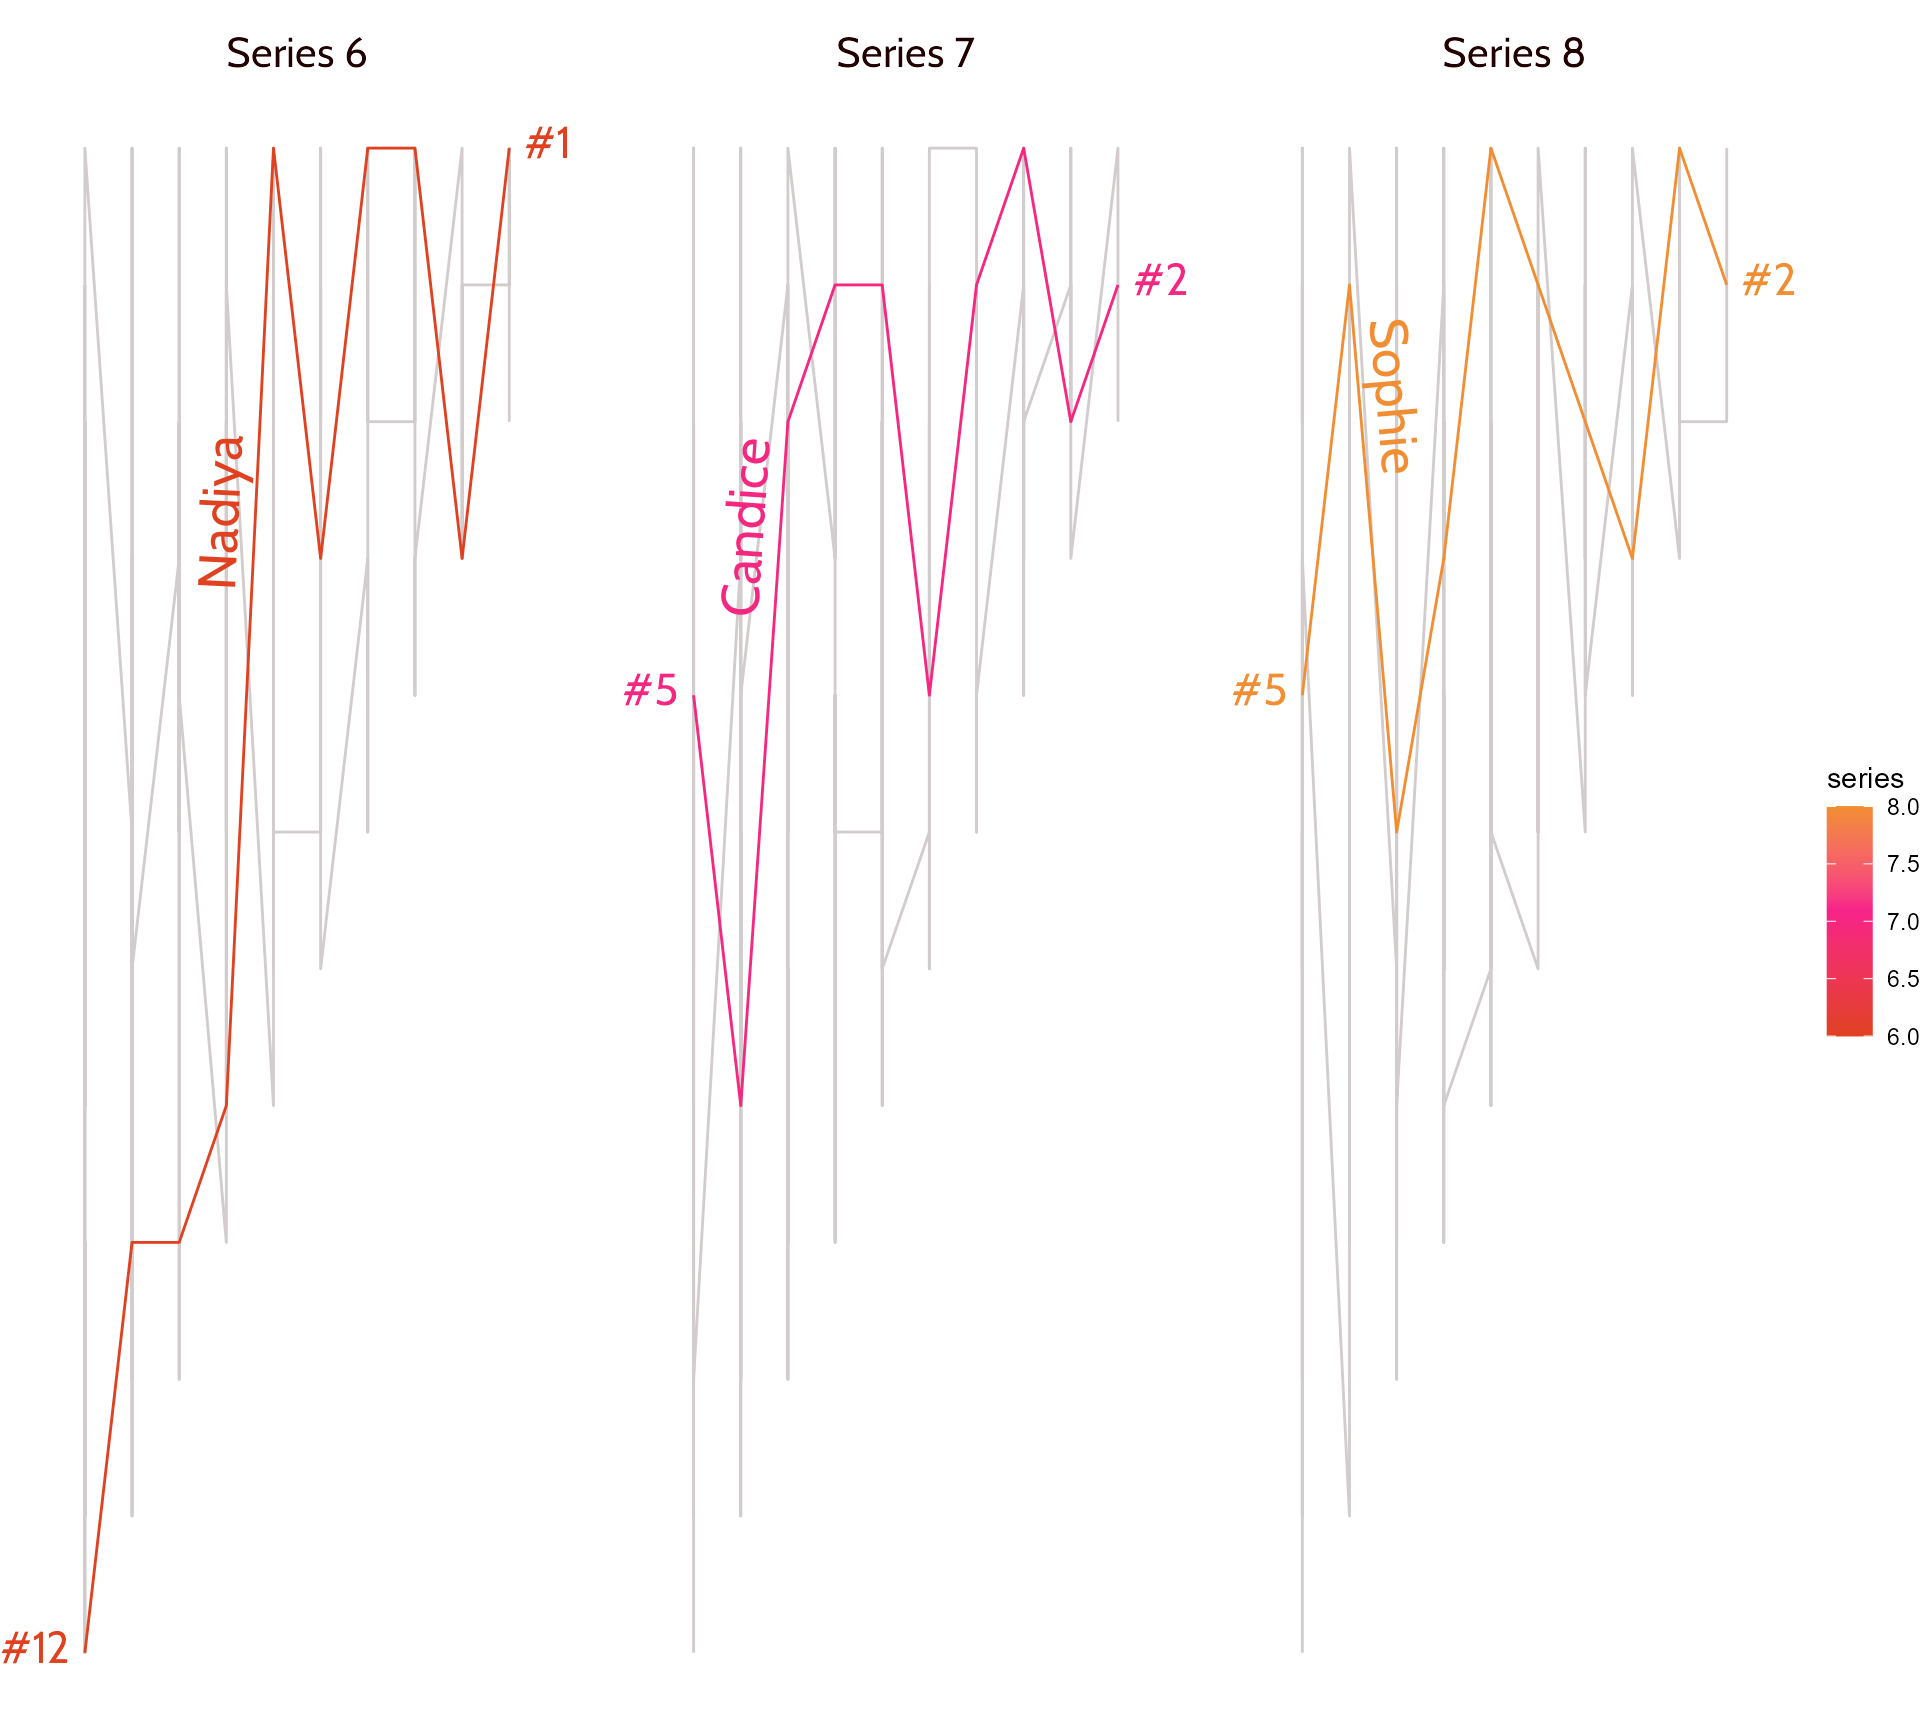
#5 Tie your text to the data
Use colour!
bakeoff::bakes_raw %>%
filter(series %in% c(6:8)) %>%
left_join(bakeoff::bakers %>%
filter(series_winner == 1)) %>%
ggplot(aes(x = episode,
y = -technical)) +
geom_path(aes(colour = series),
show.legend = FALSE) +
gghighlight::gghighlight(series_winner == 1,
calculate_per_facet = TRUE,
unhighlighted_params = list(color = "#D2CCCC")) +
scale_colour_gradient2(low = "#e04121", mid = "#f7238a",
high = "#ed9e00", midpoint = 7.1) +
facet_grid(. ~ series, labeller = as_labeller(function(x) paste("Series", x))) +
geomtextpath::geom_textpath(aes(label = baker,
colour = series),
vjust = -0.2,text_only = TRUE,
hjust = 0.3,
size = 7,
family = "Cabin",
show.legend = FALSE) +
ggtext::geom_textbox(data = bakeoff::bakes_raw %>%
filter(series %in% c(6:8)) %>%
left_join(bakeoff::bakers %>%
filter(series_winner == 1)) %>%
filter(series_winner == 1,
episode %in% c(1, 10)),
aes(label = paste0("#", technical),
hjust = case_when(episode == 1 ~ 1,
TRUE ~ 0),
halign = case_when(episode == 1 ~ 1,
TRUE ~ 0),
colour = series),
box.colour = NA,
size = 6,
family = "Cabin",
fill = NA) +
scale_x_continuous(expand = expansion(0.2)) +
theme_void() +
theme(strip.text = element_text(family = "Cabin", colour = "#200000",
size = 16,
margin = margin(c(12, 0, 0, 0))),
legend.position = "none")
#5 Tie your text to the data
#7 Signpost additional information
Time to get interactive! {ggiraph}

ggiraph::girafe()
- Show the main data story
- Allow people to access the detail they’re interested in
- Show them lots of information about one thing
- … rather than indigestible information about everything
- Keep the ggplot styling you’ve worked hard to get right
- Tweak a few extra things
#7 Signpost additional information
A (relatively easy) technical challenge
bakeoff::challenges %>%
select(-technical) %>%
pivot_longer(c(signature, showstopper)) %>%
mutate(choc_raspberry = case_when(grepl("[Cc]hocolate", value) & grepl("[Rr]aspberr", value) ~ "Both",
grepl("[Cc]hocolate", value) == T ~ "Chocolate",
grepl("[Rr]aspberry", value) == T ~ "Raspberry")) %>%
filter(!is.na(choc_raspberry)) %>%
ggplot() +
geom_rect(aes(xmin = -Inf, ymin = -Inf, xmax = Inf, ymax = Inf), fill = "#300300") +
geom_jitter(aes(x = 1, y = 1),
alpha = 0.7,
shape = 21,
size = 10,
colour = "#ec3f24",
fill = "#b41504") +
coord_polar() +
scale_colour_identity() +
scale_y_discrete(expand = c(0.05, 0)) +
labs(title = "Chocolate & Raspberry Bakes") +
theme_void() +
theme(plot.title = element_text(family = "Cabin", size = 24,
colour = "#200000", hjust = 0.5,
lineheight = 1.3))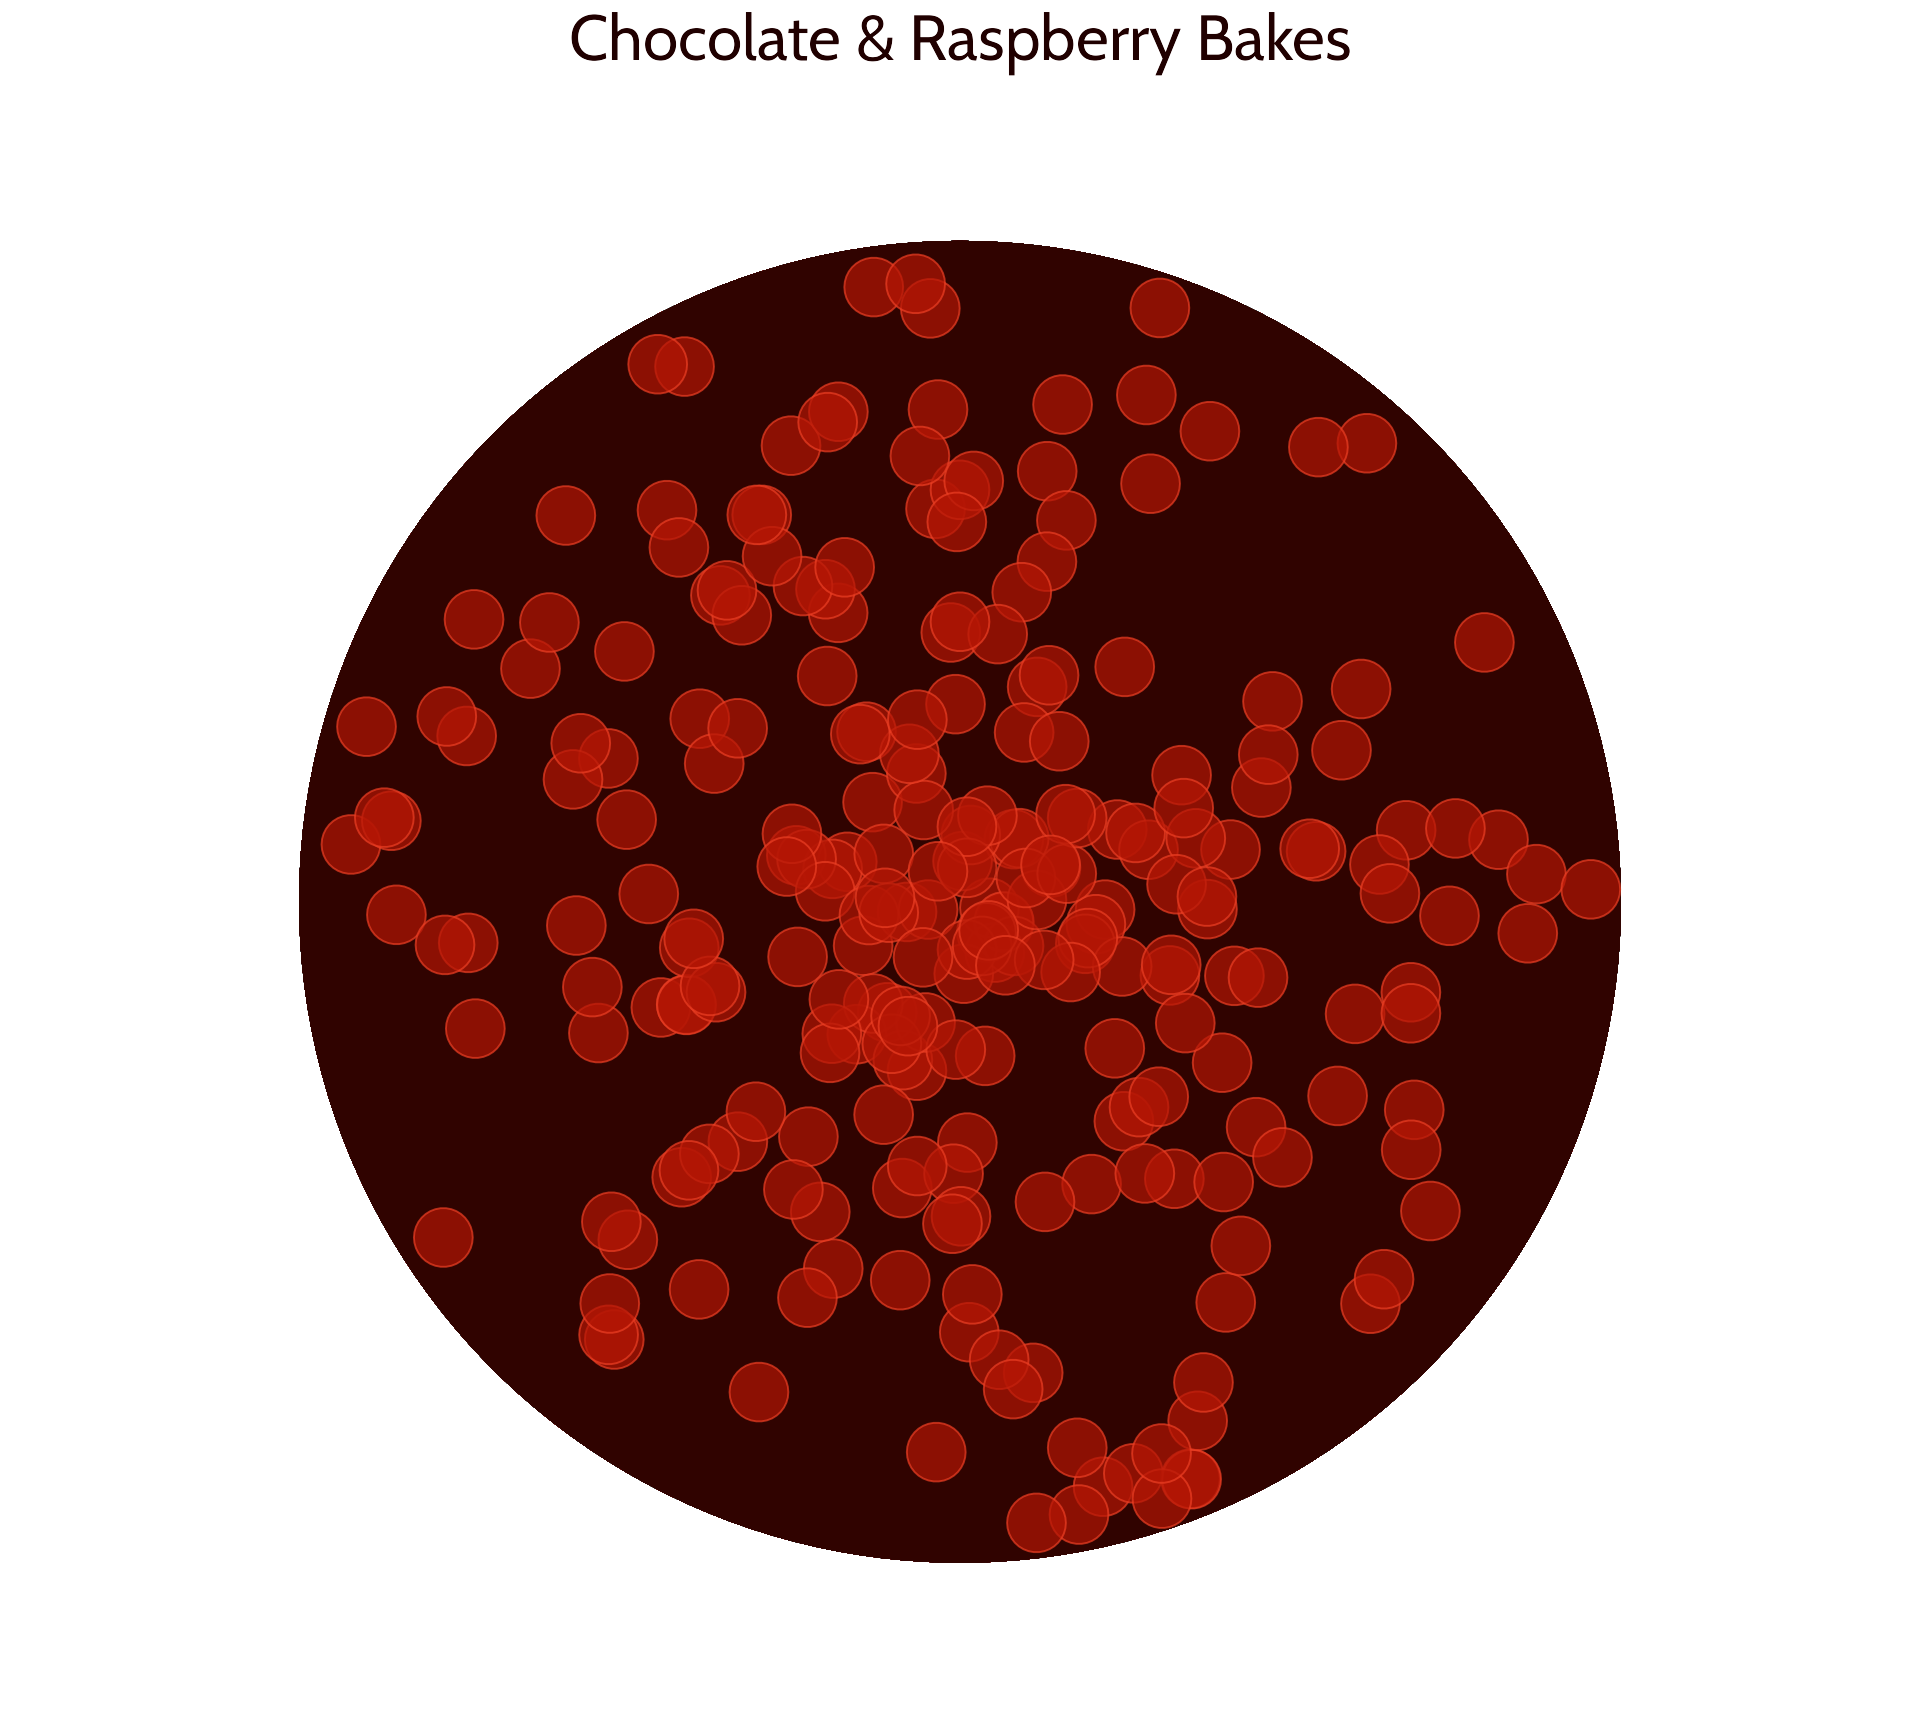
#10 Give everything space to breathe
Back to the start

#10 Give everything space to breathe
Add plot margin

#10 Give everything space to breathe
Increase lineheight
#10 Give everything space to breathe
Add margin under subtitle
#10 Give everything space to breathe


Over to you