Risky Viz!
Cara R Thompson, PhD | R!SK Conference 2026
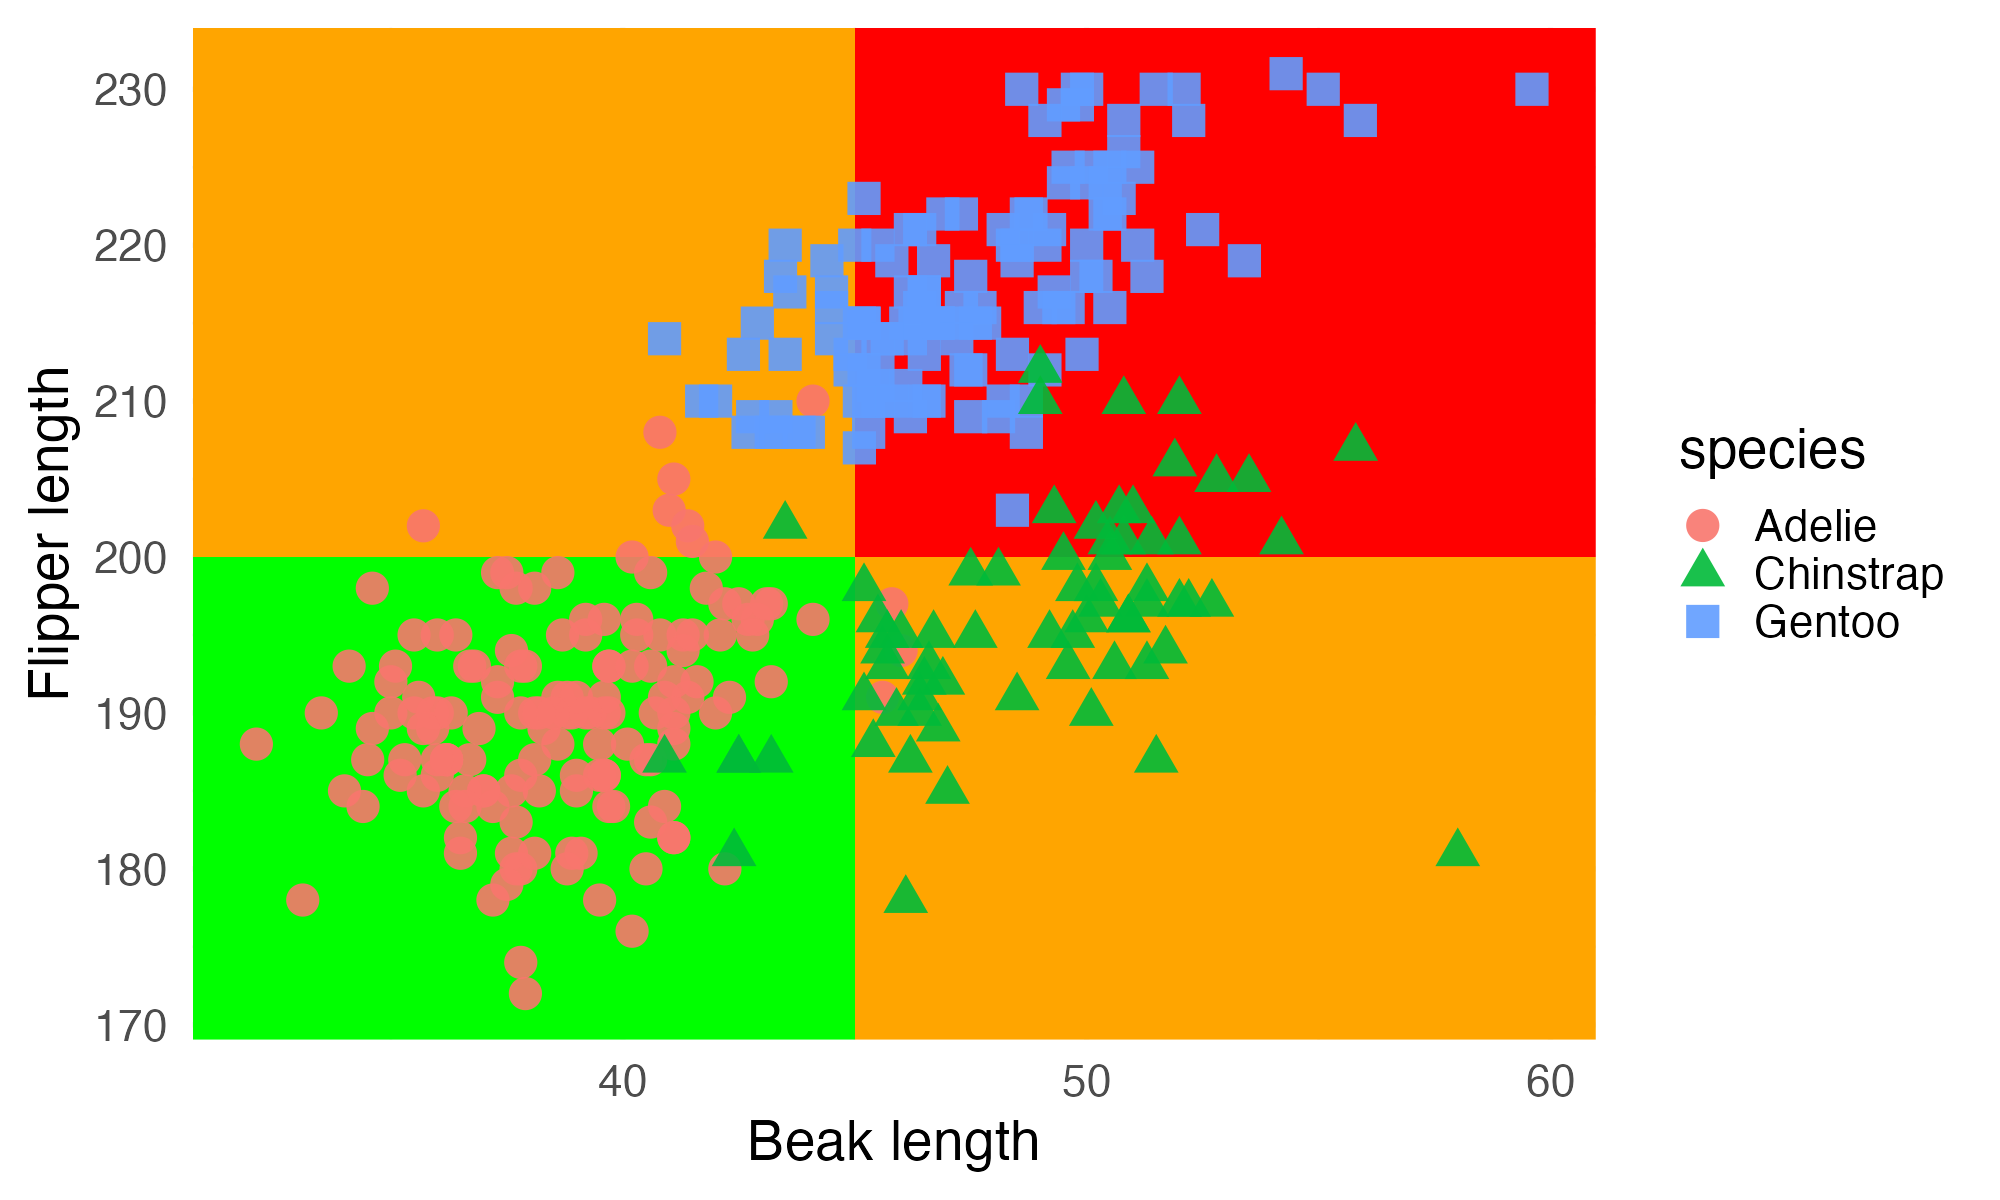
Fix 1: What’s the focus?
What do the users need to know?
Fix 1: What’s the focus?
What do the users need to know?
penguins |>
ggplot() +
annotate(
"rect",
xmin = 50,
xmax = Inf,
ymin = -Inf,
ymax = Inf,
fill = alpha("red", 0.3)
) +
ggtext::geom_textbox(
data = data.frame(),
aes(x = 50, y = Inf, label = "*Beaks > 50 mm*"),
fill = NA,
box.colour = NA,
hjust = 0,
vjust = 1
) +
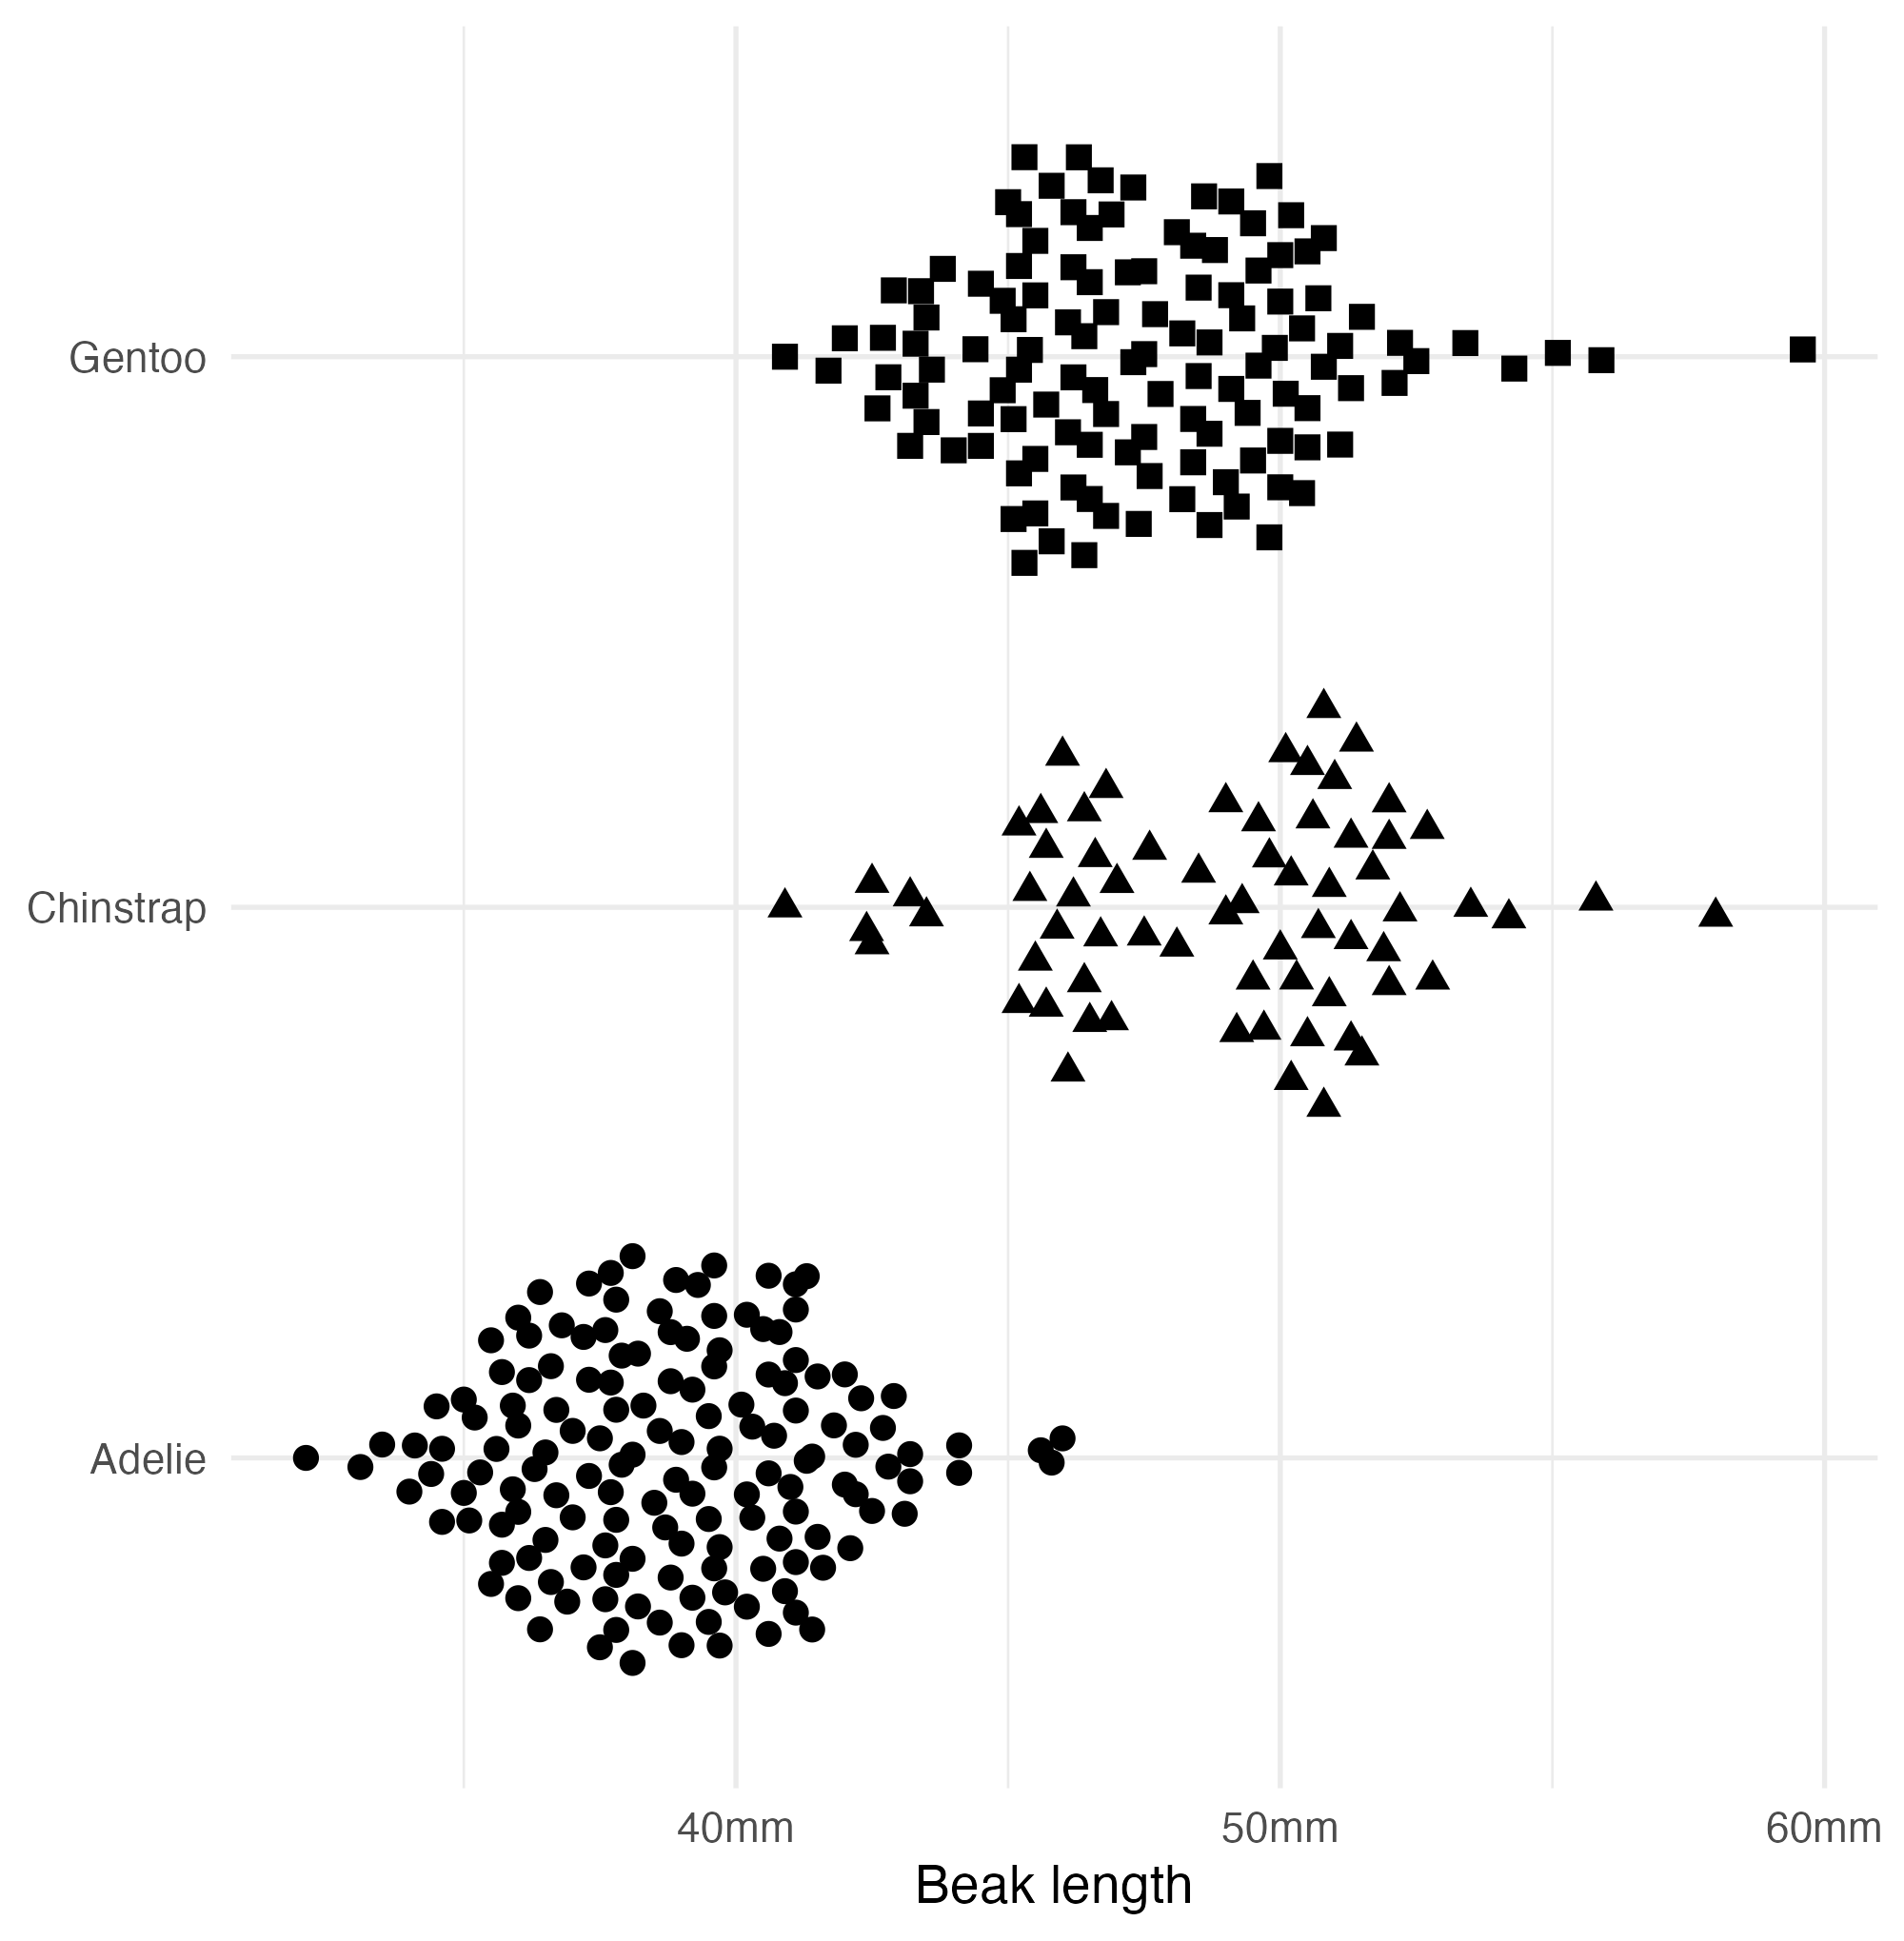
ggbeeswarm::geom_quasirandom(
aes(
x = bill_len,
y = species,
shape = species
),
size = 4
) +
labs(x = "Beak length") +
scale_x_continuous(label = function(x) paste0(x, "mm")) +
scale_shape(guide = "none") +
theme(axis.title.y = element_blank())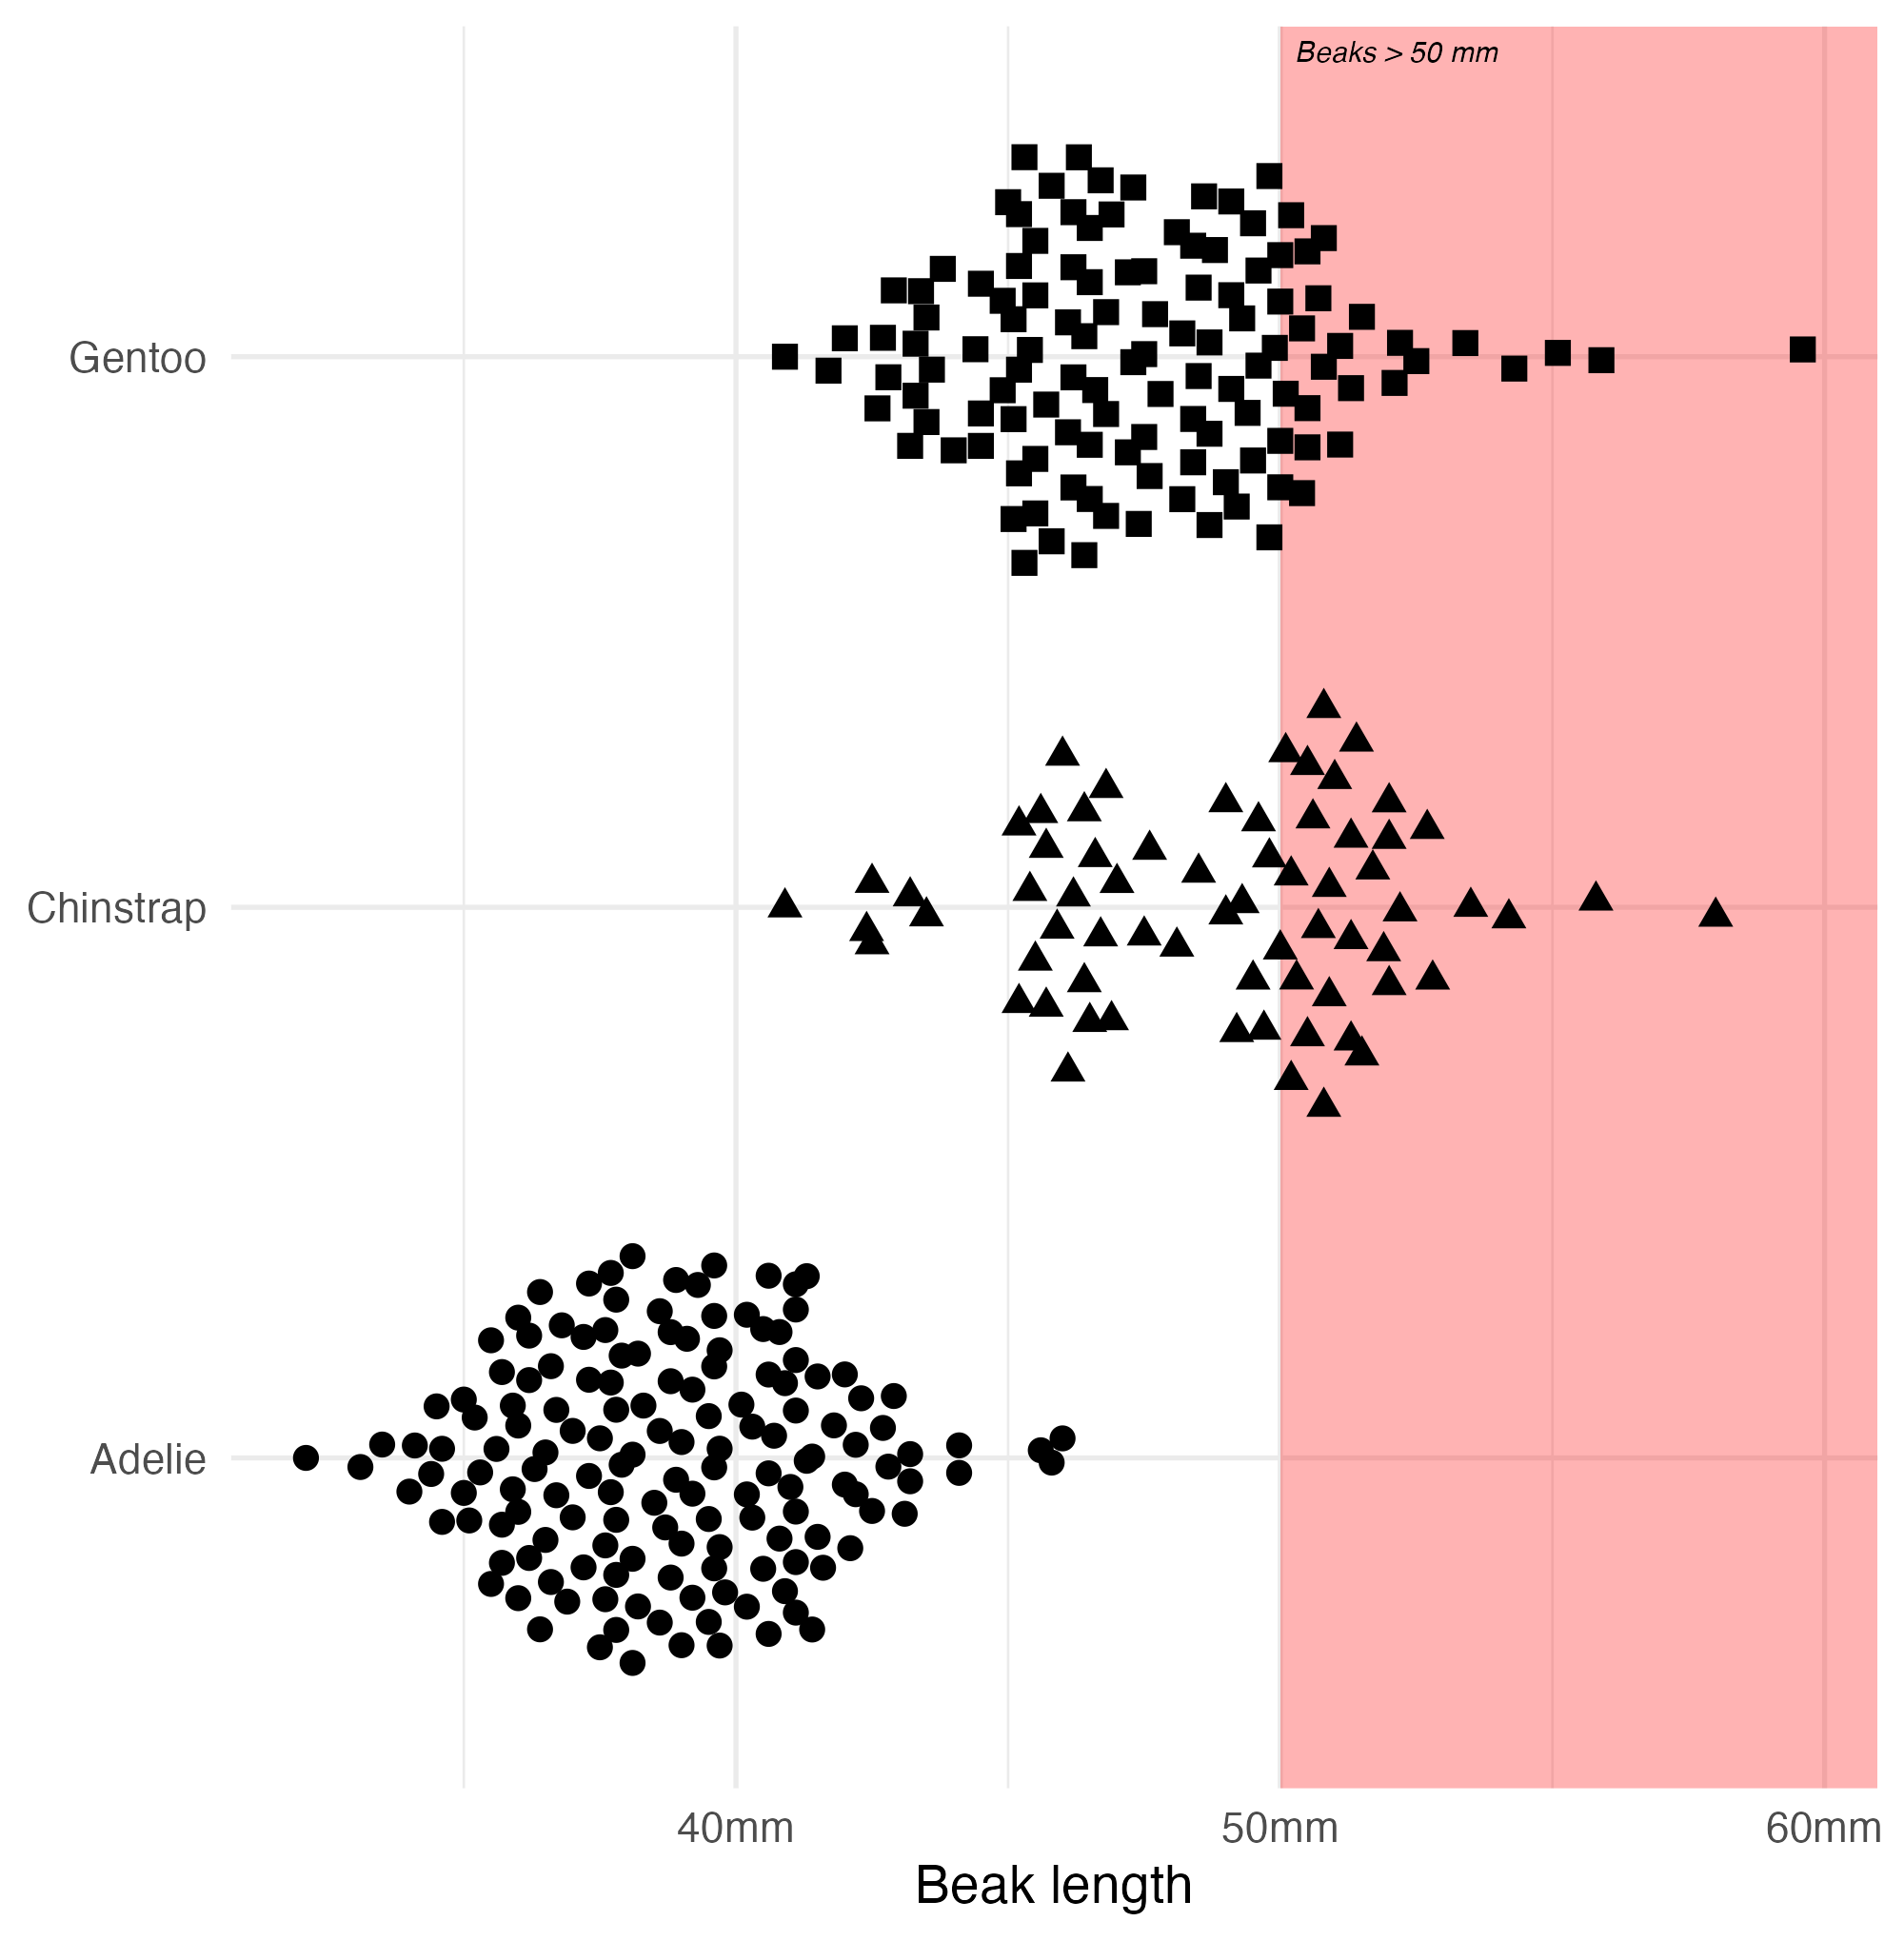
Fix 1: What’s the focus?
What do the users need to know?
penguins |>
  ggplot() +
  annotate(
    "rect",
    xmin = 50,
    xmax = Inf,
    ymin = -Inf,
    ymax = Inf,
    fill = alpha("red", 0.3)
  ) +
  ggtext::geom_textbox(
    data = data.frame(),
    aes(x = 50, y = Inf, label = "*Beaks > 50 mm*"),
    fill = NA,
    box.colour = NA,
    hjust = 0,
    vjust = 1
  ) +
  ggbeeswarm::geom_quasirandom(
    aes(
      x = bill_len,
      y = species,
      shape = species,
      colour = flipper_len
    ),
    size = 4
  ) +
  labs(x = "Beak length") +
  scale_x_continuous(label = function(x) paste0(x, "mm")) +
  scale_colour_gradient2(
    low = "#008000",
    mid = "orange",
    high = "red"
  ) +
  scale_shape(guide = "none") +
  theme(axis.title.y = element_blank())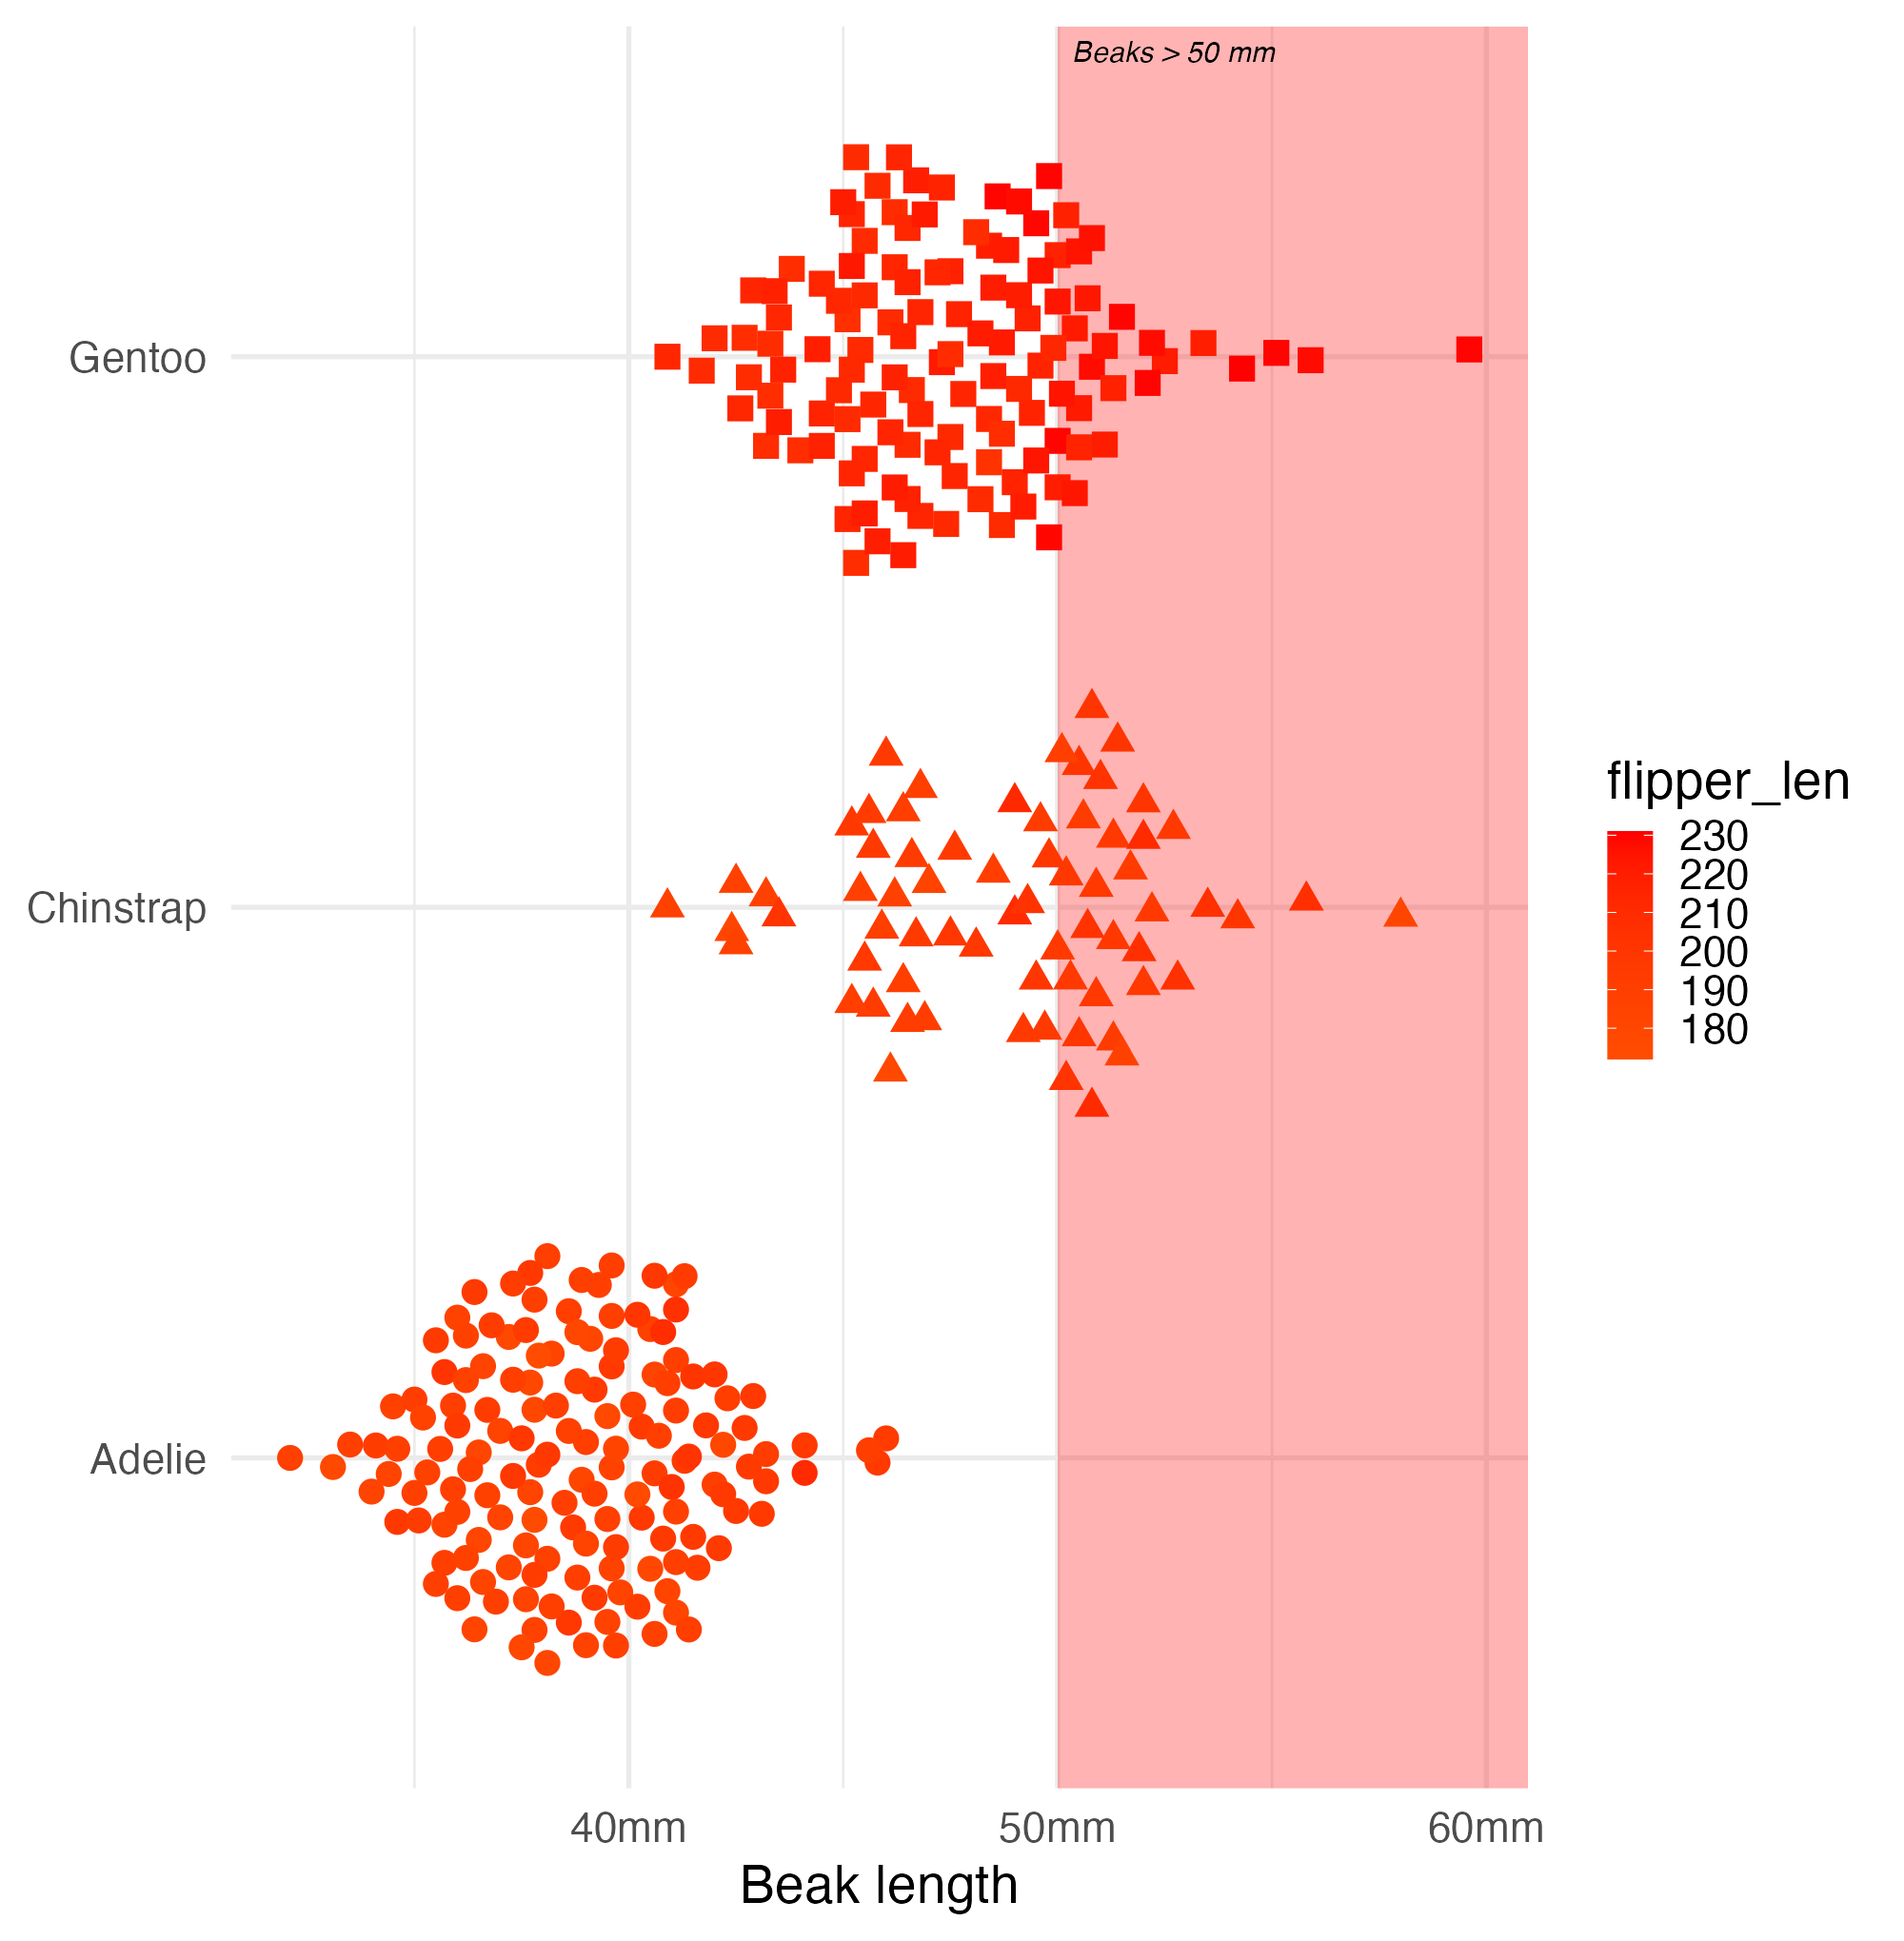
Fix 1: What’s the focus?
What do the users need to know?
penguins |>
  ggplot() +
  annotate(
    "rect",
    xmin = 50,
    xmax = Inf,
    ymin = -Inf,
    ymax = Inf,
    fill = alpha("red", 0.3)
  ) +
  ggtext::geom_textbox(
    data = data.frame(),
    aes(x = 50, y = Inf, label = "*Beaks > 50 mm*"),
    fill = NA,
    box.colour = NA,
    hjust = 0,
    vjust = 1
  ) +
  ggbeeswarm::geom_quasirandom(
    aes(
      x = bill_len,
      y = species,
      shape = species,
      colour = flipper_len
    ),
    size = 4
  ) +
  labs(x = "Beak length") +
  scale_x_continuous(label = function(x) paste0(x, "mm")) +
  scale_colour_gradient2(
    low = "#008000",
    mid = "orange",
    high = "red",
    midpoint = mean(penguins$flipper_len, na.rm = TRUE)
  ) +
  scale_shape(guide = "none") +
  theme(axis.title.y = element_blank())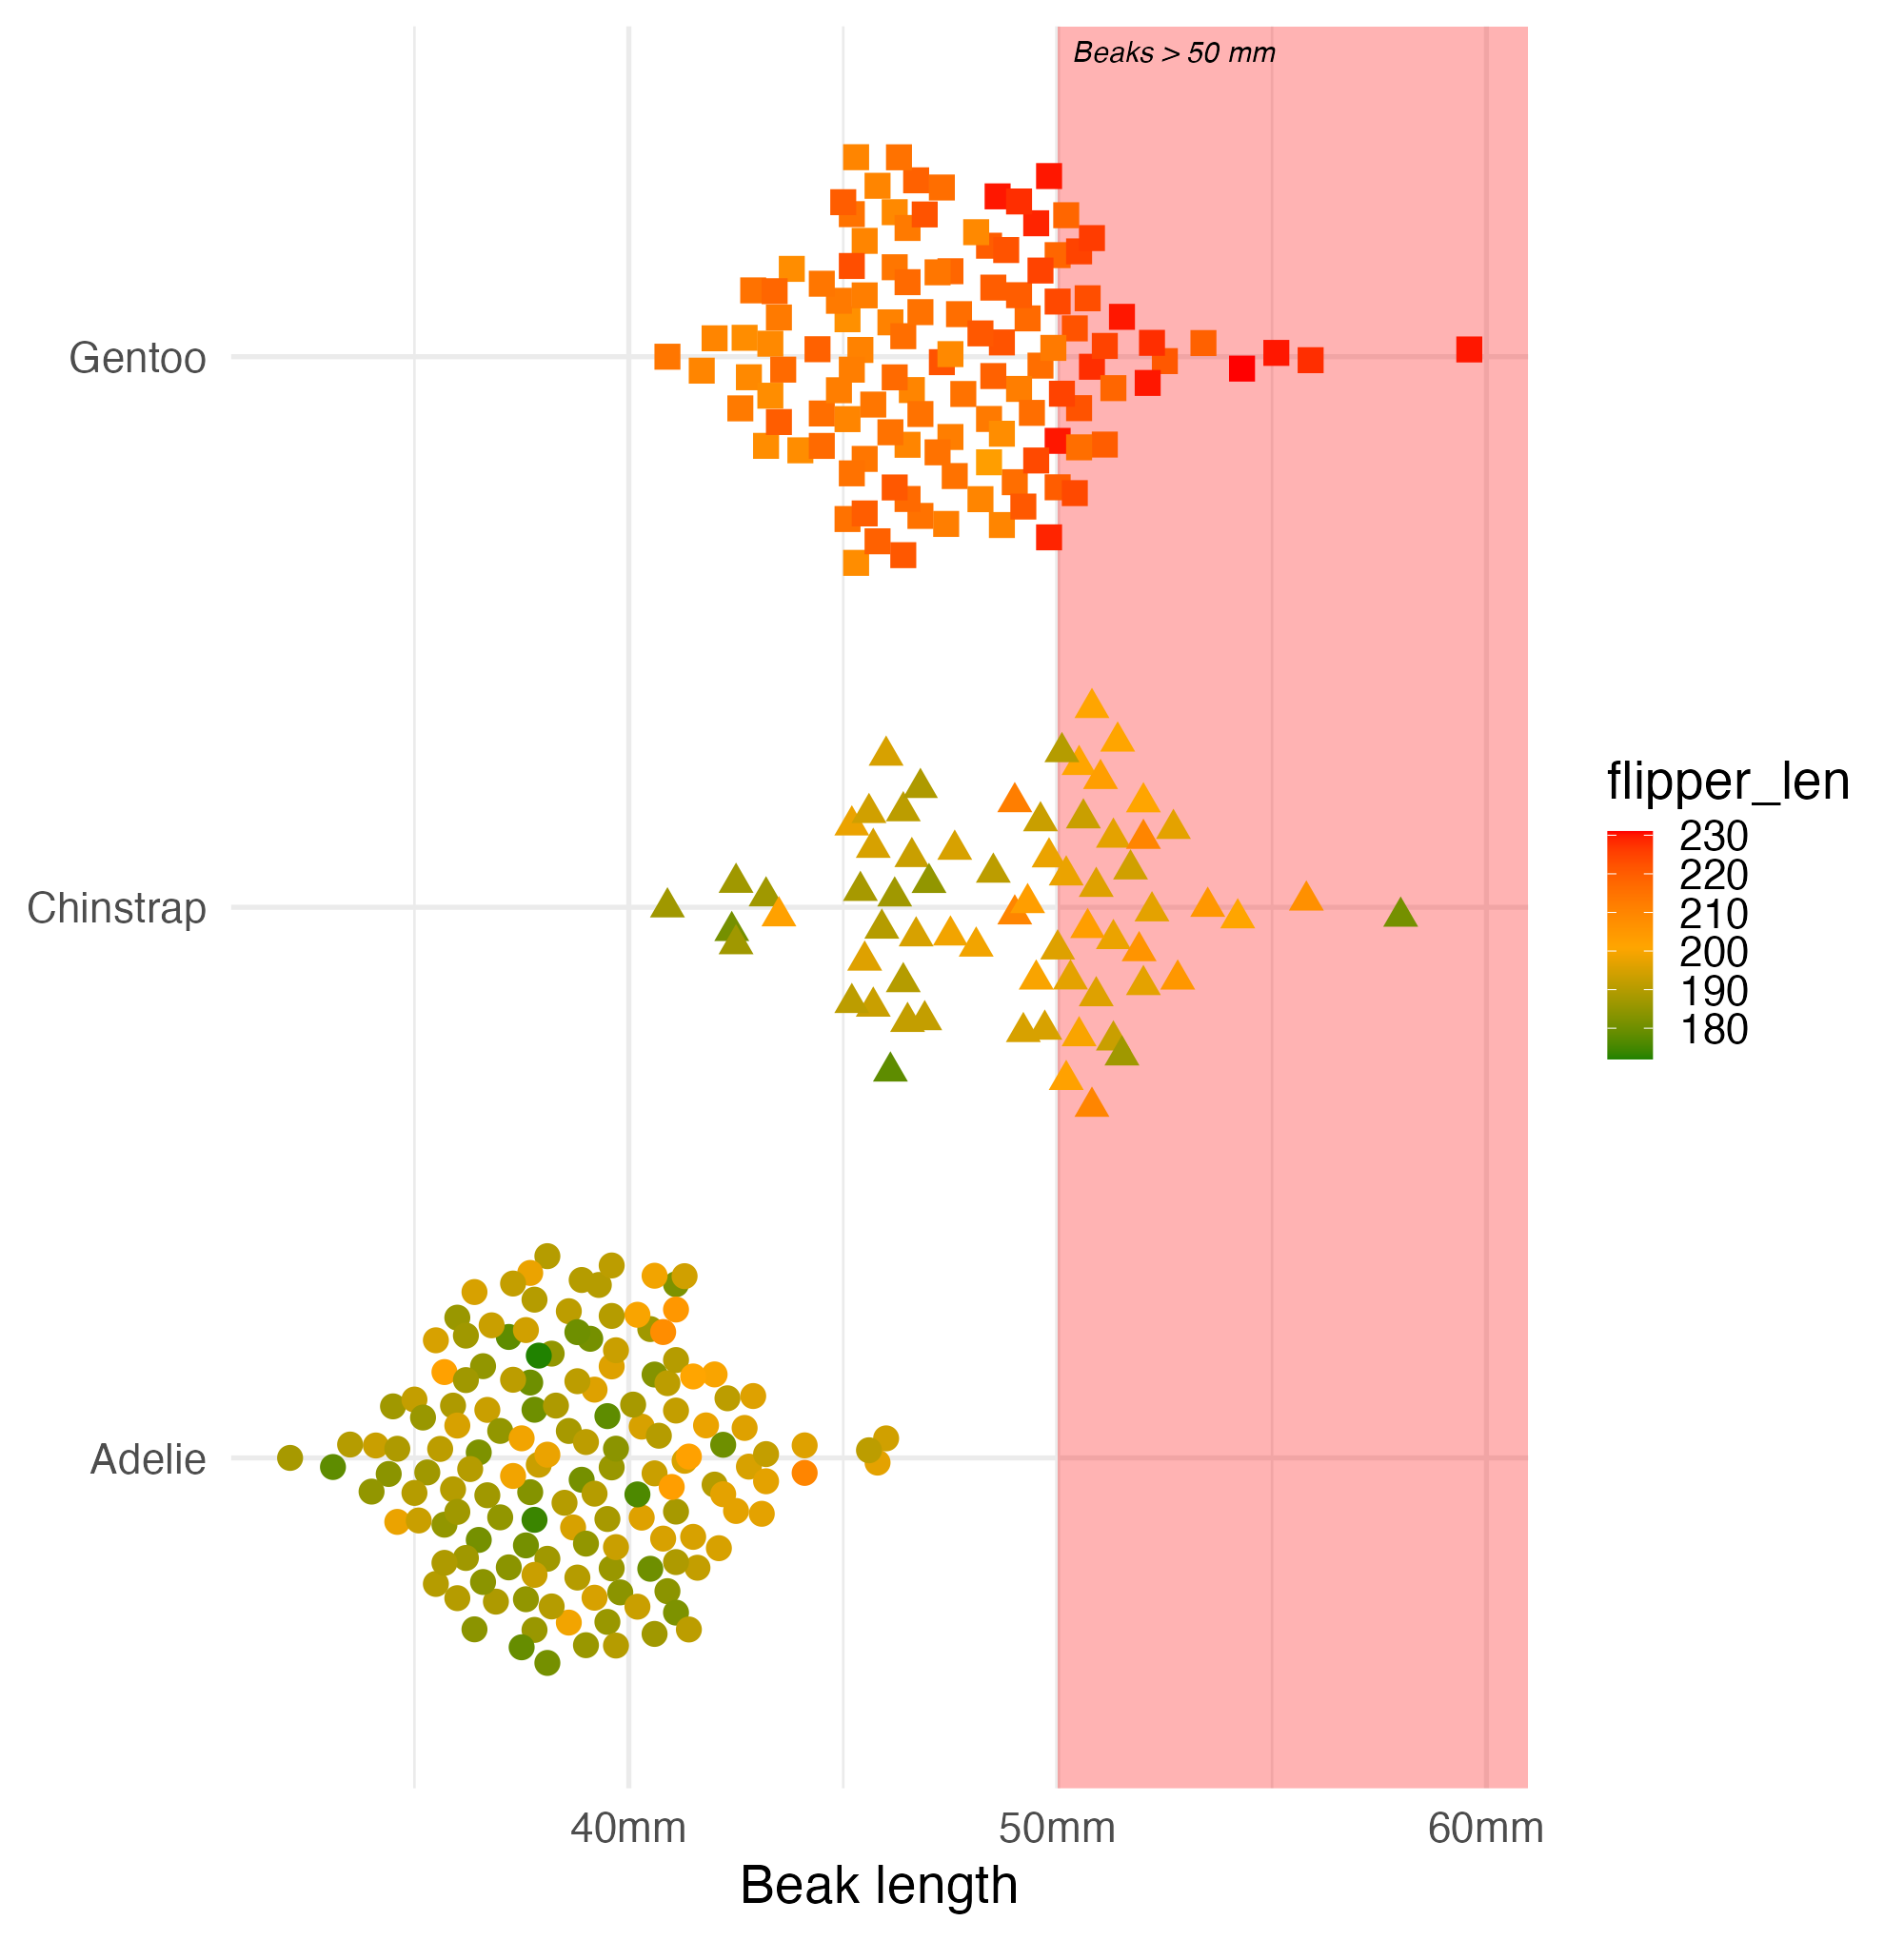
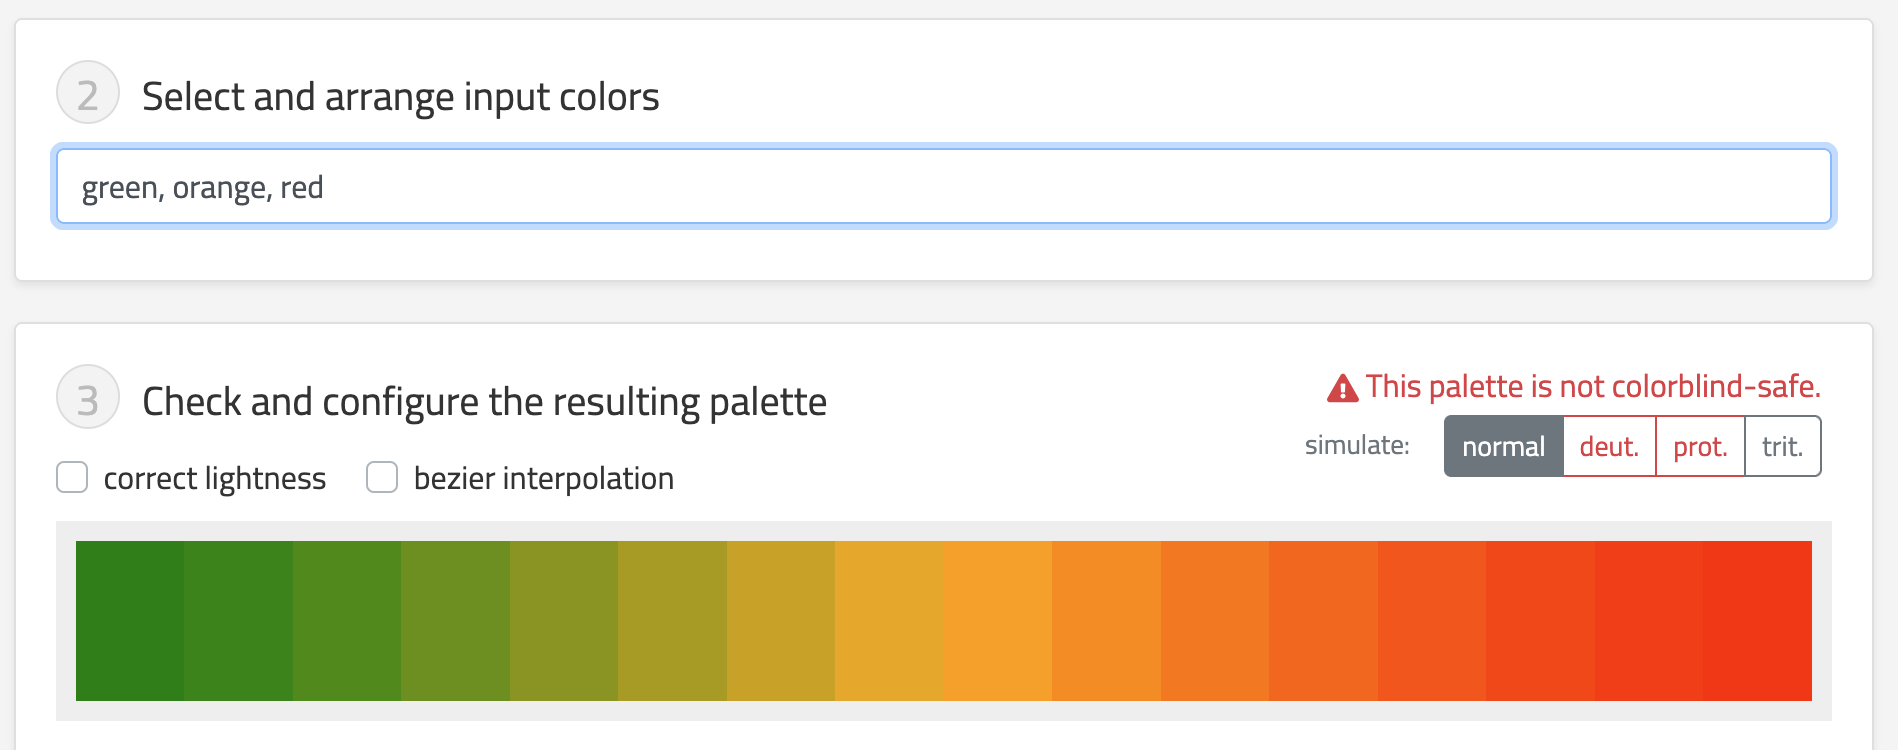
Fix 2: Colour accessibility
It looked nice but…
Fix 2: Colour accessibility
Fix 2: Colour accessibility
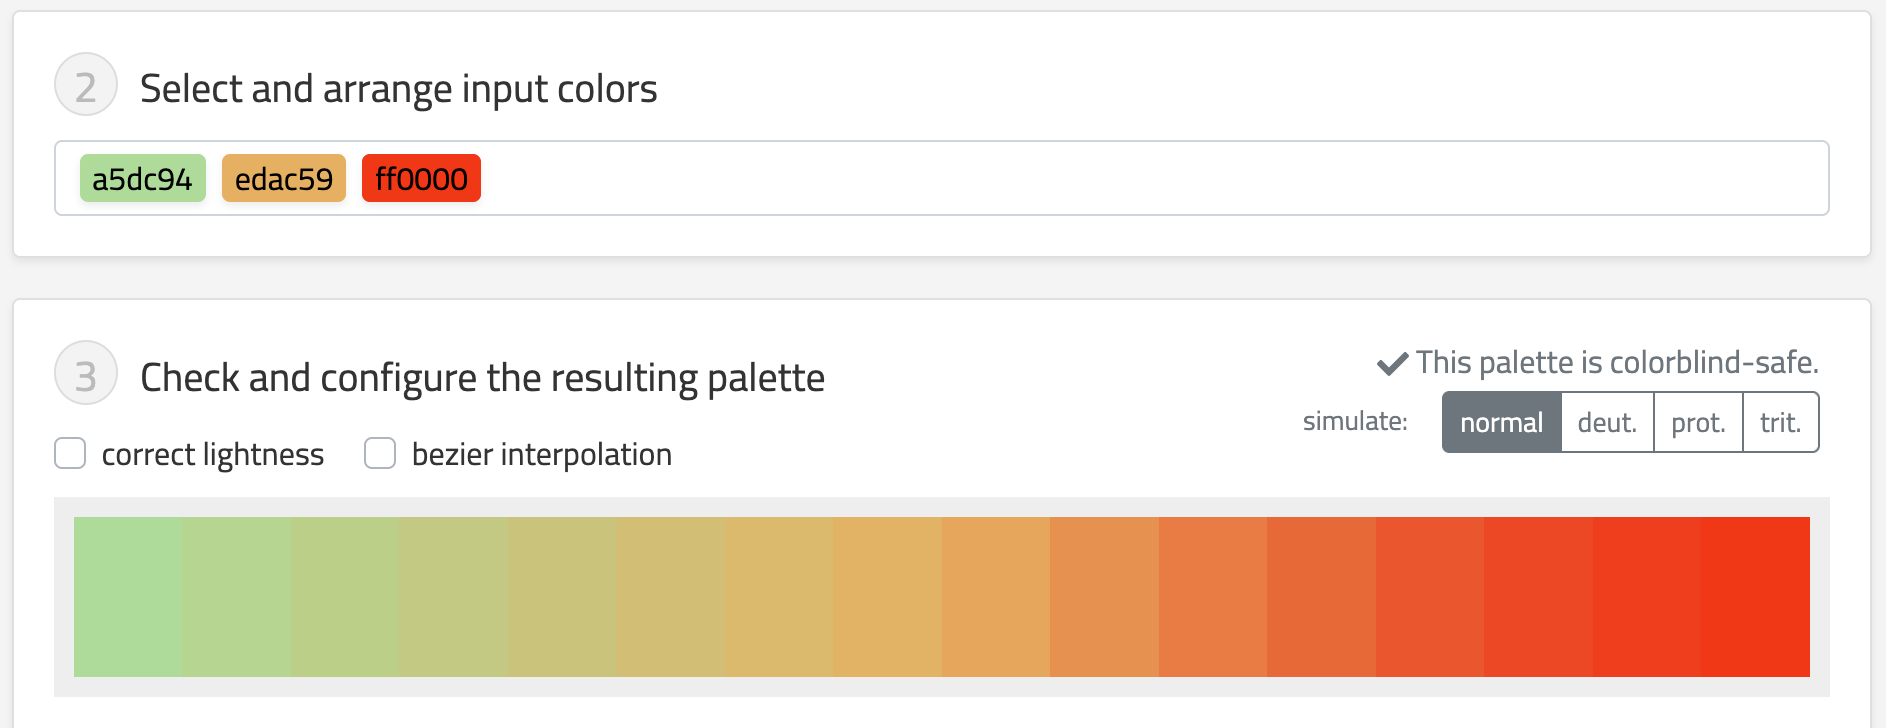
Mute your colours!
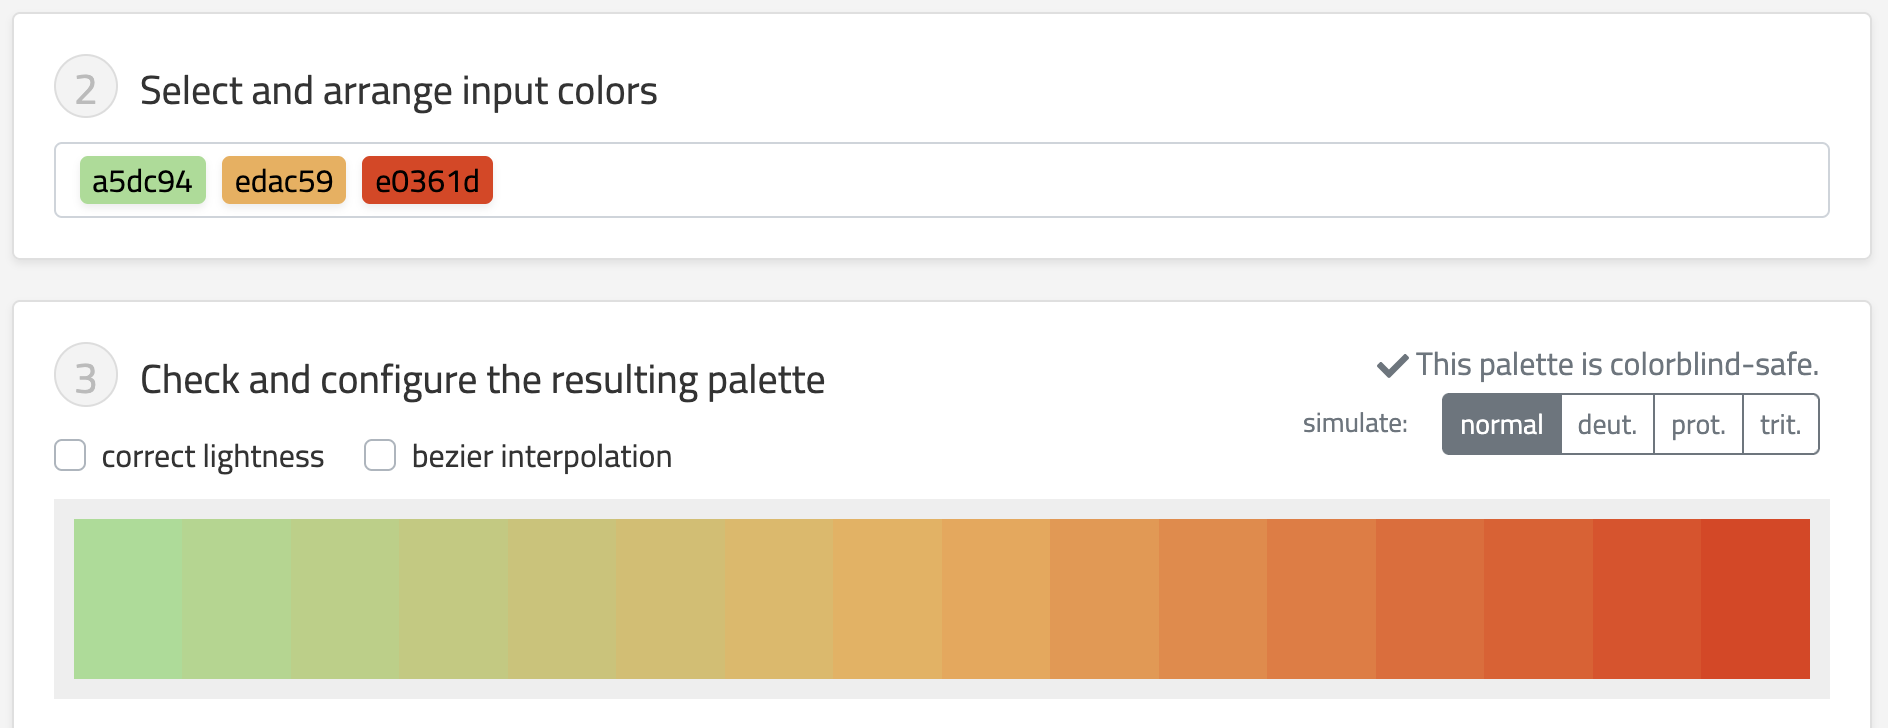
Fix 2: Colour accessibility
And check what it looks like to others
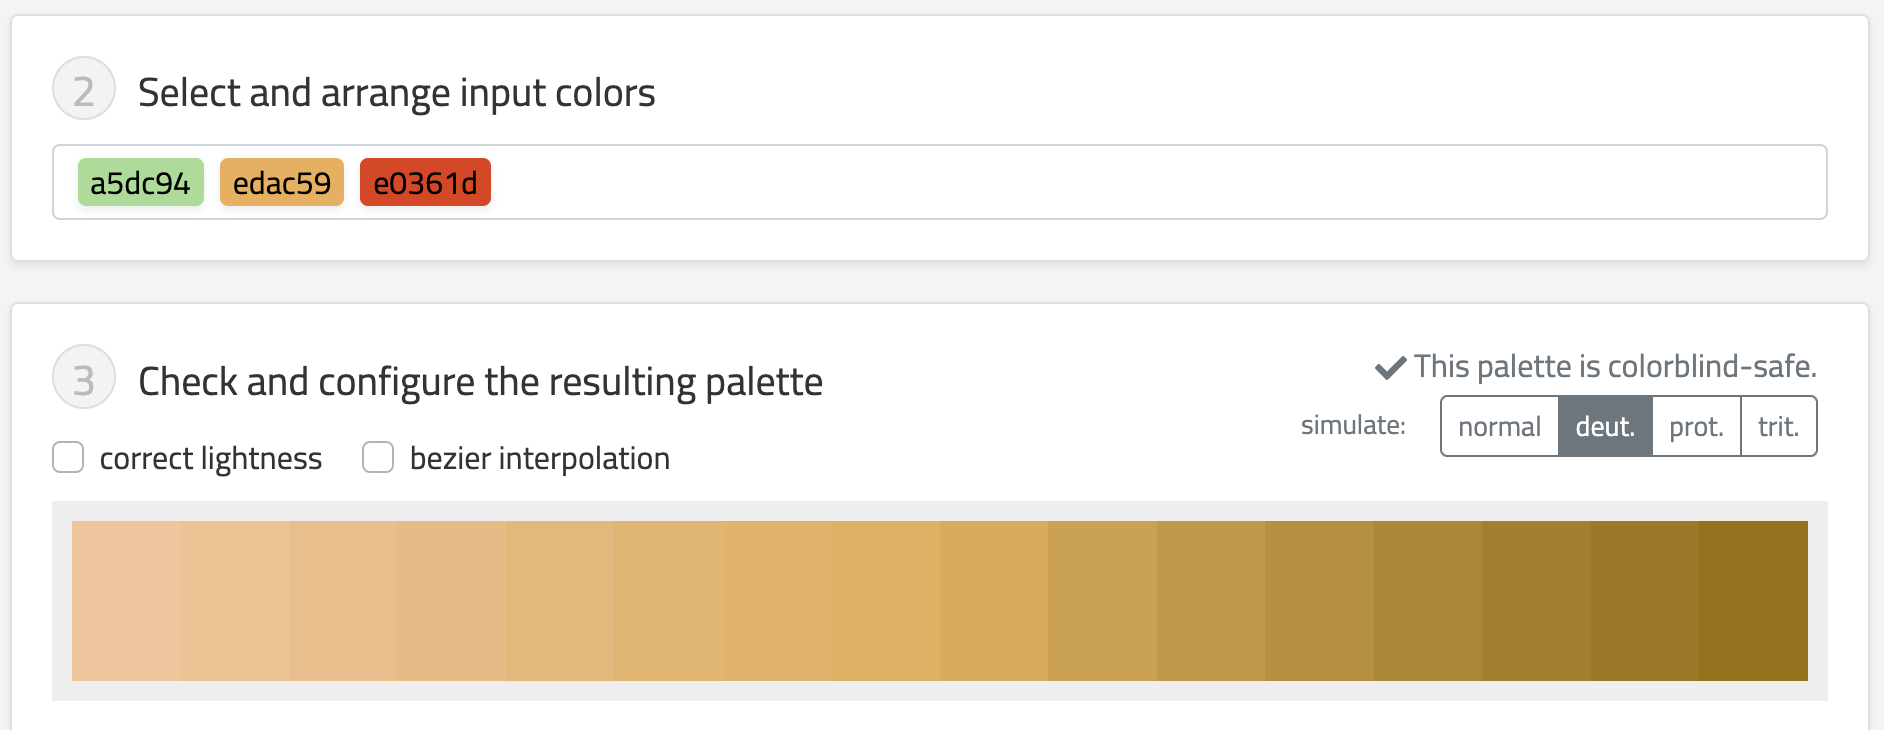
Fix 2: Colour accessibility
And check what it looks like to others
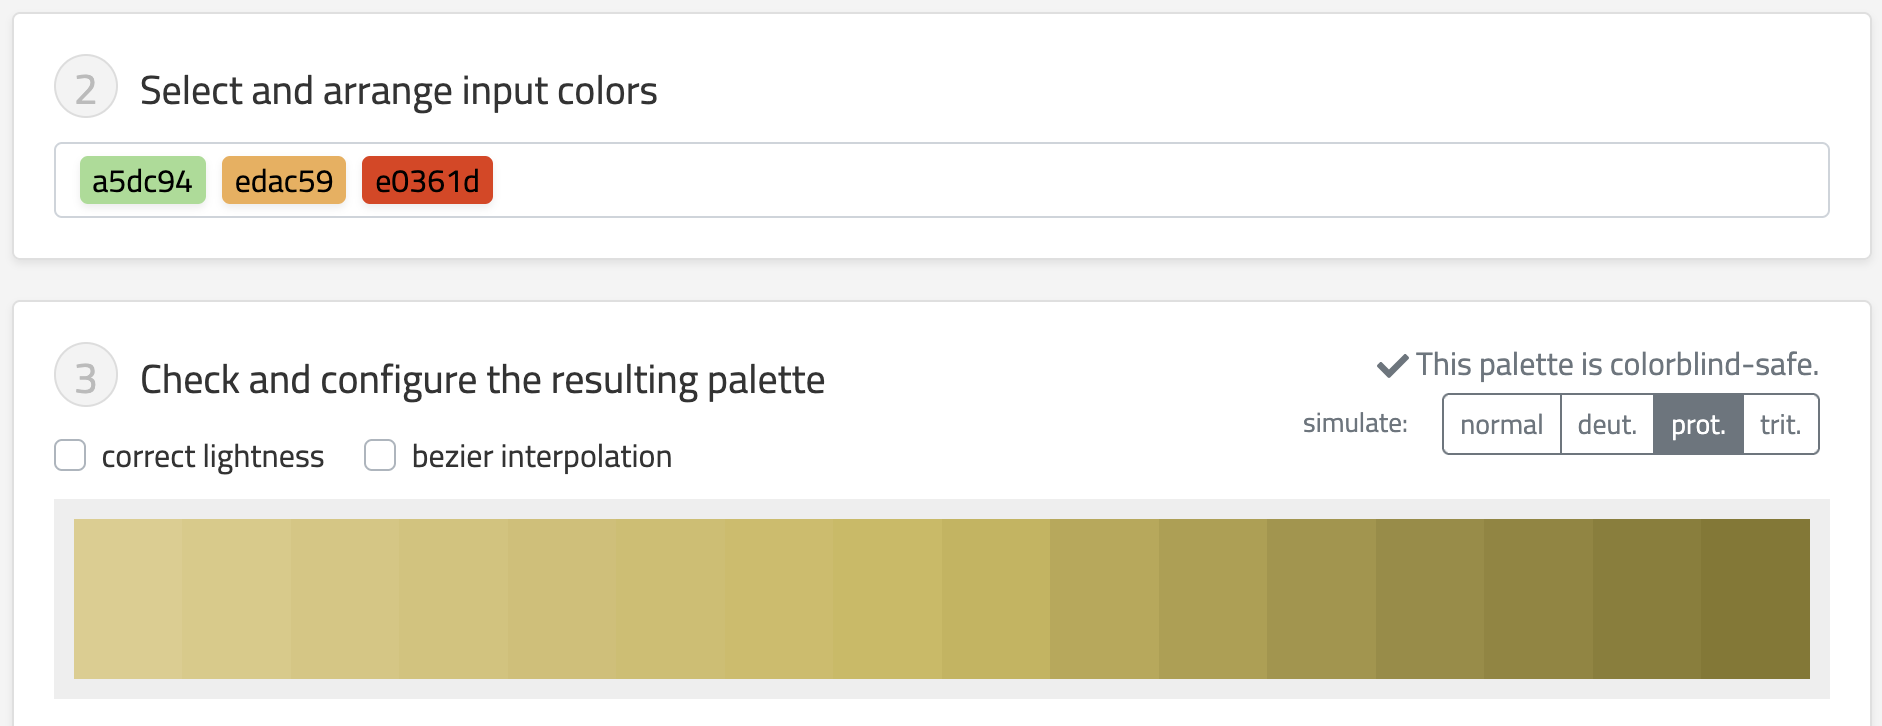
Fix 2: Colour accessibility
And check what it looks like to others
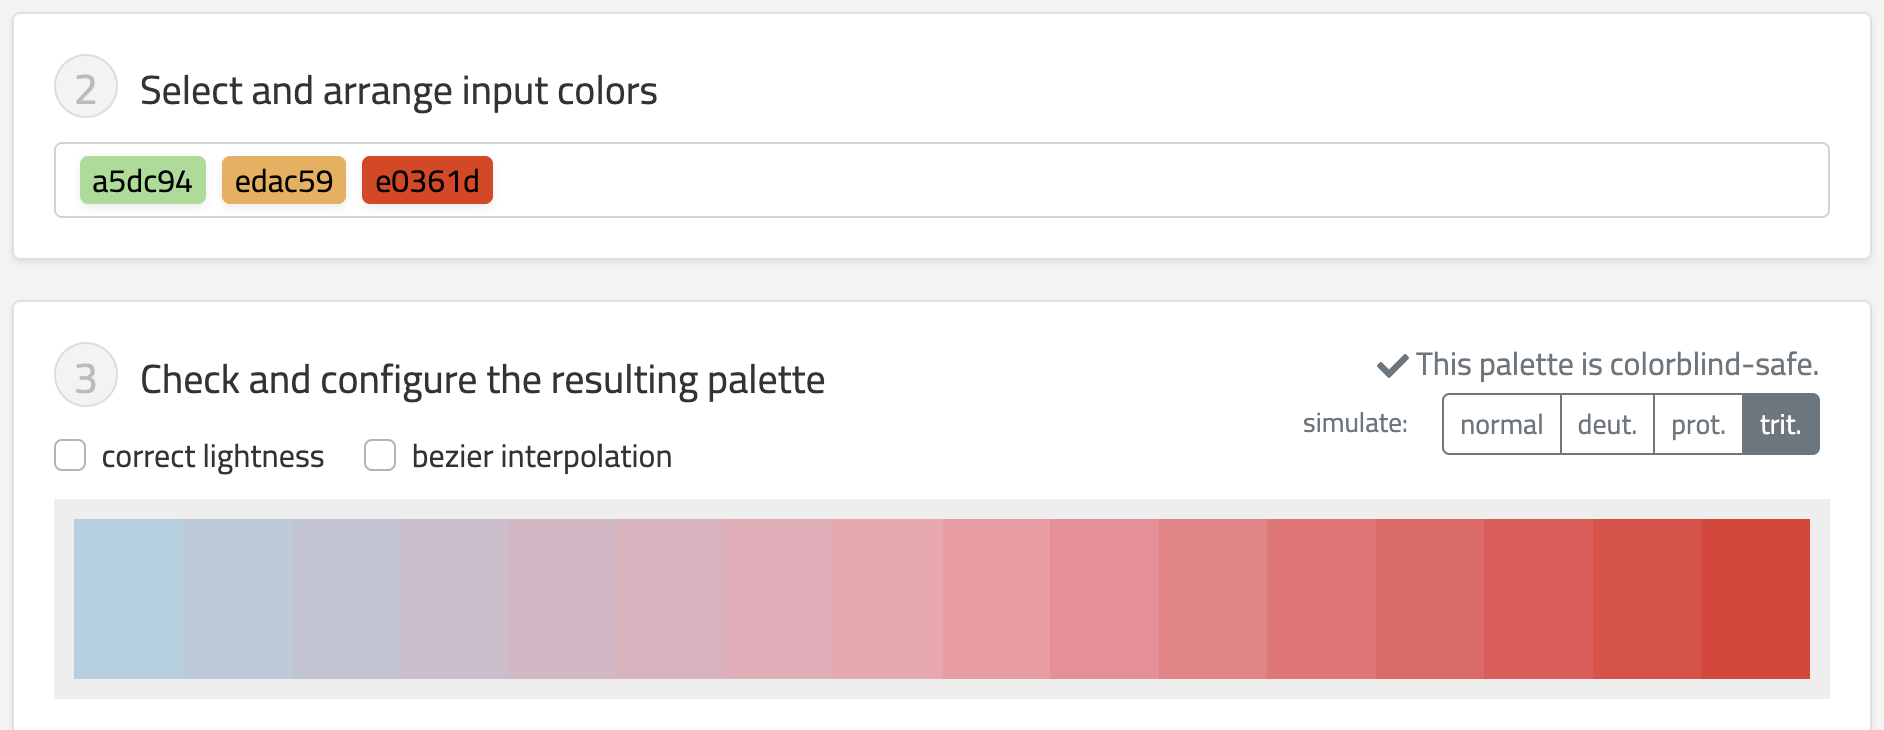
Fix 2: Colour accessibility
Let’s take a look!
penguins |>
  ggplot() +
  annotate(
    "rect",
    xmin = 50,
    xmax = Inf,
    ymin = -Inf,
    ymax = Inf,
    fill = alpha("red", 0.3)
  ) +
  ggtext::geom_textbox(
    data = data.frame(),
    aes(x = 50, y = Inf, label = "*Beaks > 50 mm*"),
    fill = NA,
    box.colour = NA,
    hjust = 0,
    vjust = 1
  ) +
  ggbeeswarm::geom_quasirandom(
    aes(
      x = bill_len,
      y = species,
      shape = species,
      colour = flipper_len
    ),
    size = 4
  ) +
  labs(x = "Beak length") +
  scale_x_continuous(label = function(x) paste0(x, "mm")) +
  scale_shape(guide = "none") +
  scale_colour_gradient2(
    low = "#a5dc94",
    mid = "#edac59",
    high = "#e0361d",
    midpoint = mean(penguins$flipper_len, na.rm = TRUE)
  ) +
  theme(axis.title.y = element_blank())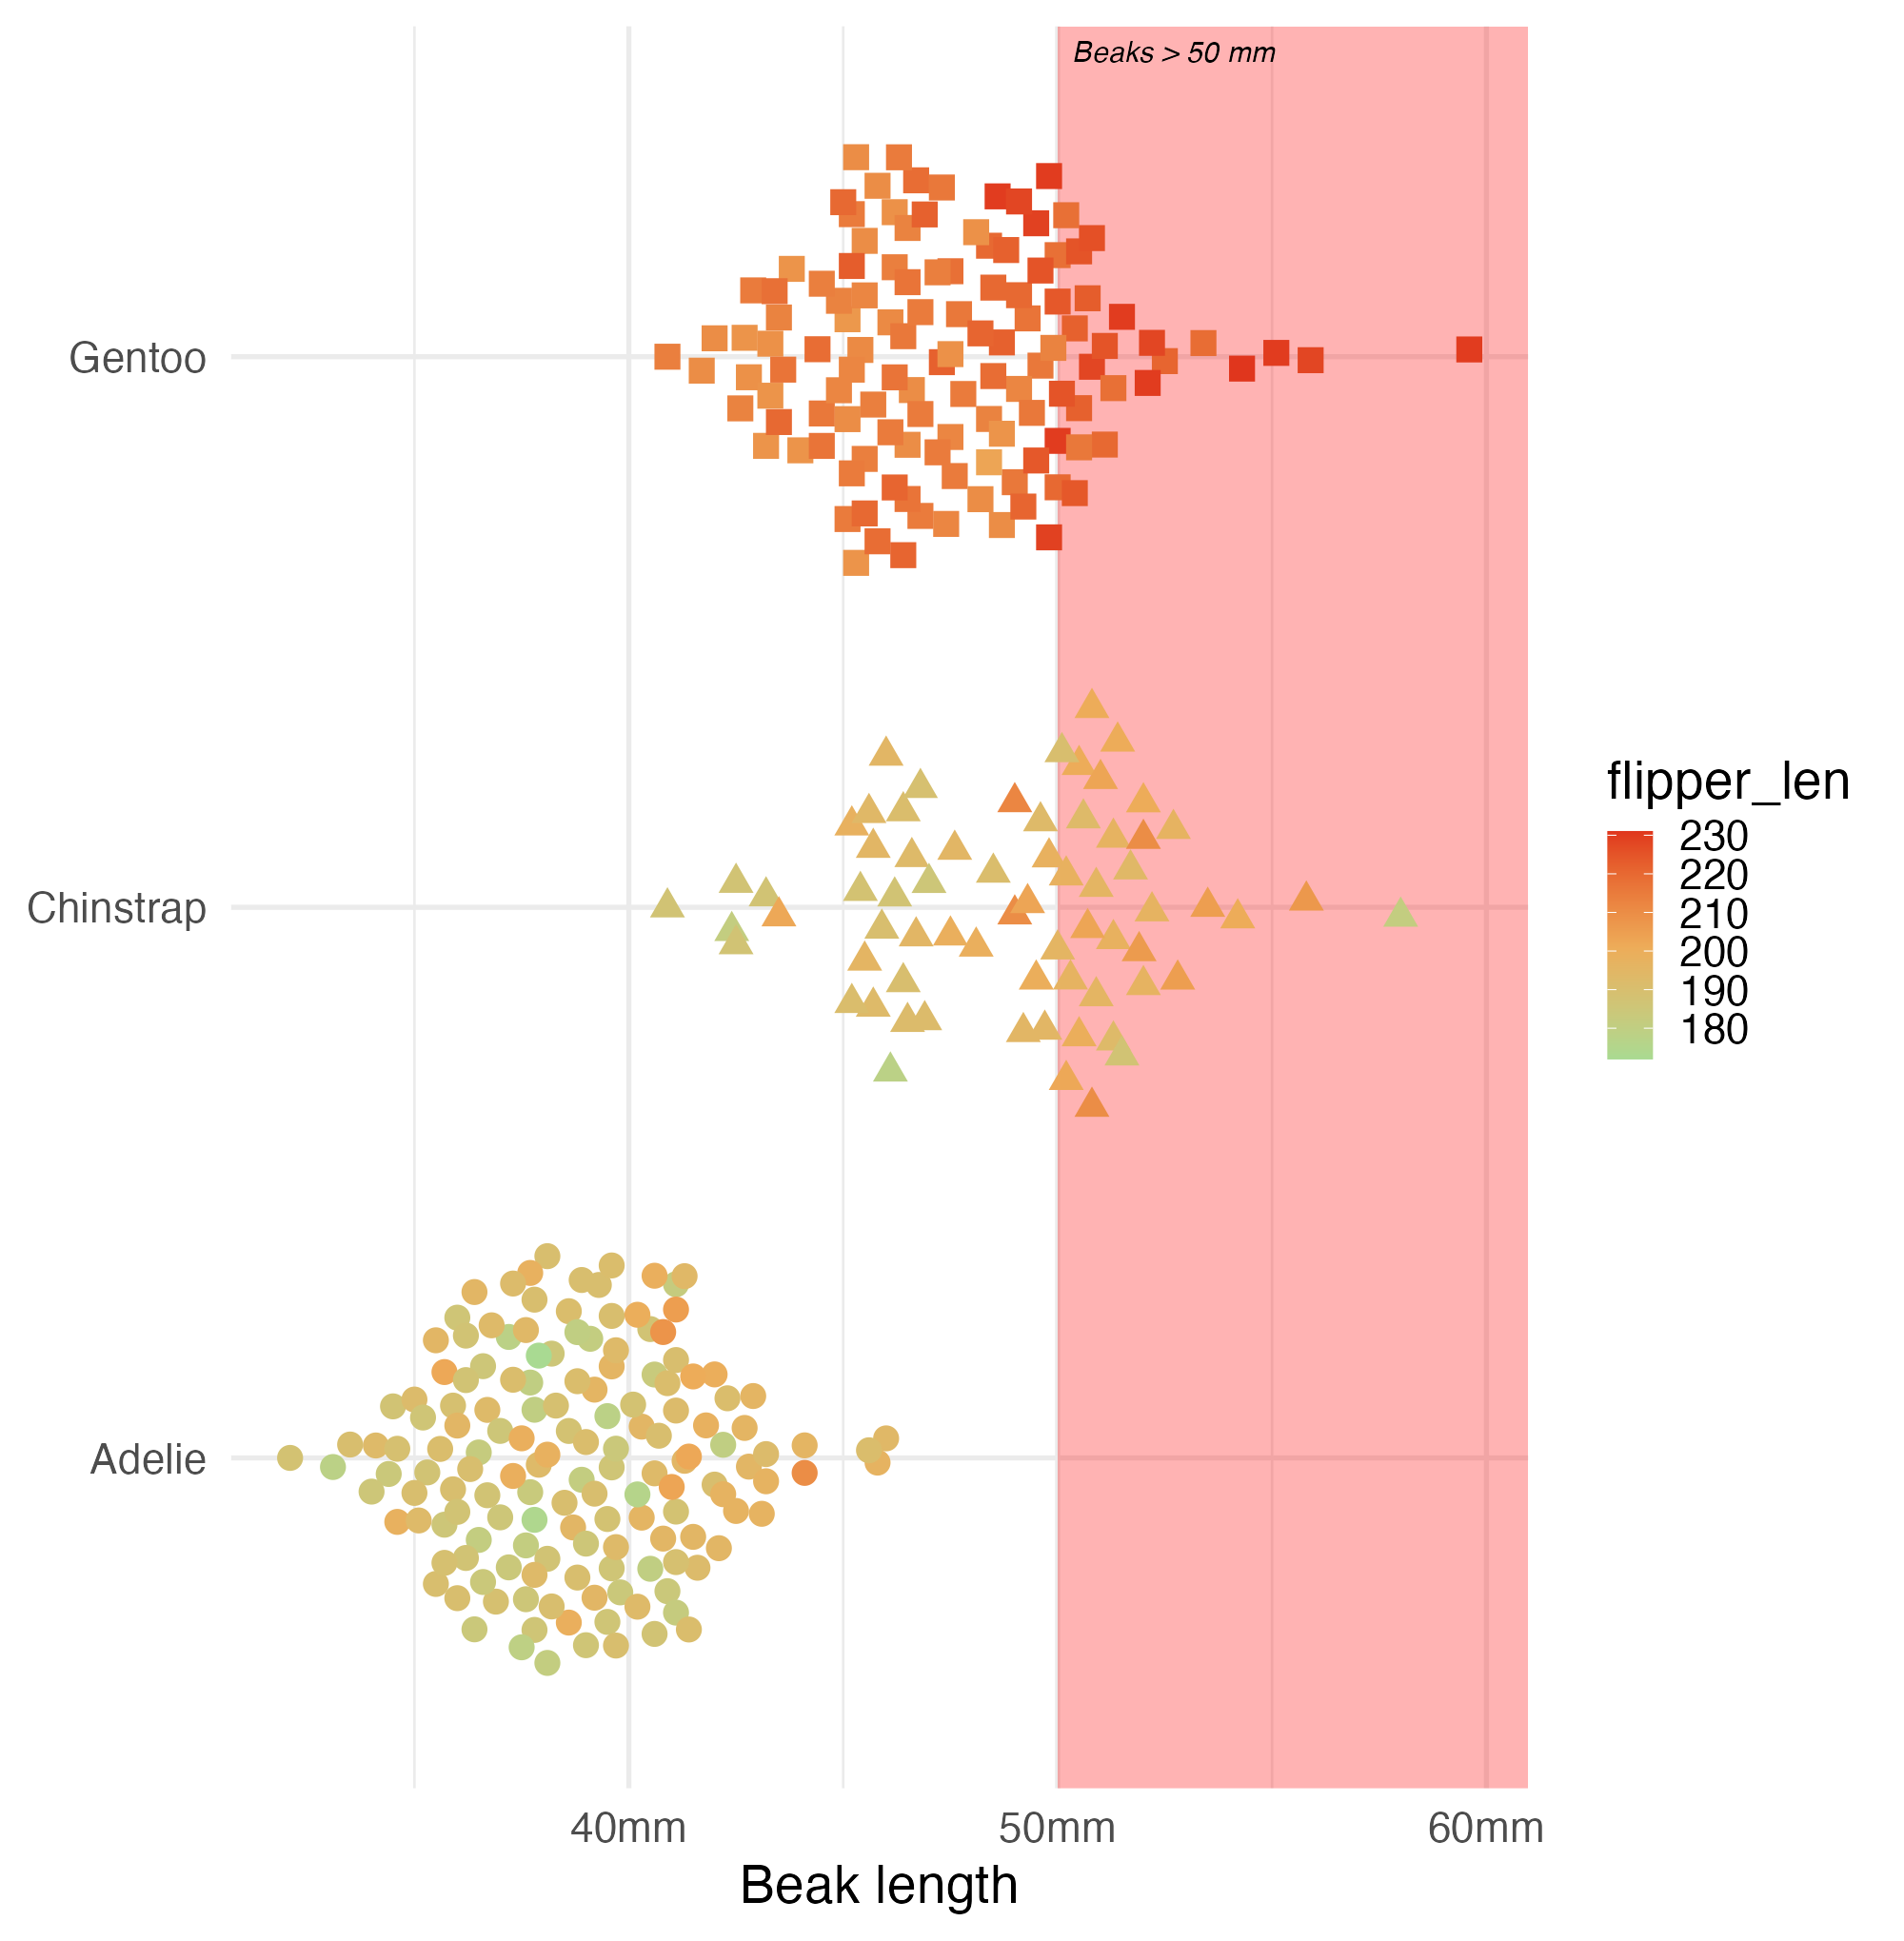
Fix 2: Colour accessibility
Let’s take a look!
penguins |>
  ggplot() +
  annotate(
    "rect",
    xmin = 50,
    xmax = Inf,
    ymin = -Inf,
    ymax = Inf,
    fill = alpha("red", 0.3)
  ) +
  ggtext::geom_textbox(
    data = data.frame(),
    aes(x = 50, y = Inf, label = "*Beaks > 50 mm*"),
    fill = NA,
    box.colour = NA,
    hjust = 0,
    vjust = 1
  ) +
  ggbeeswarm::geom_quasirandom(
    aes(
      x = bill_len,
      y = species,
      shape = species,
      colour = flipper_len
    ),
    size = 4
  ) +
  labs(x = "Beak length") +
  scale_x_continuous(label = function(x) paste0(x, "mm")) +
  scale_shape(guide = "none") +
  scale_colour_gradient2(
    low = "#a5dc94",
    mid = "#a7a7a7",
    high = "#e0361d",
    midpoint = mean(penguins$flipper_len, na.rm = TRUE)
  ) +
  theme(axis.title.y = element_blank())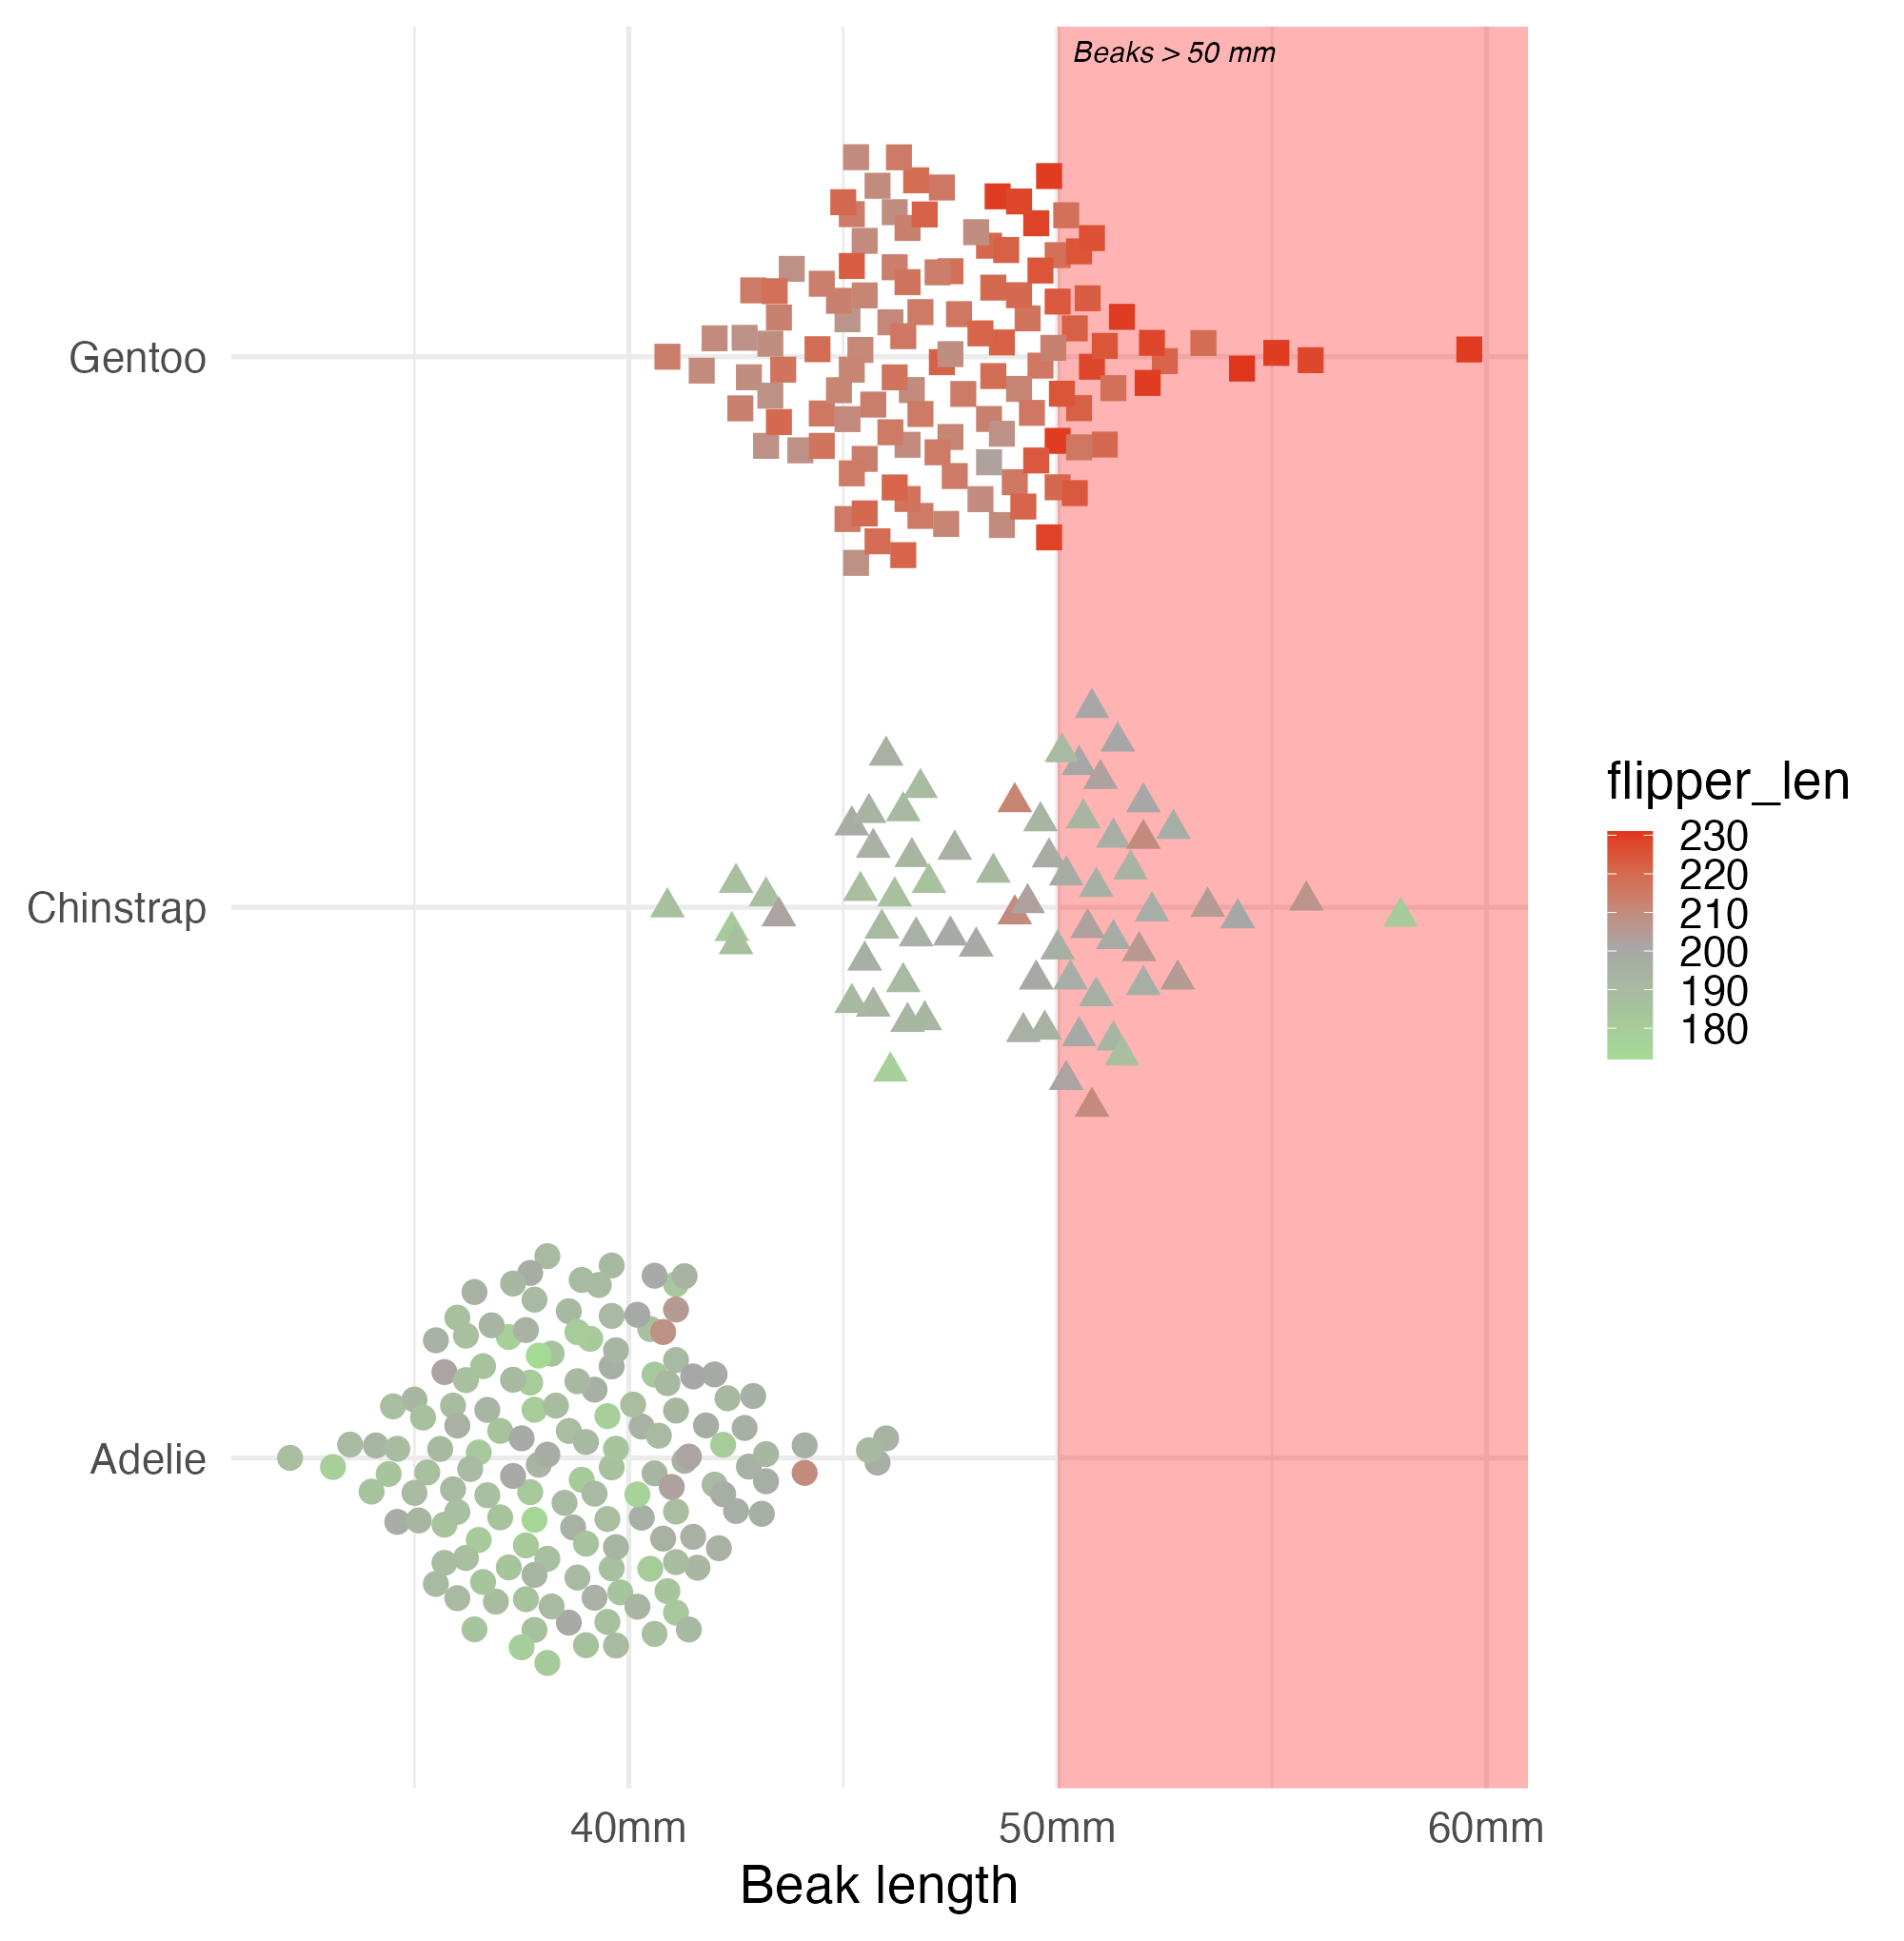
Fix 3: Text hierarchy
Our starting point
penguins |>
ggplot() +
annotate(
"rect",
xmin = 50,
xmax = Inf,
ymin = -Inf,
ymax = Inf,
fill = alpha("red", 0.3)
) +
ggtext::geom_textbox(
data = data.frame(),
aes(x = 50, y = Inf, label = "*Beaks > 50 mm*"),
fill = NA,
box.colour = NA,
hjust = 0,
vjust = 1
) +
ggbeeswarm::geom_quasirandom(
aes(
x = bill_len,
y = species,
shape = species,
colour = flipper_len
),
size = 4
) +
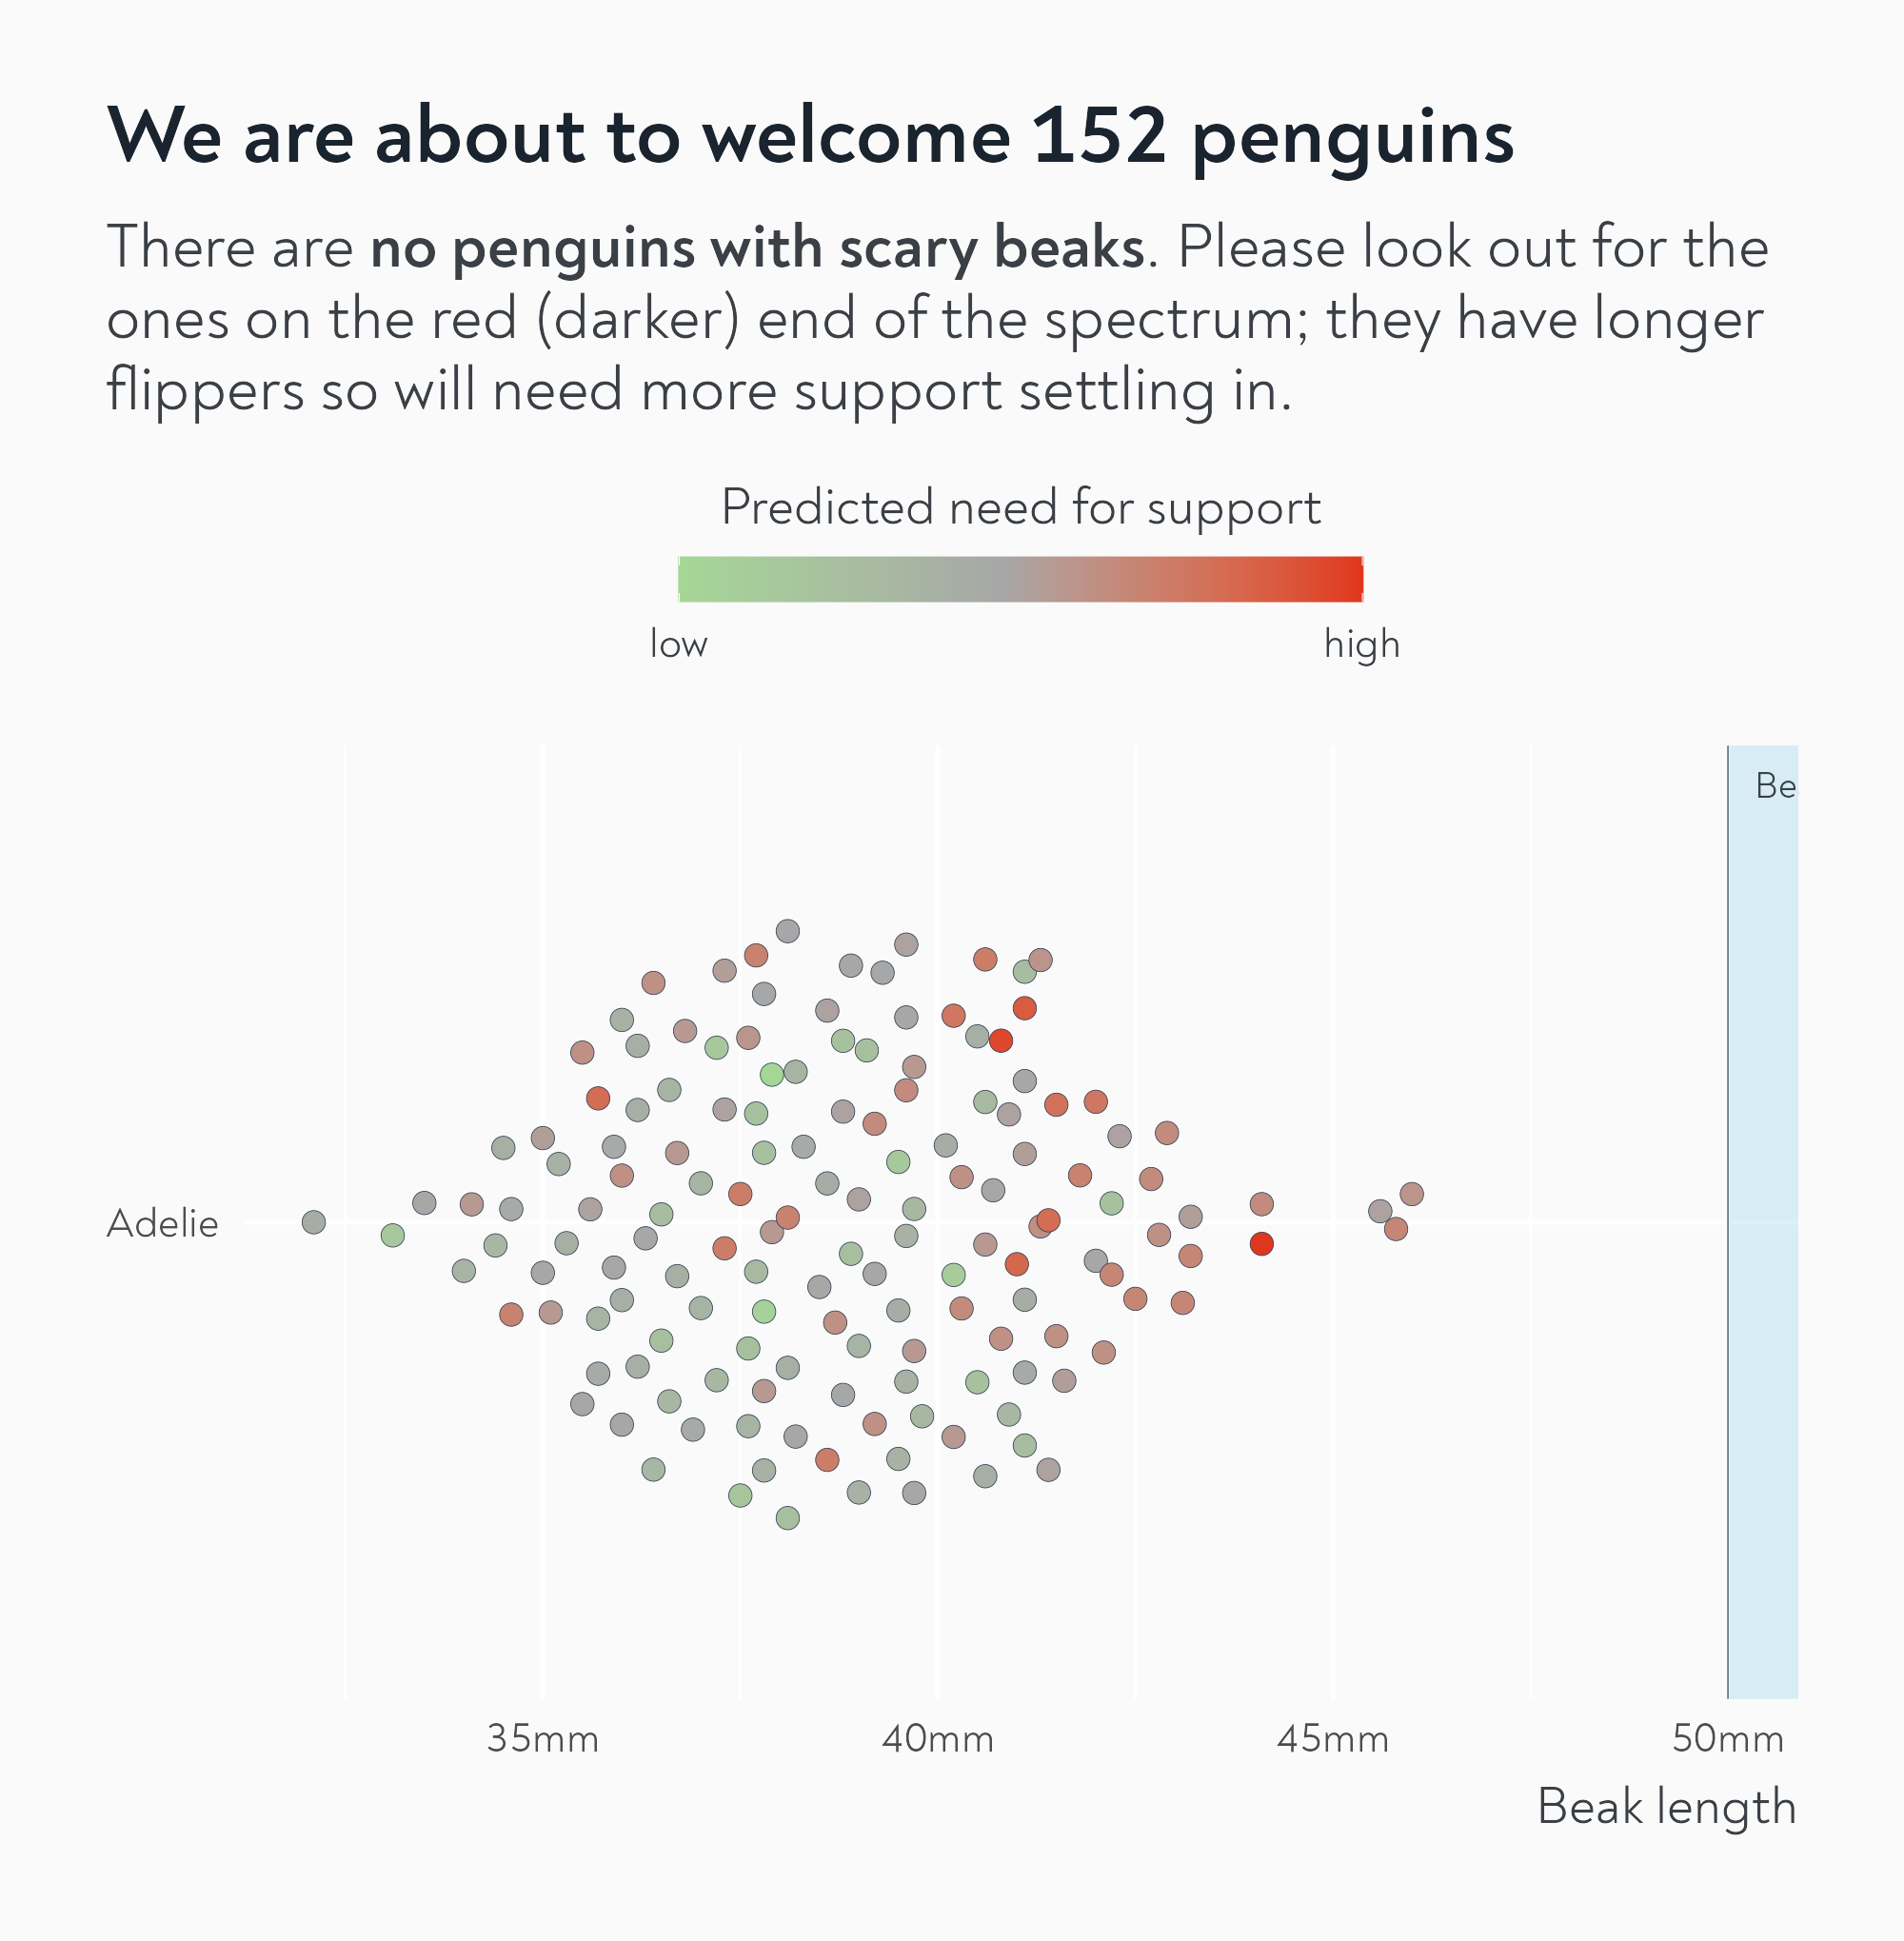
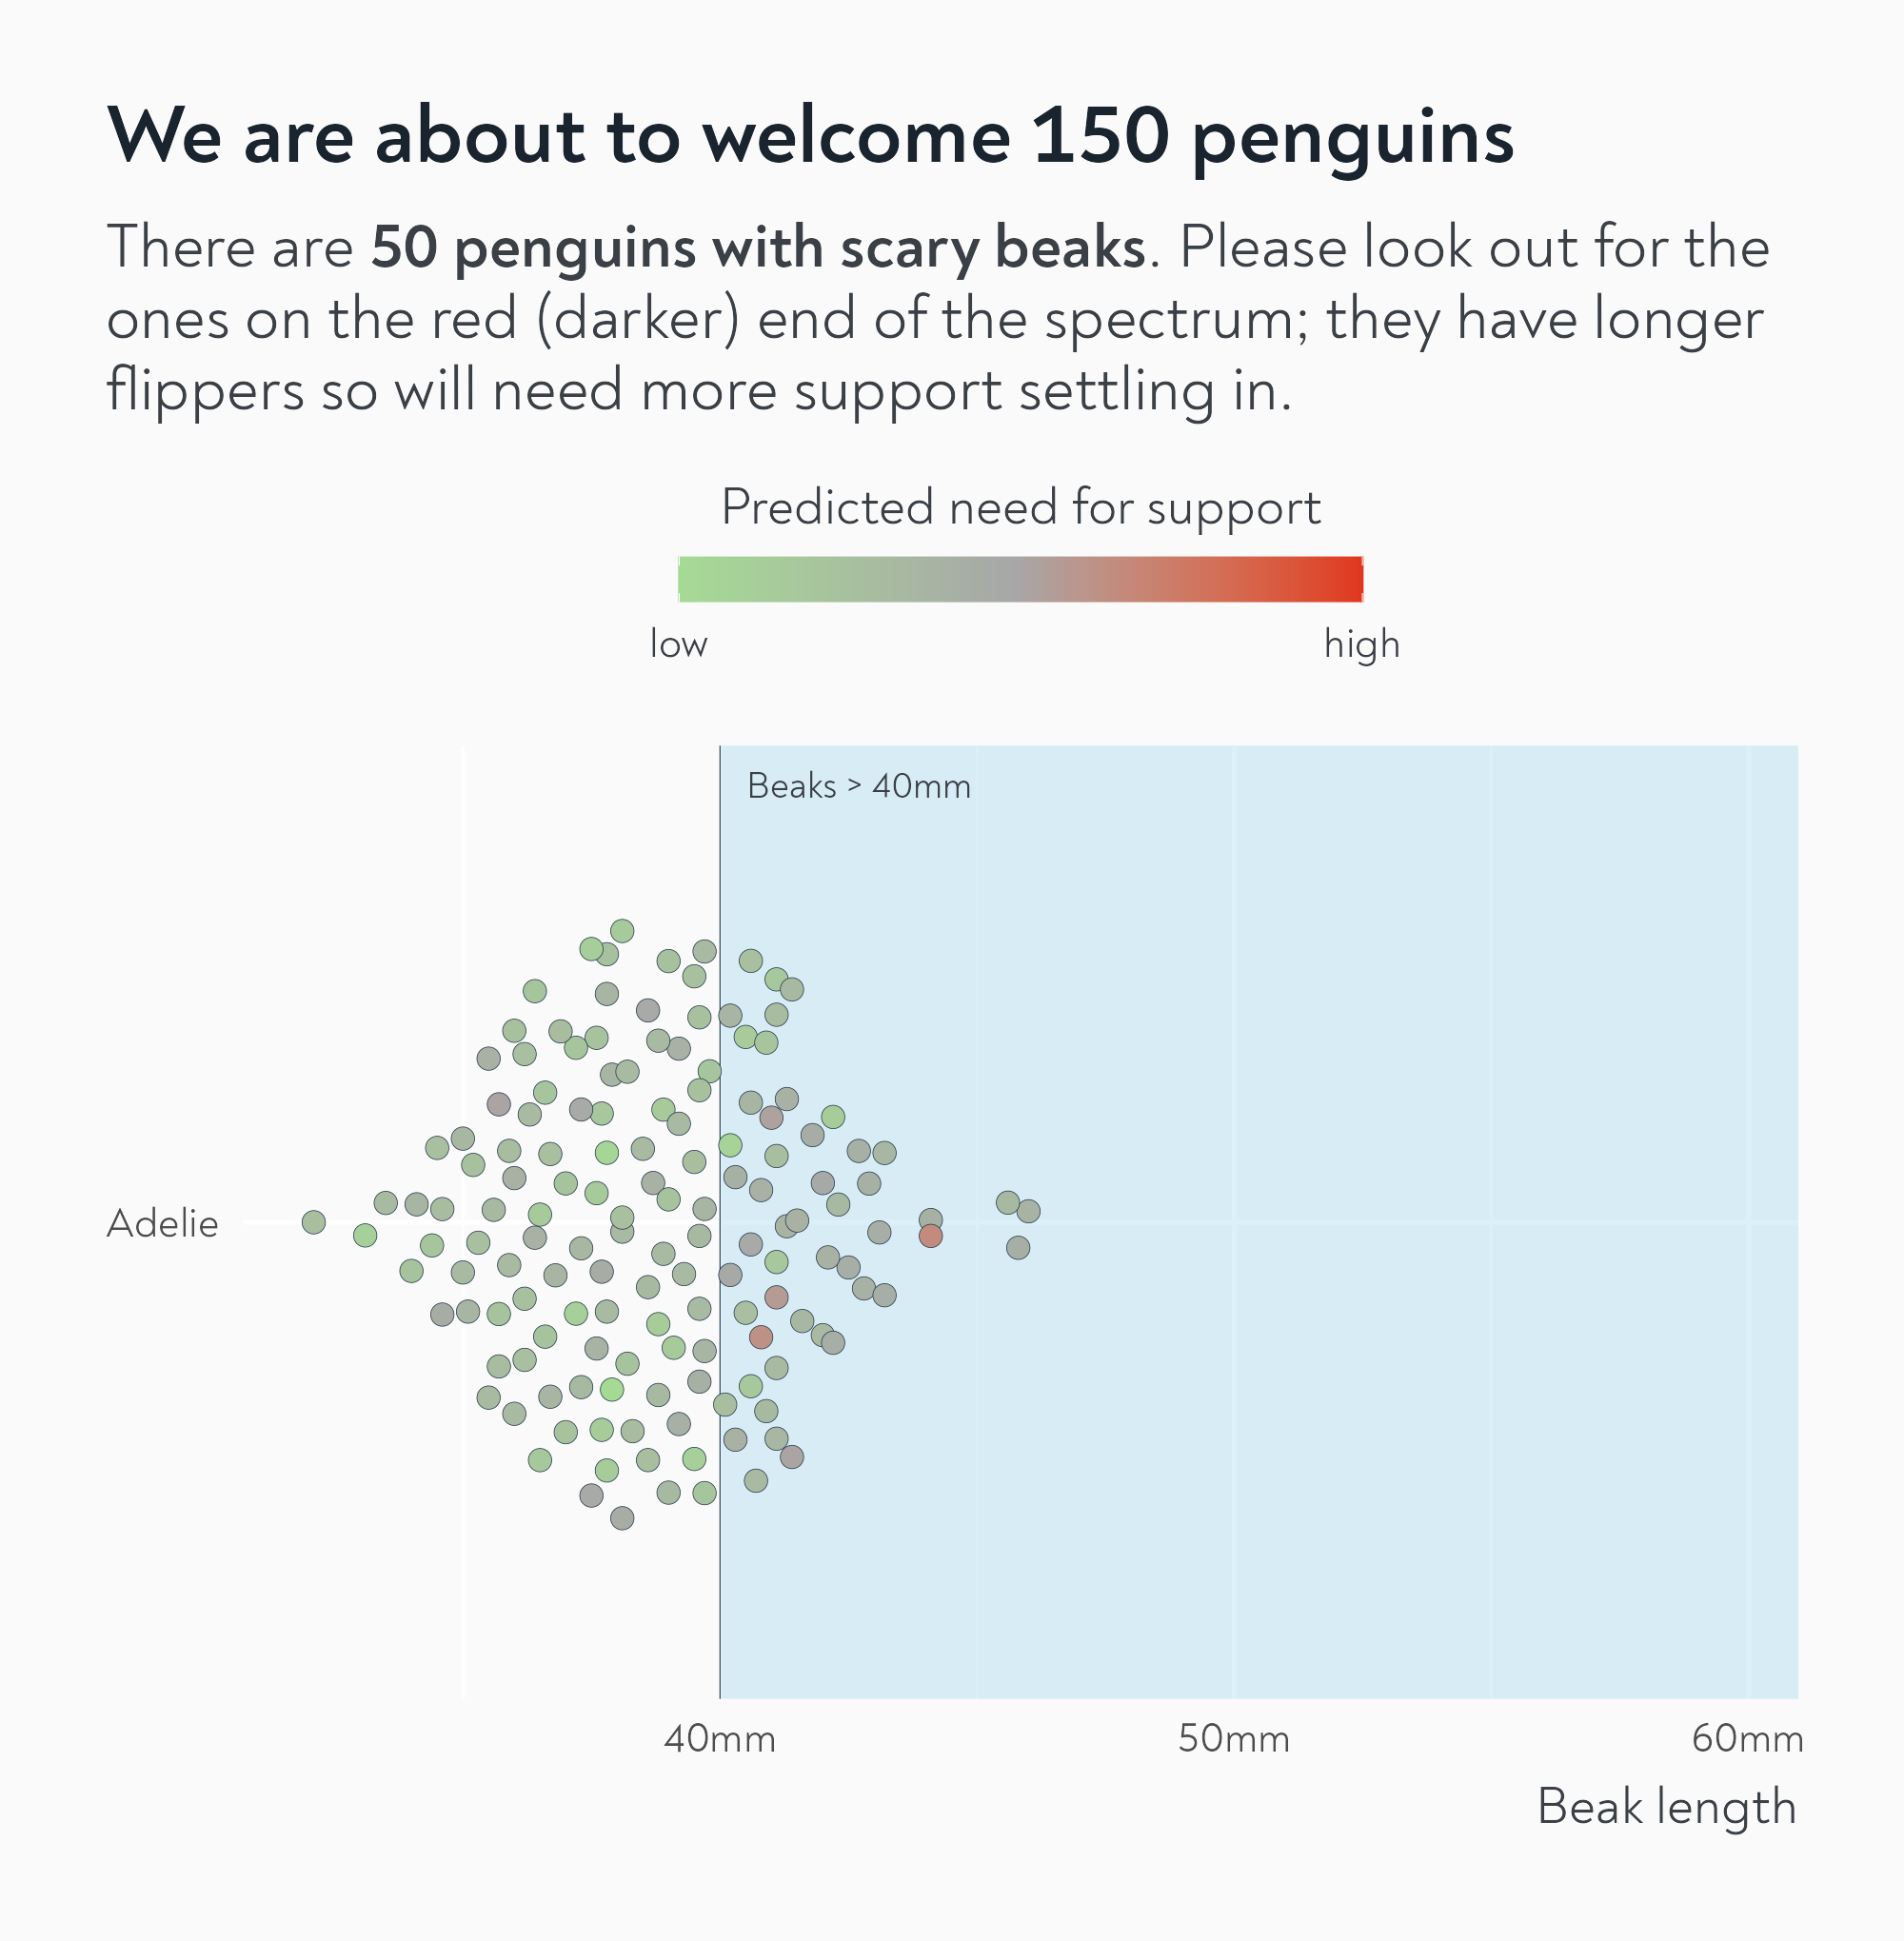
labs(
x = "Beak length",
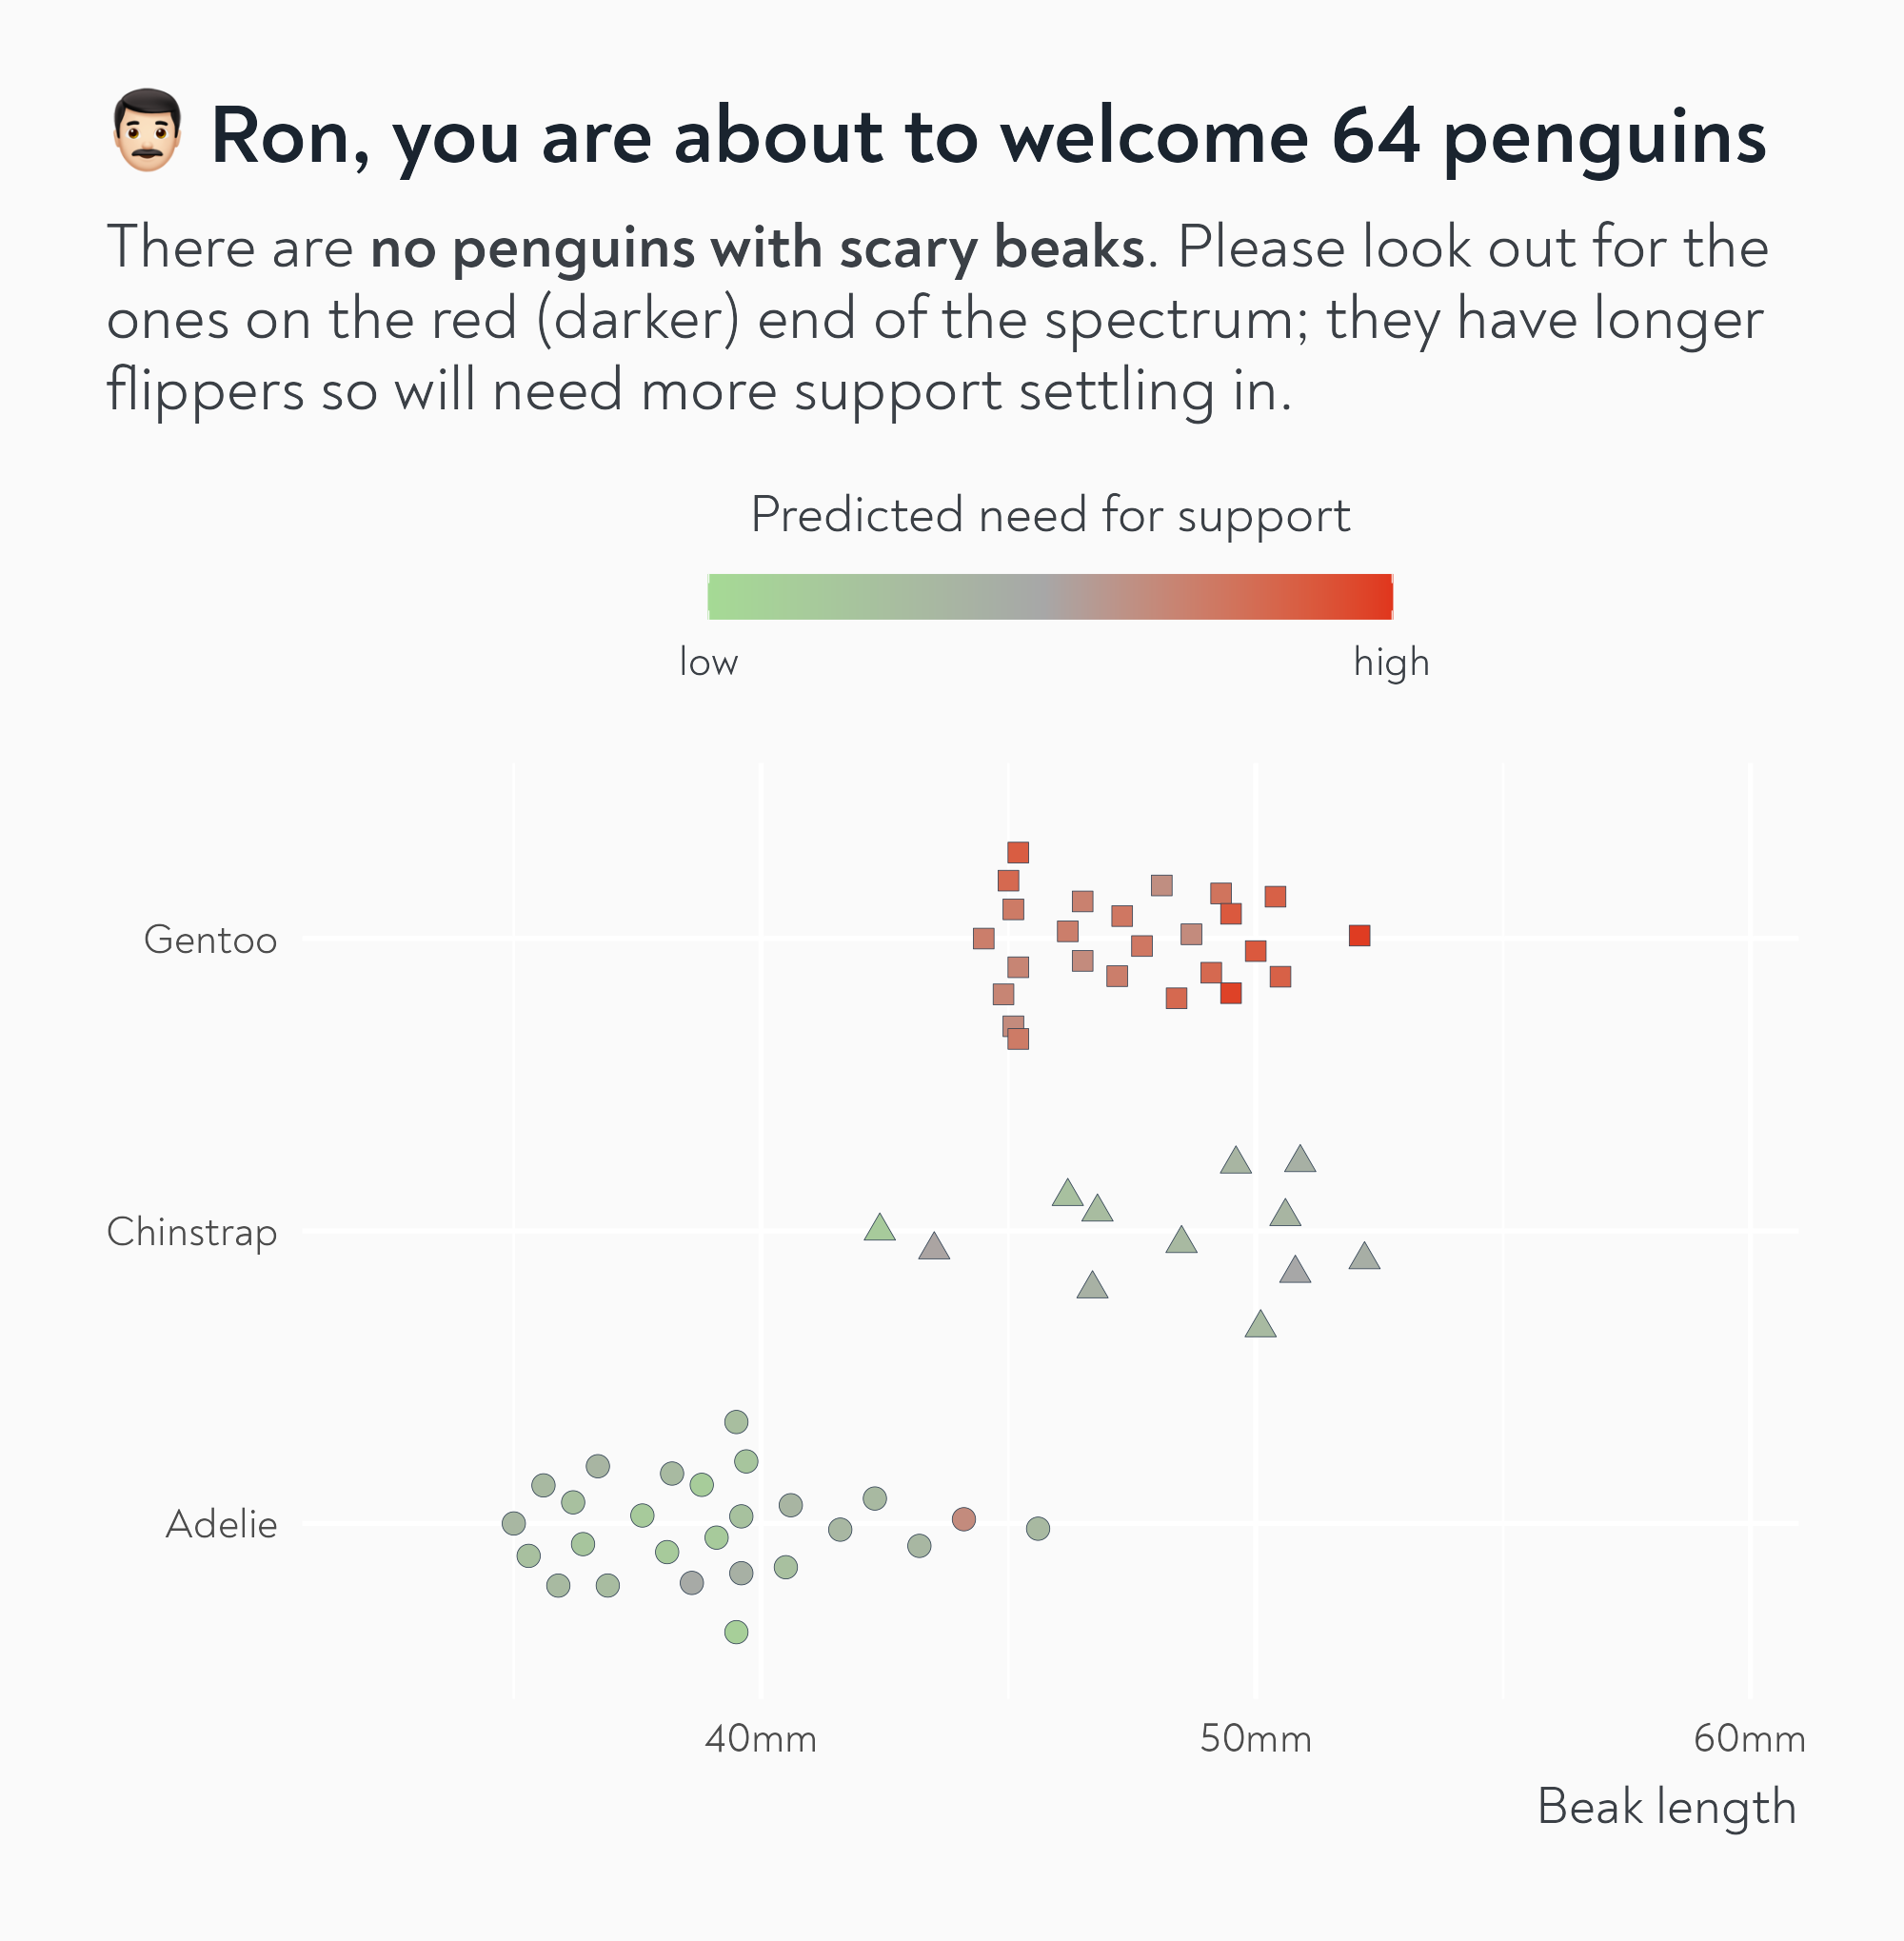
title = paste0("We are about to welcome ", nrow(penguins), " new penguins"),
subtitle = paste0(
"There are ",
verbaliseR::pluralise(
sum(penguins$bill_len > 50, na.rm = TRUE),
word = "penguin"
),
" with scary beaks. Please look out for the ones on the red (darker) end of the spectrum; they have longer flippers so will need more support settling in."
),
colour = "Predicted need for support"
) +
scale_x_continuous(label = function(x) paste0(x, "mm")) +
scale_shape(guide = "none") +
scale_colour_gradient2(
low = "#a5dc94",
mid = "#a7a7a7",
high = "#e0361d",
midpoint = mean(penguins$flipper_len, na.rm = TRUE),
limits = c(
min(penguins$flipper_len, na.rm = TRUE),
max(penguins$flipper_len, na.rm = TRUE)
),
breaks = c(
min(penguins$flipper_len, na.rm = TRUE),
max(penguins$flipper_len, na.rm = TRUE)
),
labels = c("low", "high")
) +
theme(
plot.subtitle = marquee::element_marquee(width = 1),
axis.title.y = element_blank(),
legend.position = "top",
legend.title.position = "top",
legend.justification = 0,
legend.key.width = unit(3.3, "lines")
)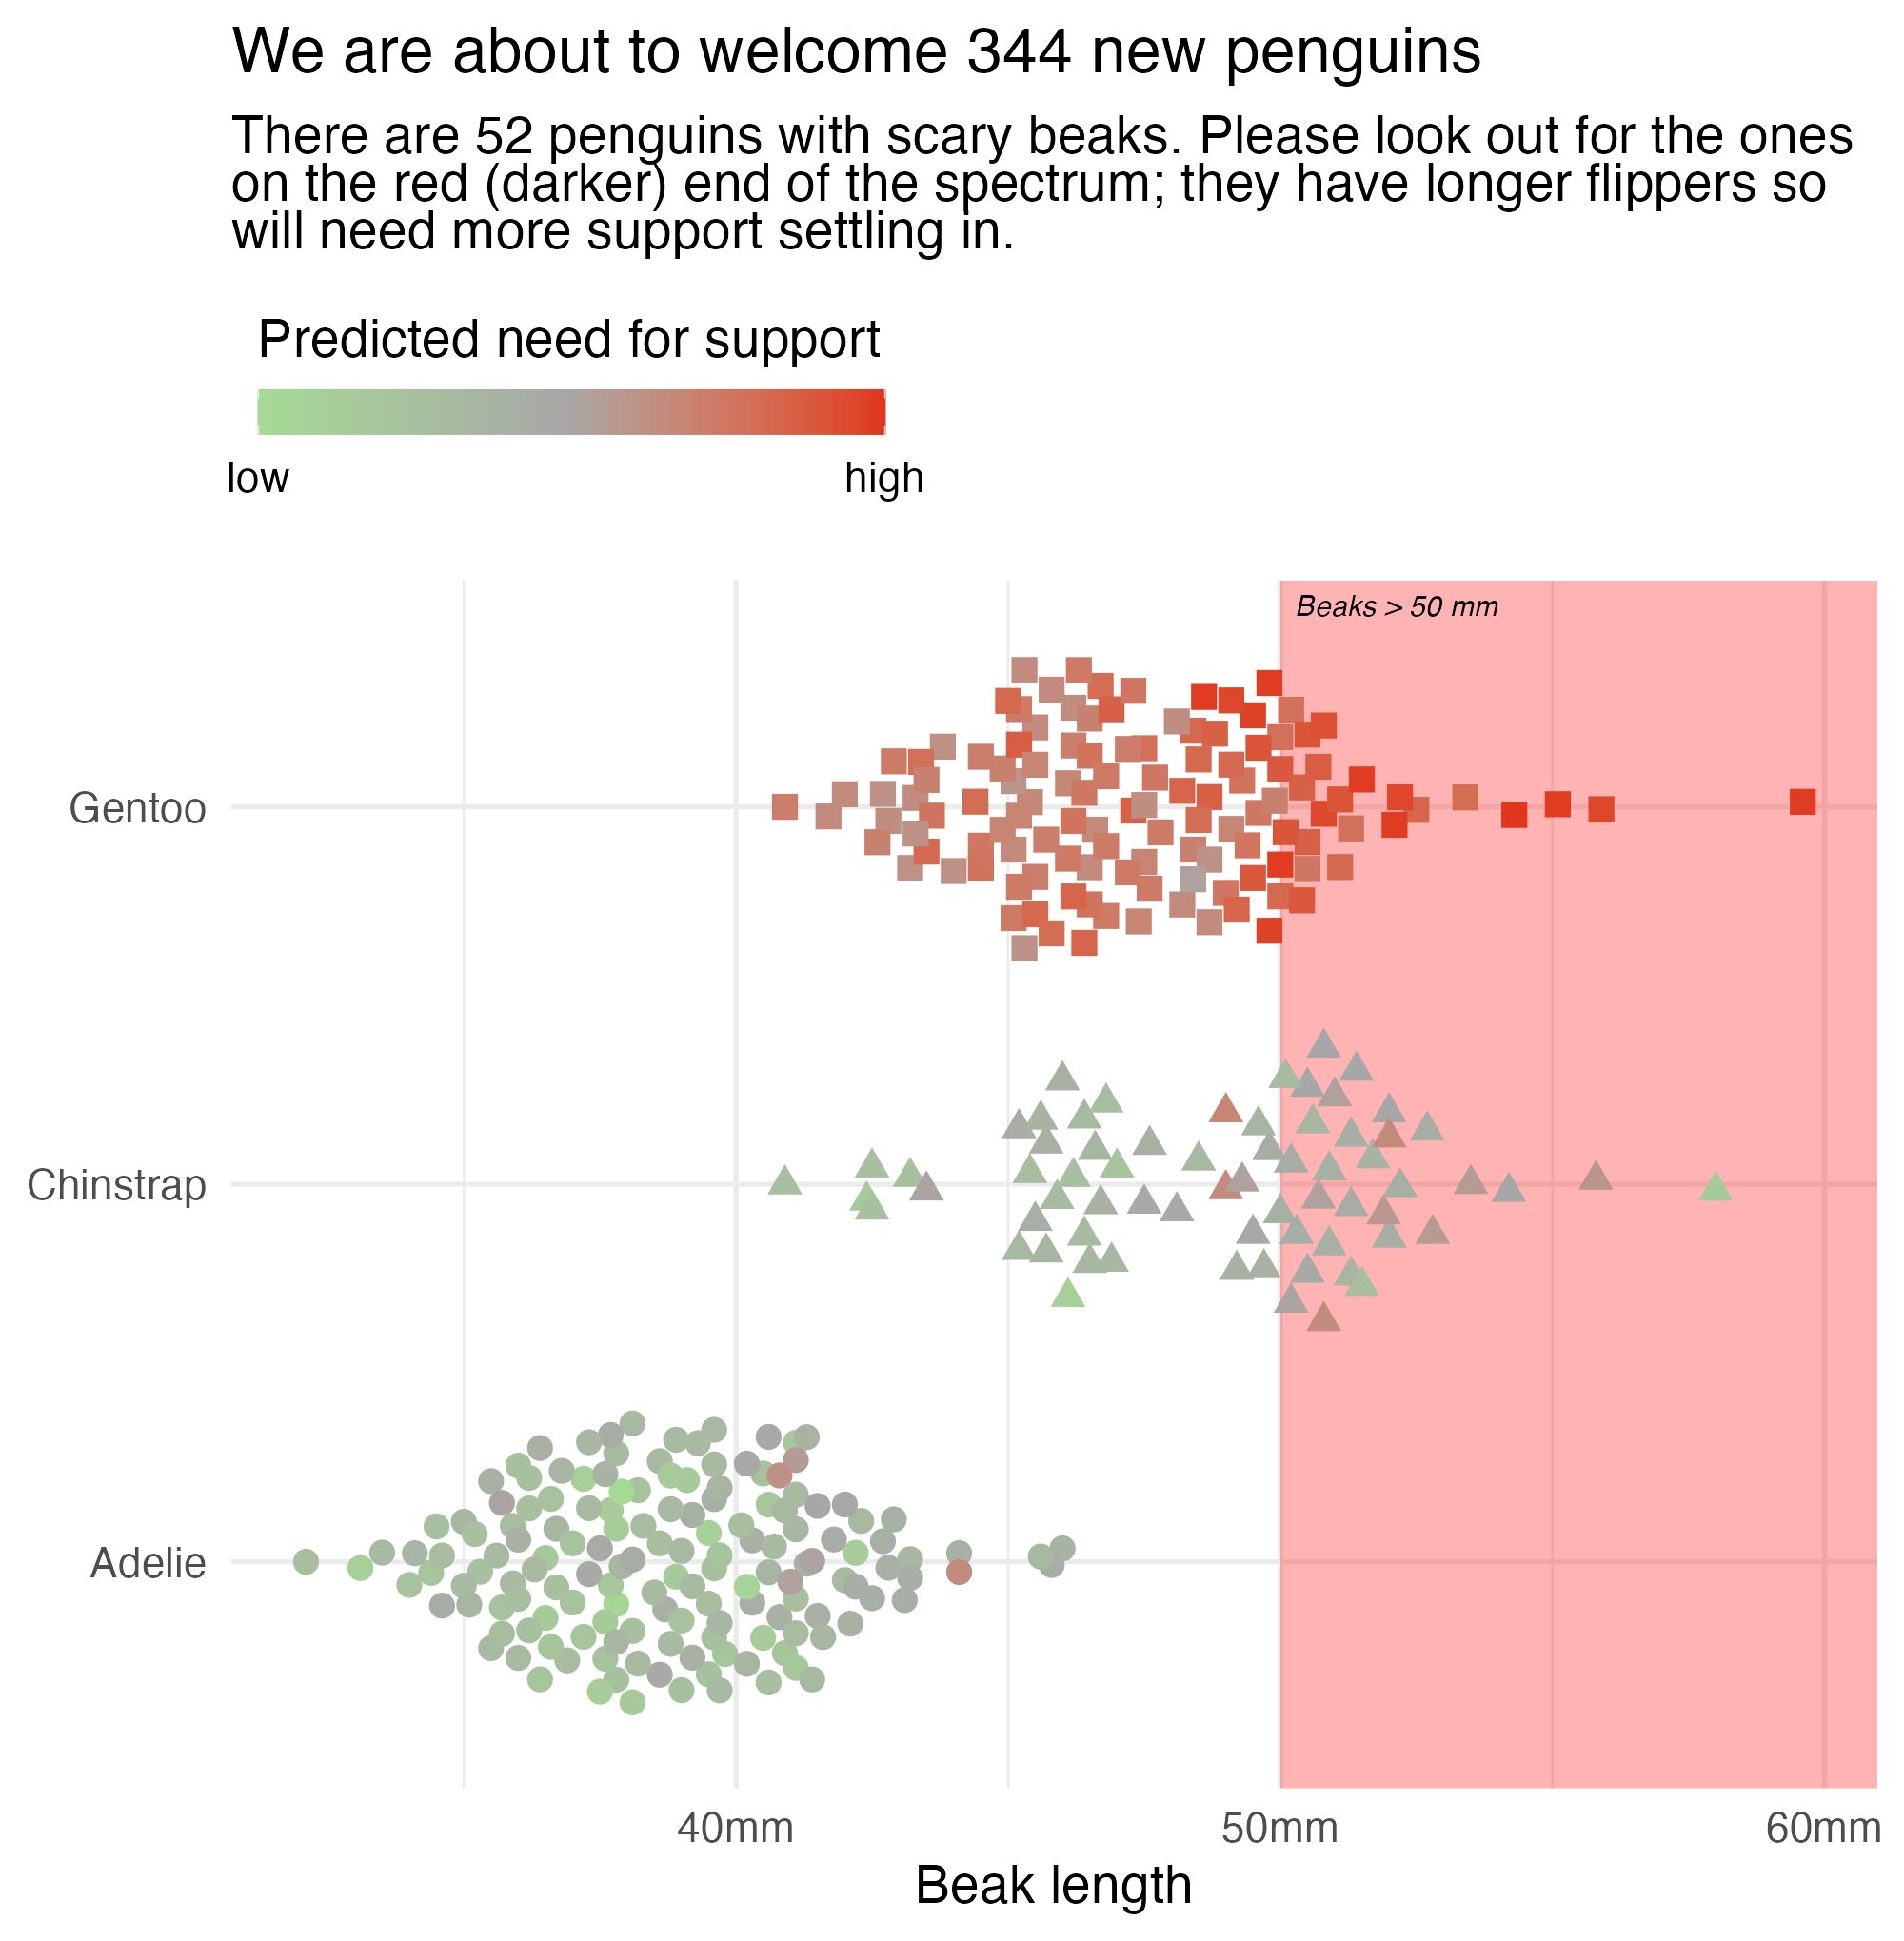
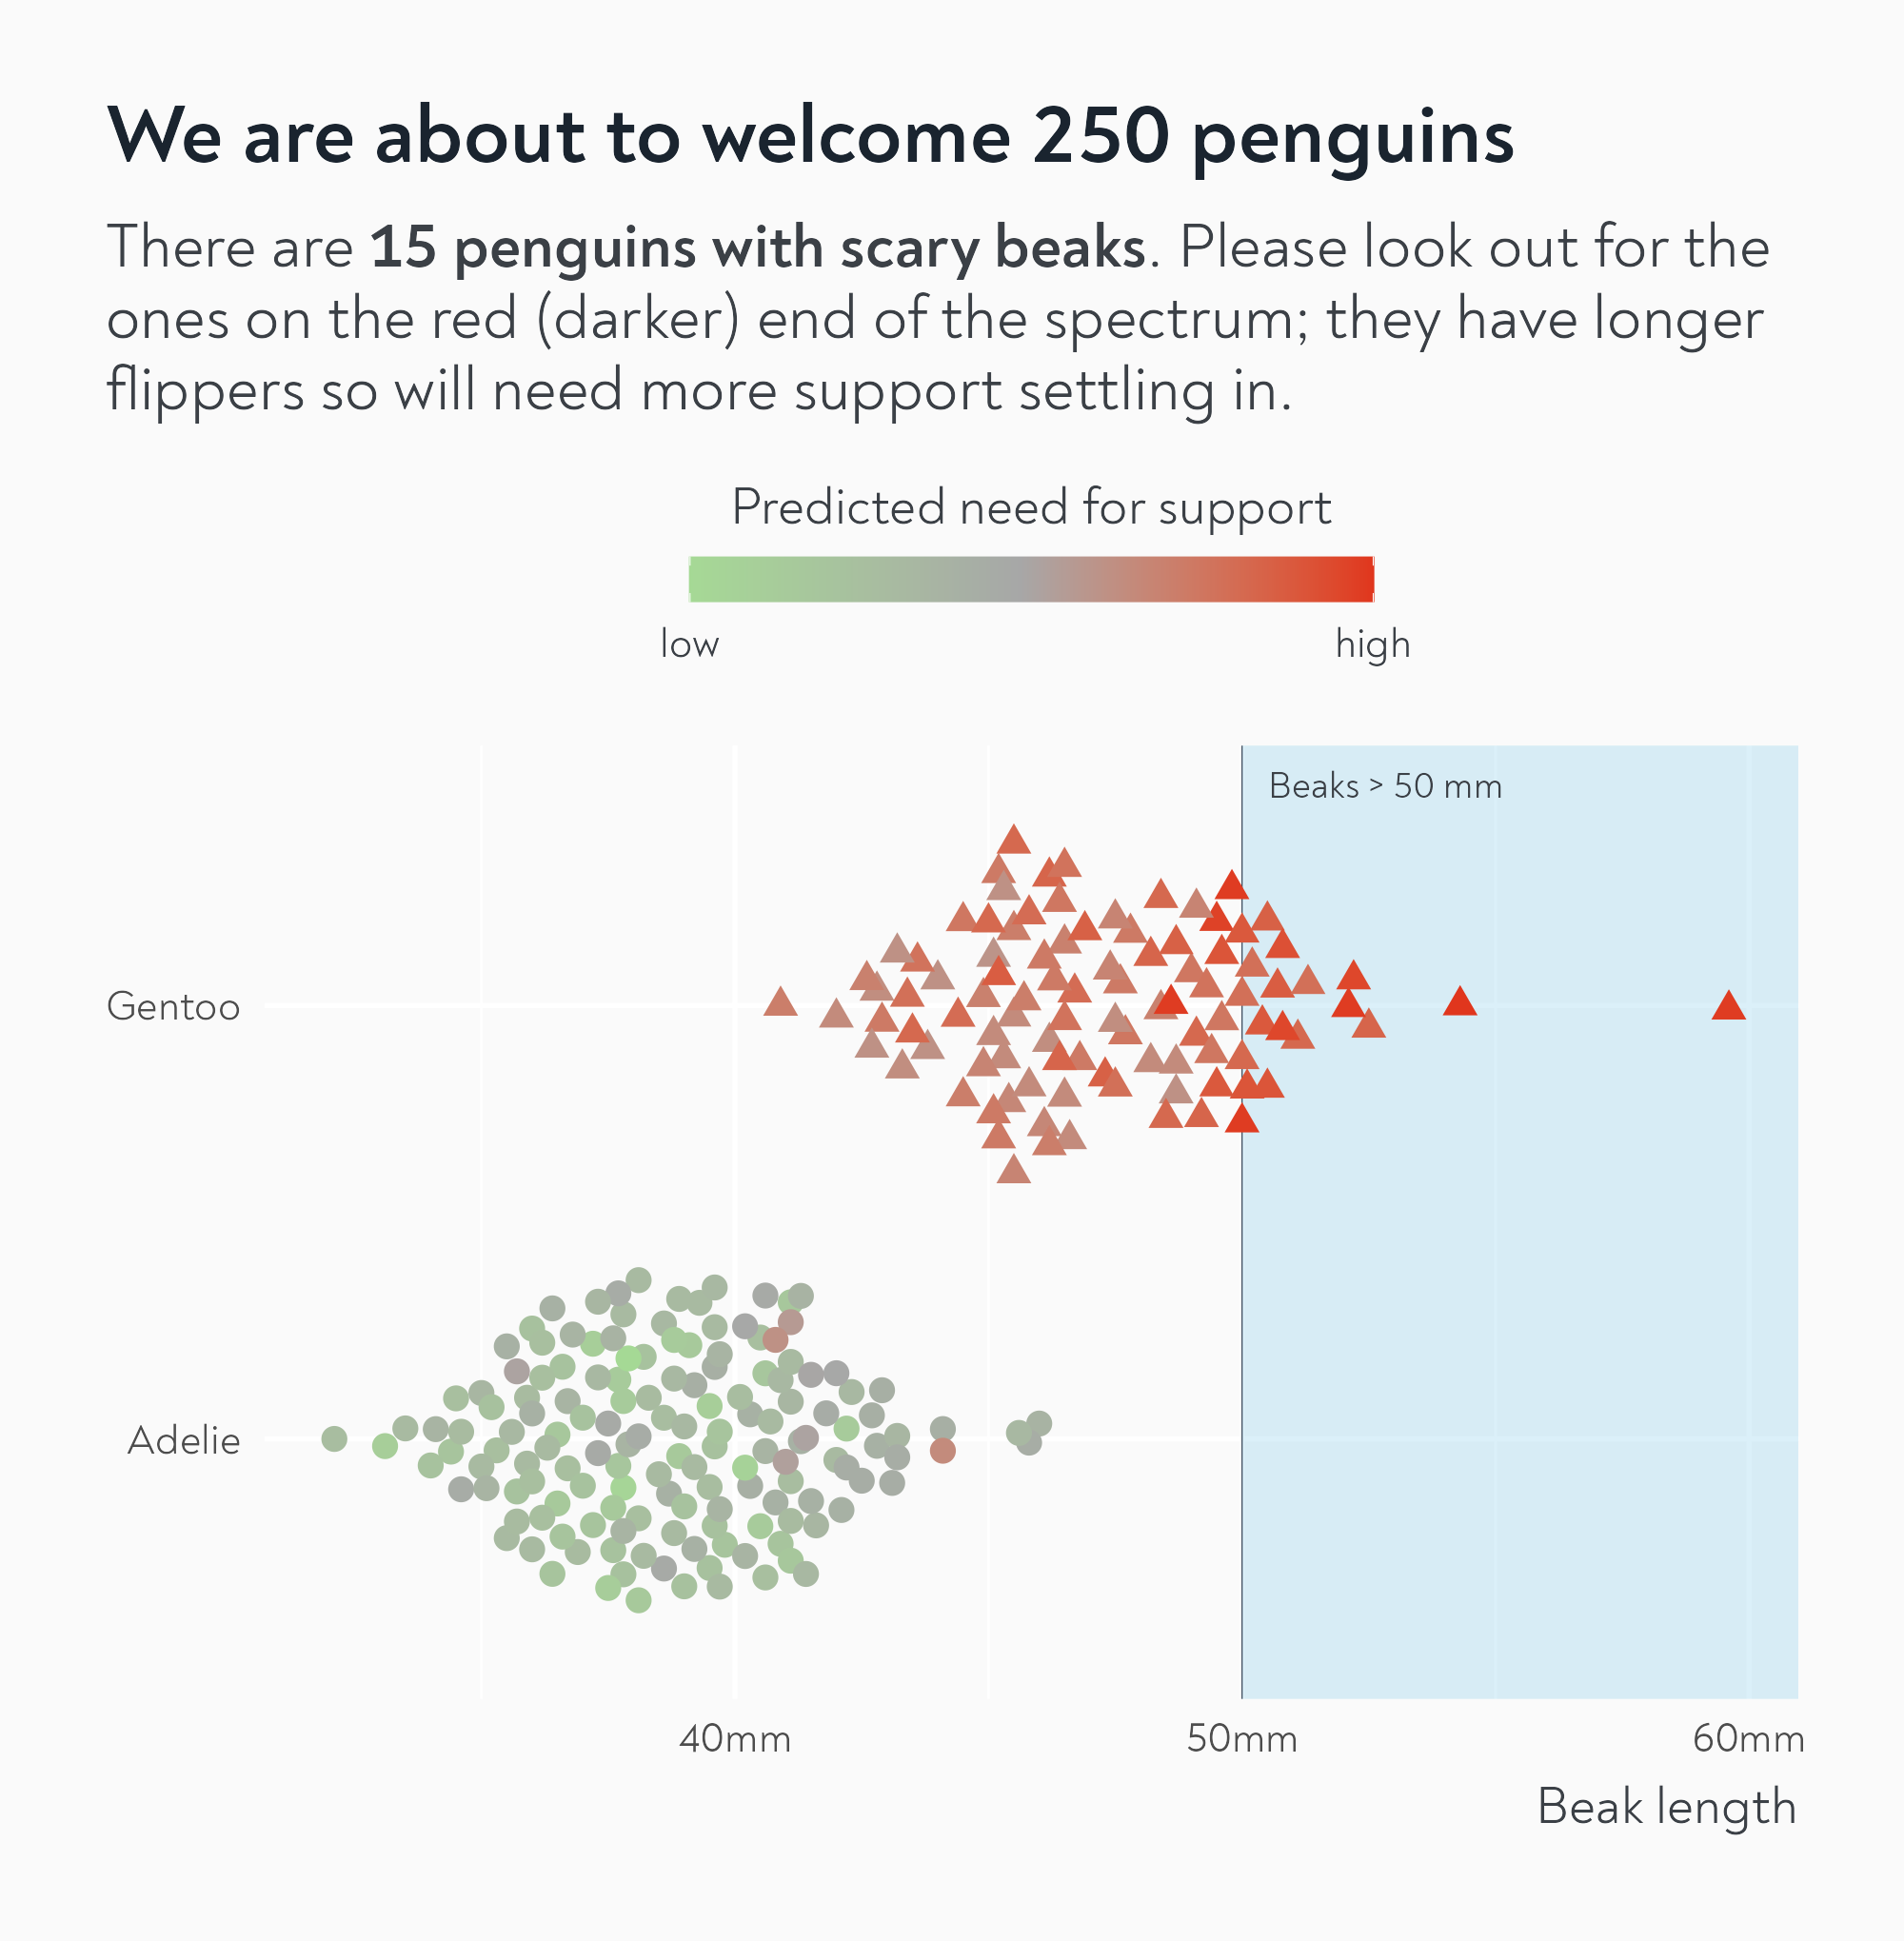
Fix 3: Text hierarchy
The magic of typography ✨
penguins |>
ggplot() +
annotate(
"rect",
xmin = 50,
xmax = Inf,
ymin = -Inf,
ymax = Inf,
fill = alpha("red", 0.3)
) +
ggtext::geom_textbox(
data = data.frame(),
aes(x = 50, y = Inf, label = "Beaks > 50 mm"),
fill = NA,
box.colour = NA,
hjust = 0,
vjust = 1,
box.padding = unit(10, "pt"),
family = "Noah",
colour = "#3b4046",
size = 5
) +
ggbeeswarm::geom_quasirandom(
aes(
x = bill_len,
y = species,
shape = species,
colour = flipper_len
),
size = 4
) +
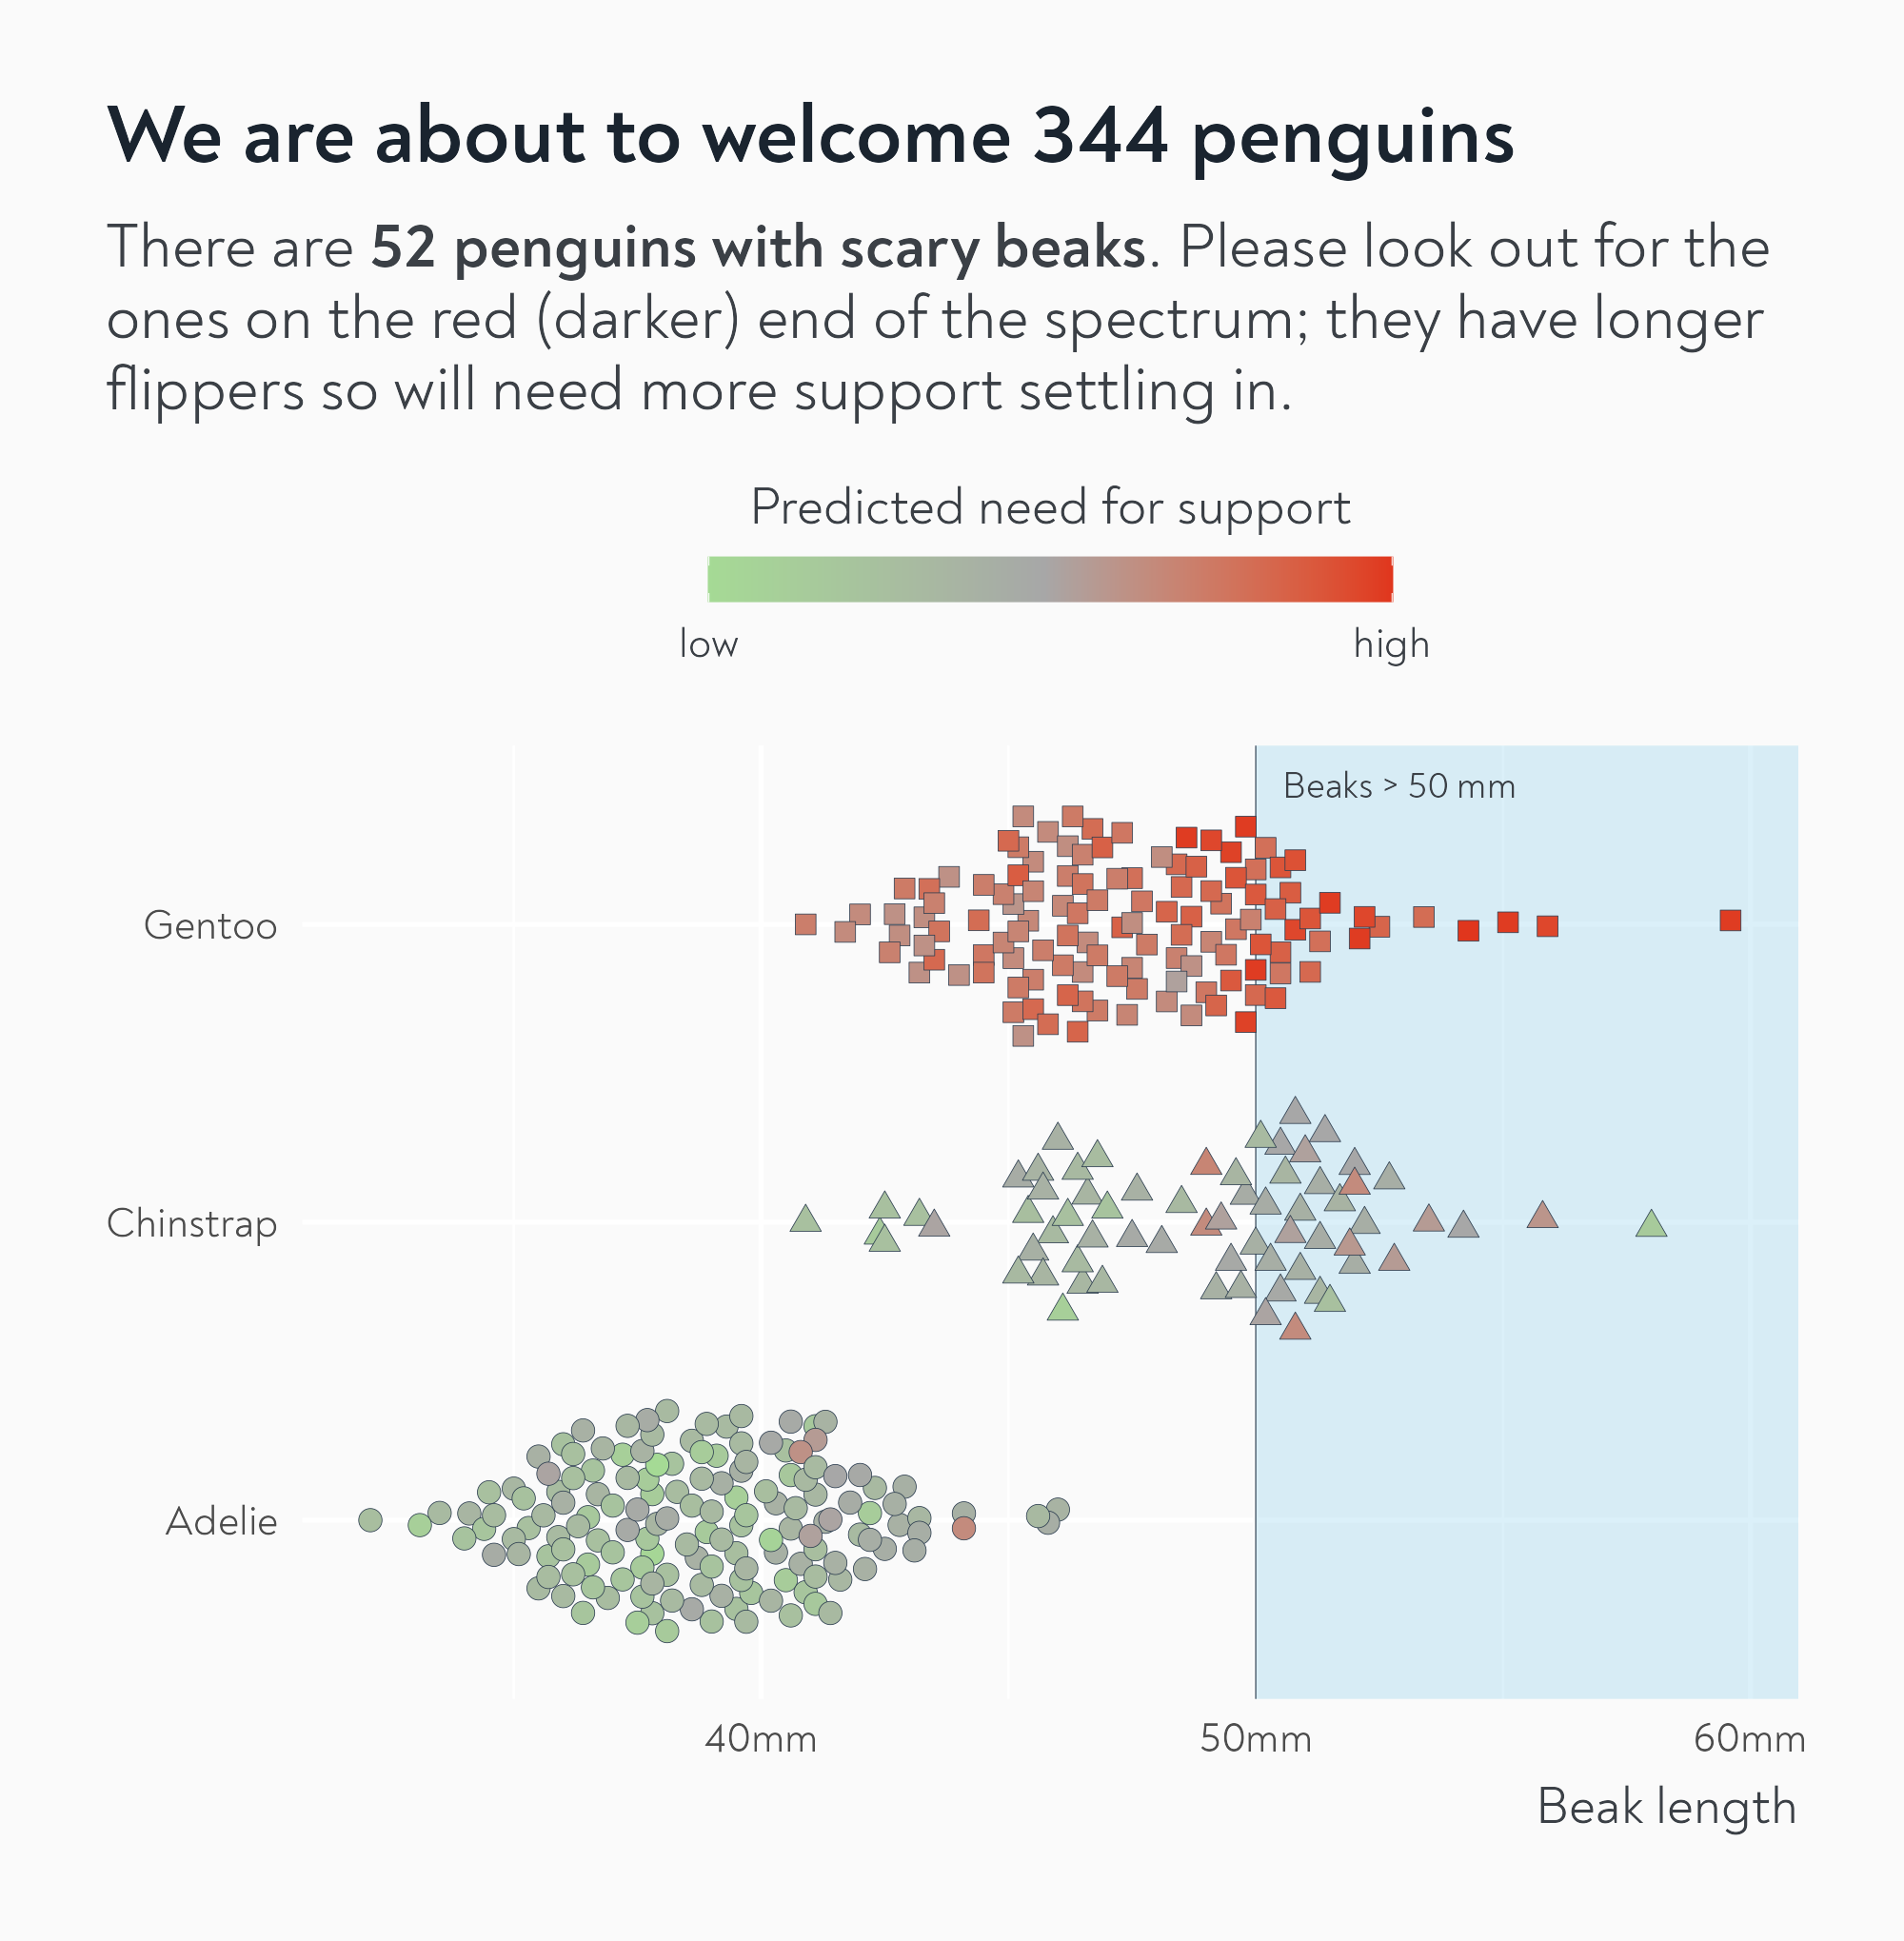
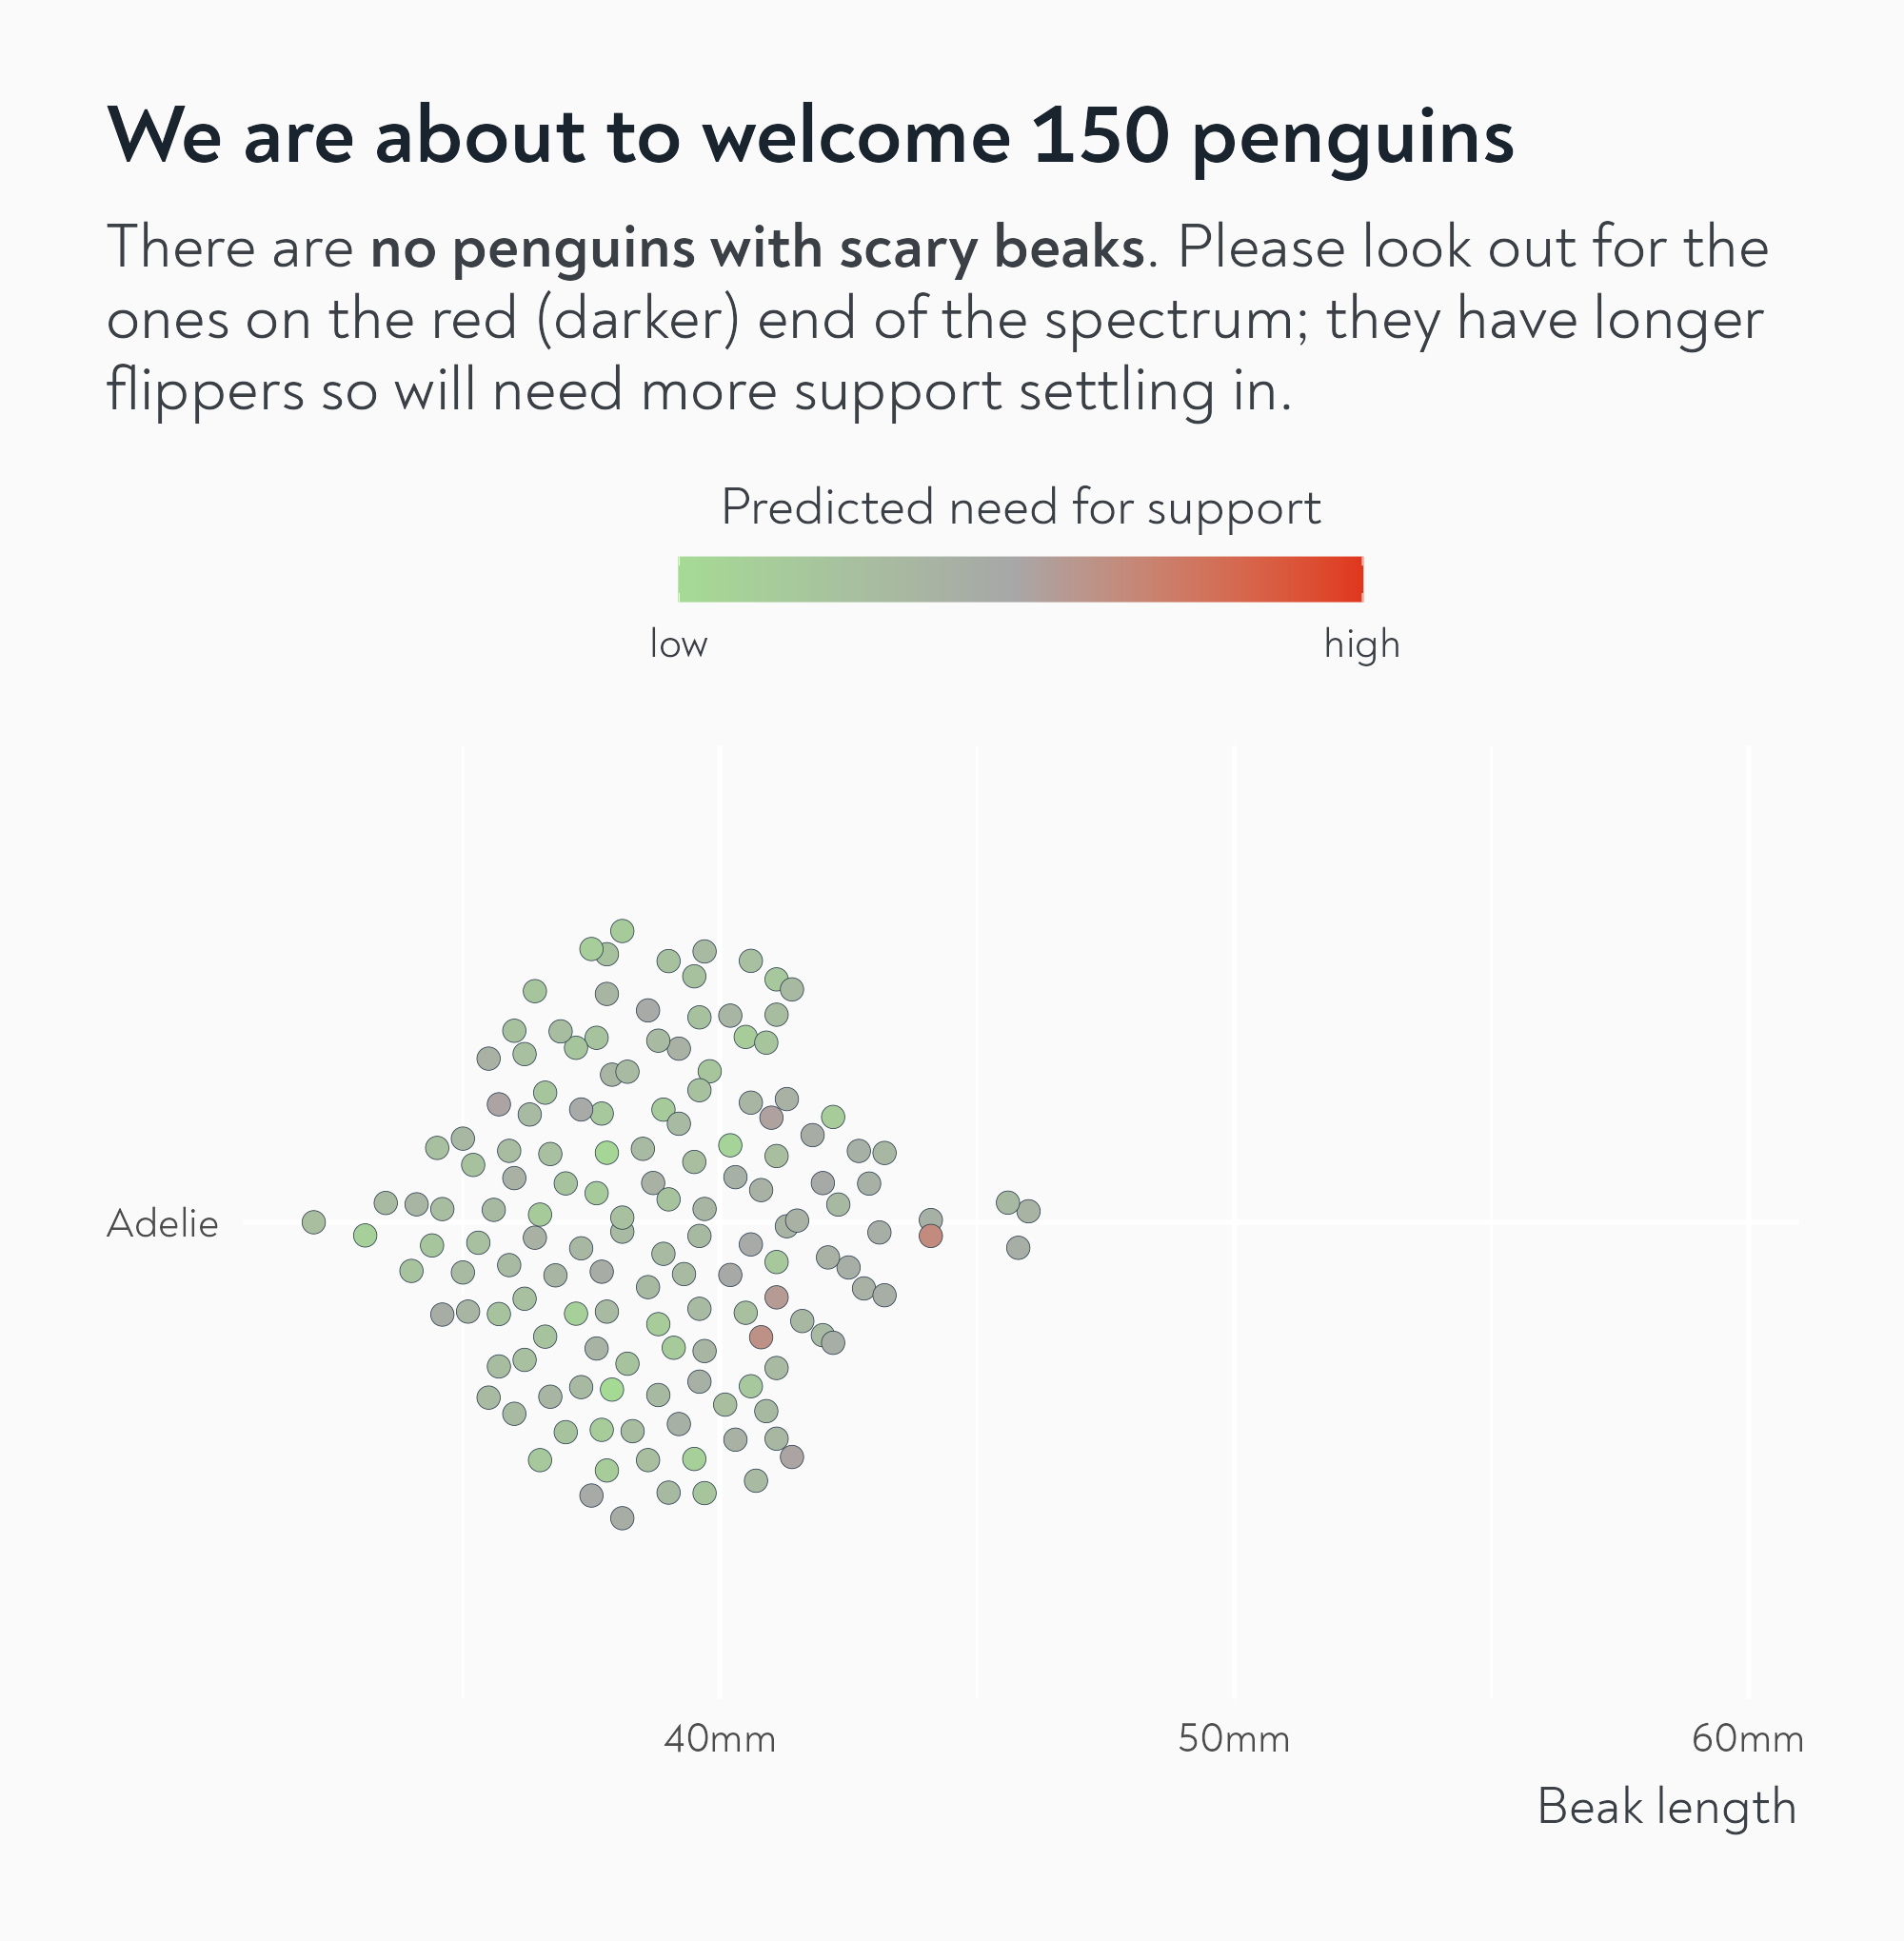
labs(
x = "Beak length",
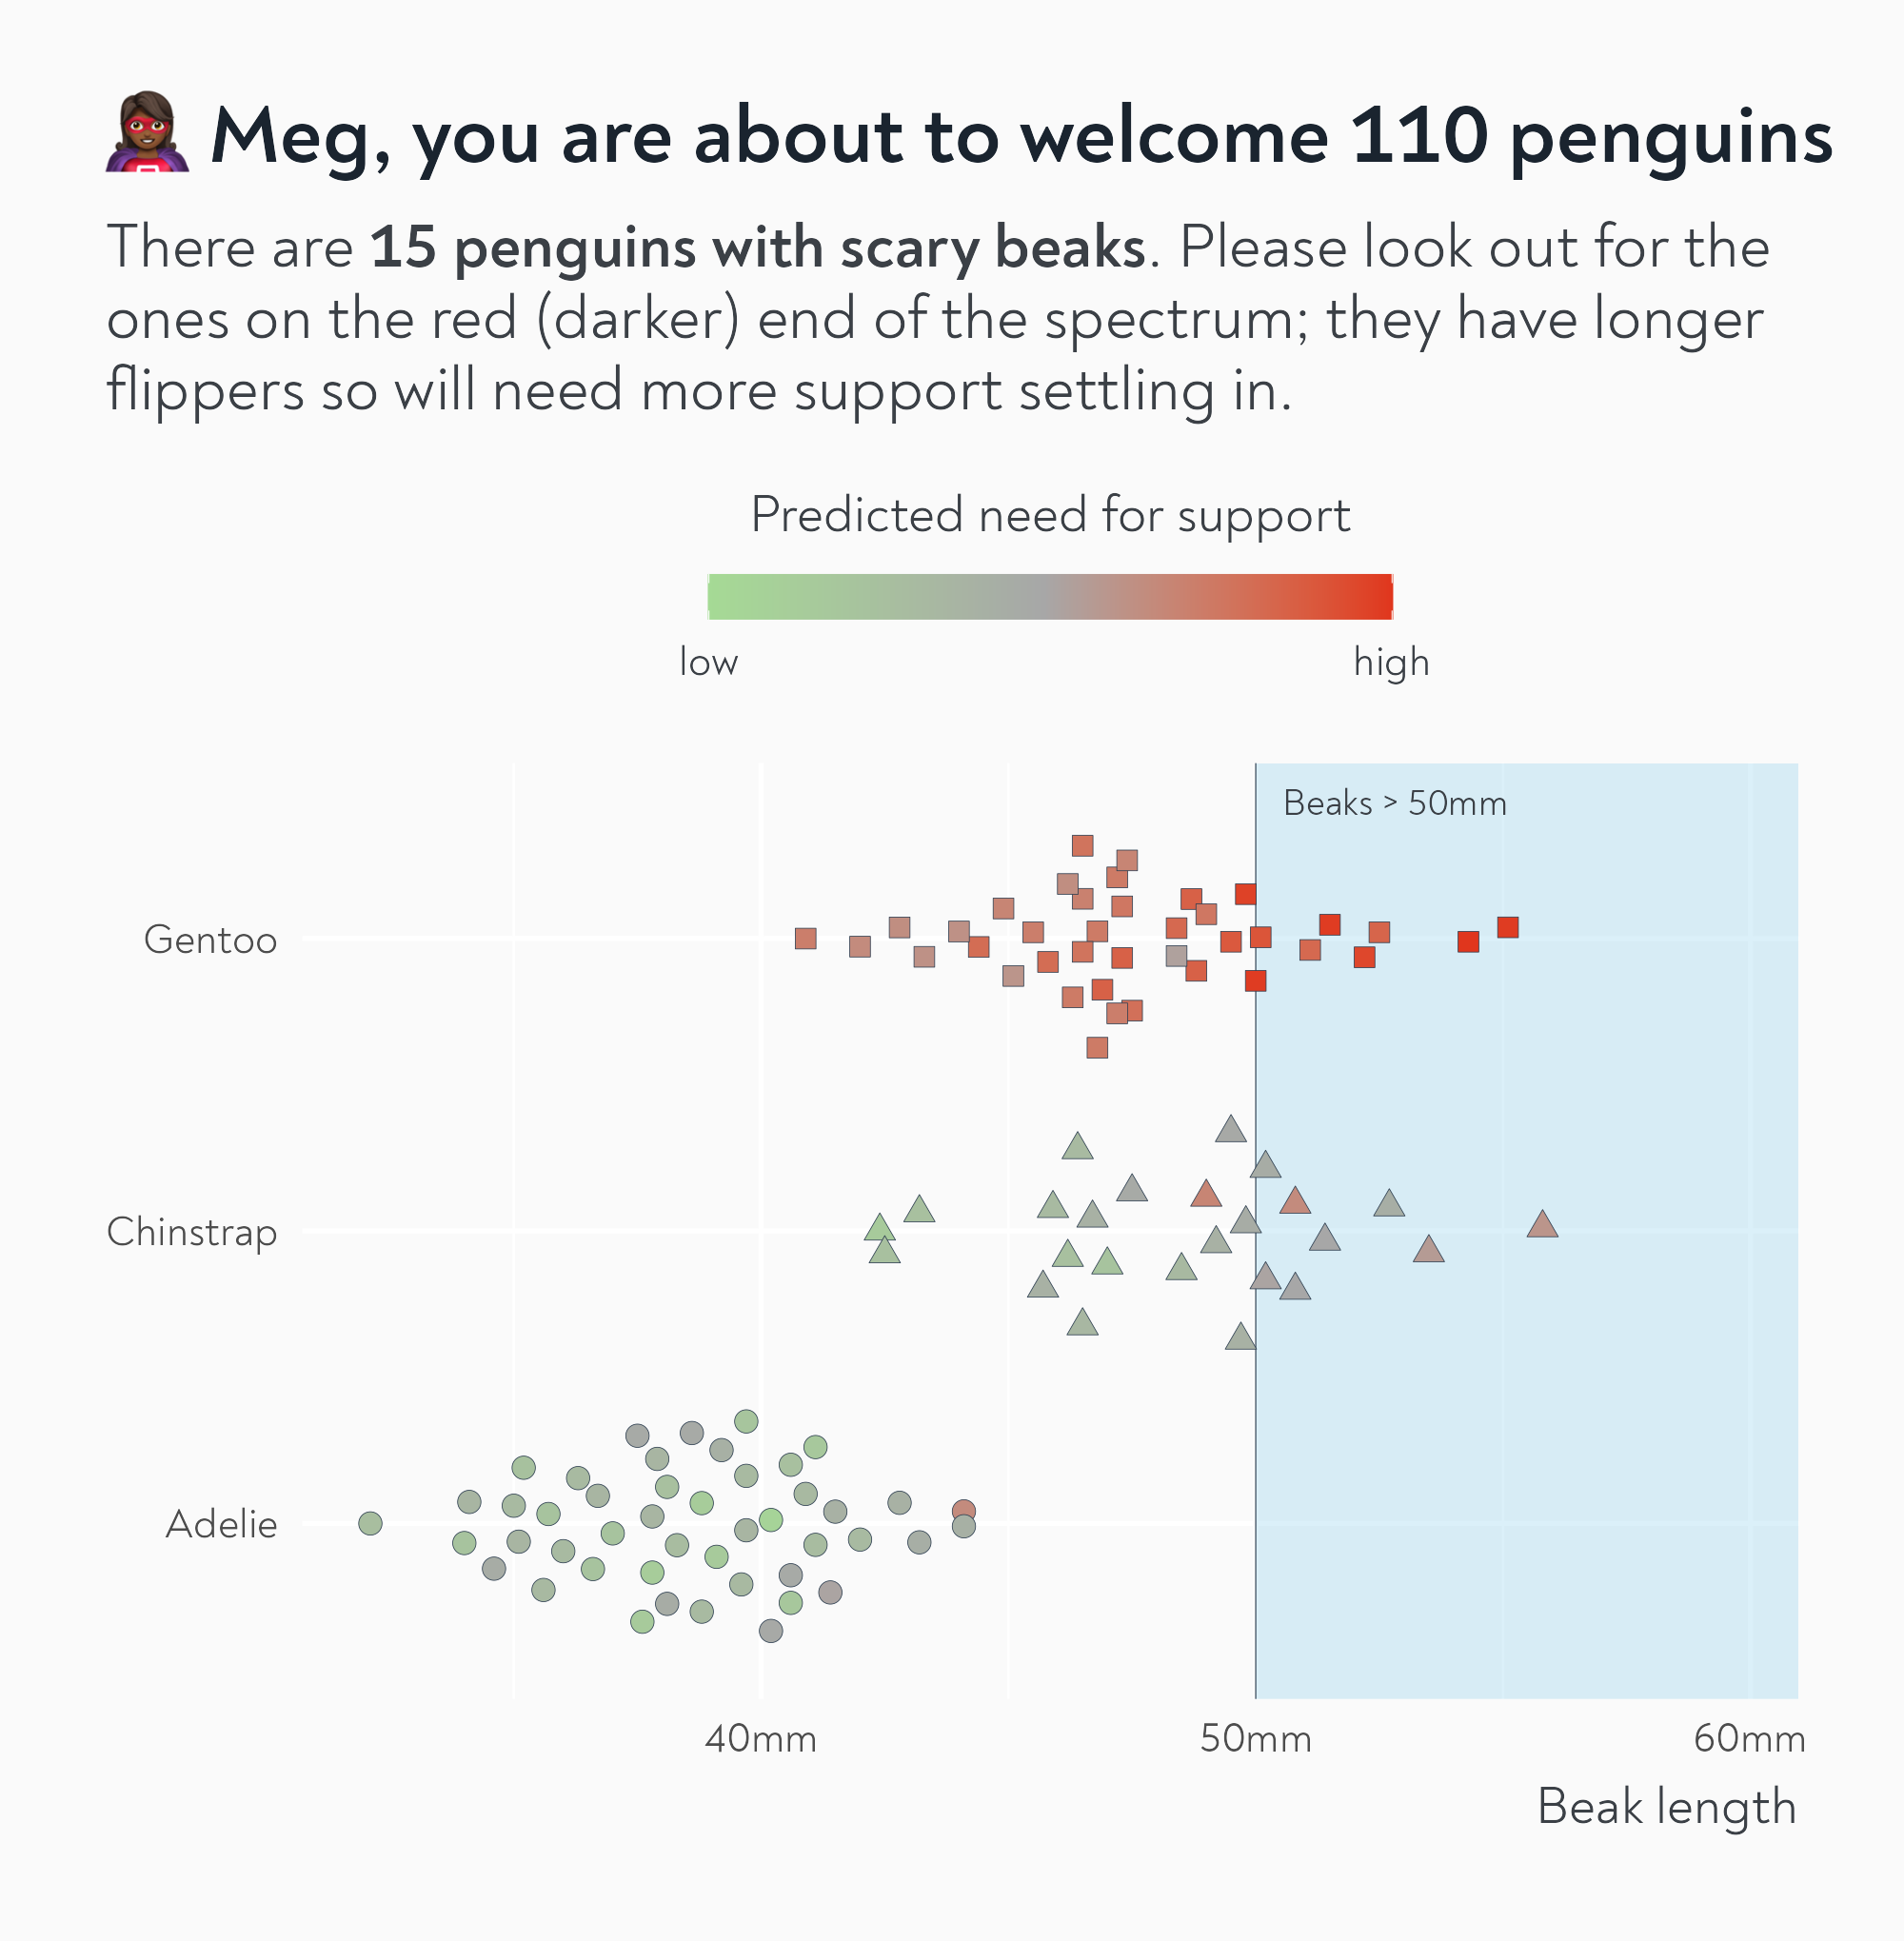
title = paste0(
"We are about to welcome ",
nrow(penguins),
" penguins"
),
subtitle = paste0(
"There are **",
verbaliseR::pluralise(
sum(penguins$bill_len > 50, na.rm = TRUE),
word = "penguin"
),
" with scary beaks**. Please look out for the ones on the red (darker) end of the spectrum; they have longer flippers so will need more support settling in."
),
colour = "Predicted need for support"
) +
scale_x_continuous(label = function(x) paste0(x, "mm")) +
scale_shape(guide = "none") +
scale_colour_gradient2(
low = "#a5dc94",
mid = "#a7a7a7",
high = "#e0361d",
midpoint = mean(penguins$flipper_len, na.rm = TRUE),
limits = c(
min(penguins$flipper_len, na.rm = TRUE),
max(penguins$flipper_len, na.rm = TRUE)
),
breaks = c(
min(penguins$flipper_len, na.rm = TRUE),
max(penguins$flipper_len, na.rm = TRUE)
),
labels = c("low", "high")
) +
theme(
text = element_text(family = "Noah", colour = "#3b4046"),
plot.subtitle = marquee::element_marquee(
width = 1,
family = "Noah",
size = rel(1.2)
),
plot.title = element_text(
face = "bold",
size = rel(1.6),
colour = "#1A242F"
),
legend.title = element_text(hjust = 0.5),
axis.title.y = element_blank(),
panel.grid = element_line(colour = "white"),
plot.background = element_rect(fill = "#fafafa", colour = "#fafafa"),
plot.margin = margin_auto(40),
axis.title.x = element_text(hjust = 1, margin = margin(10, 0, 0, 0)),
legend.position = "top",
plot.title.position = "plot",
legend.title.position = "top",
legend.justification = 0.5,
legend.key.width = unit(3.6, "lines")
)
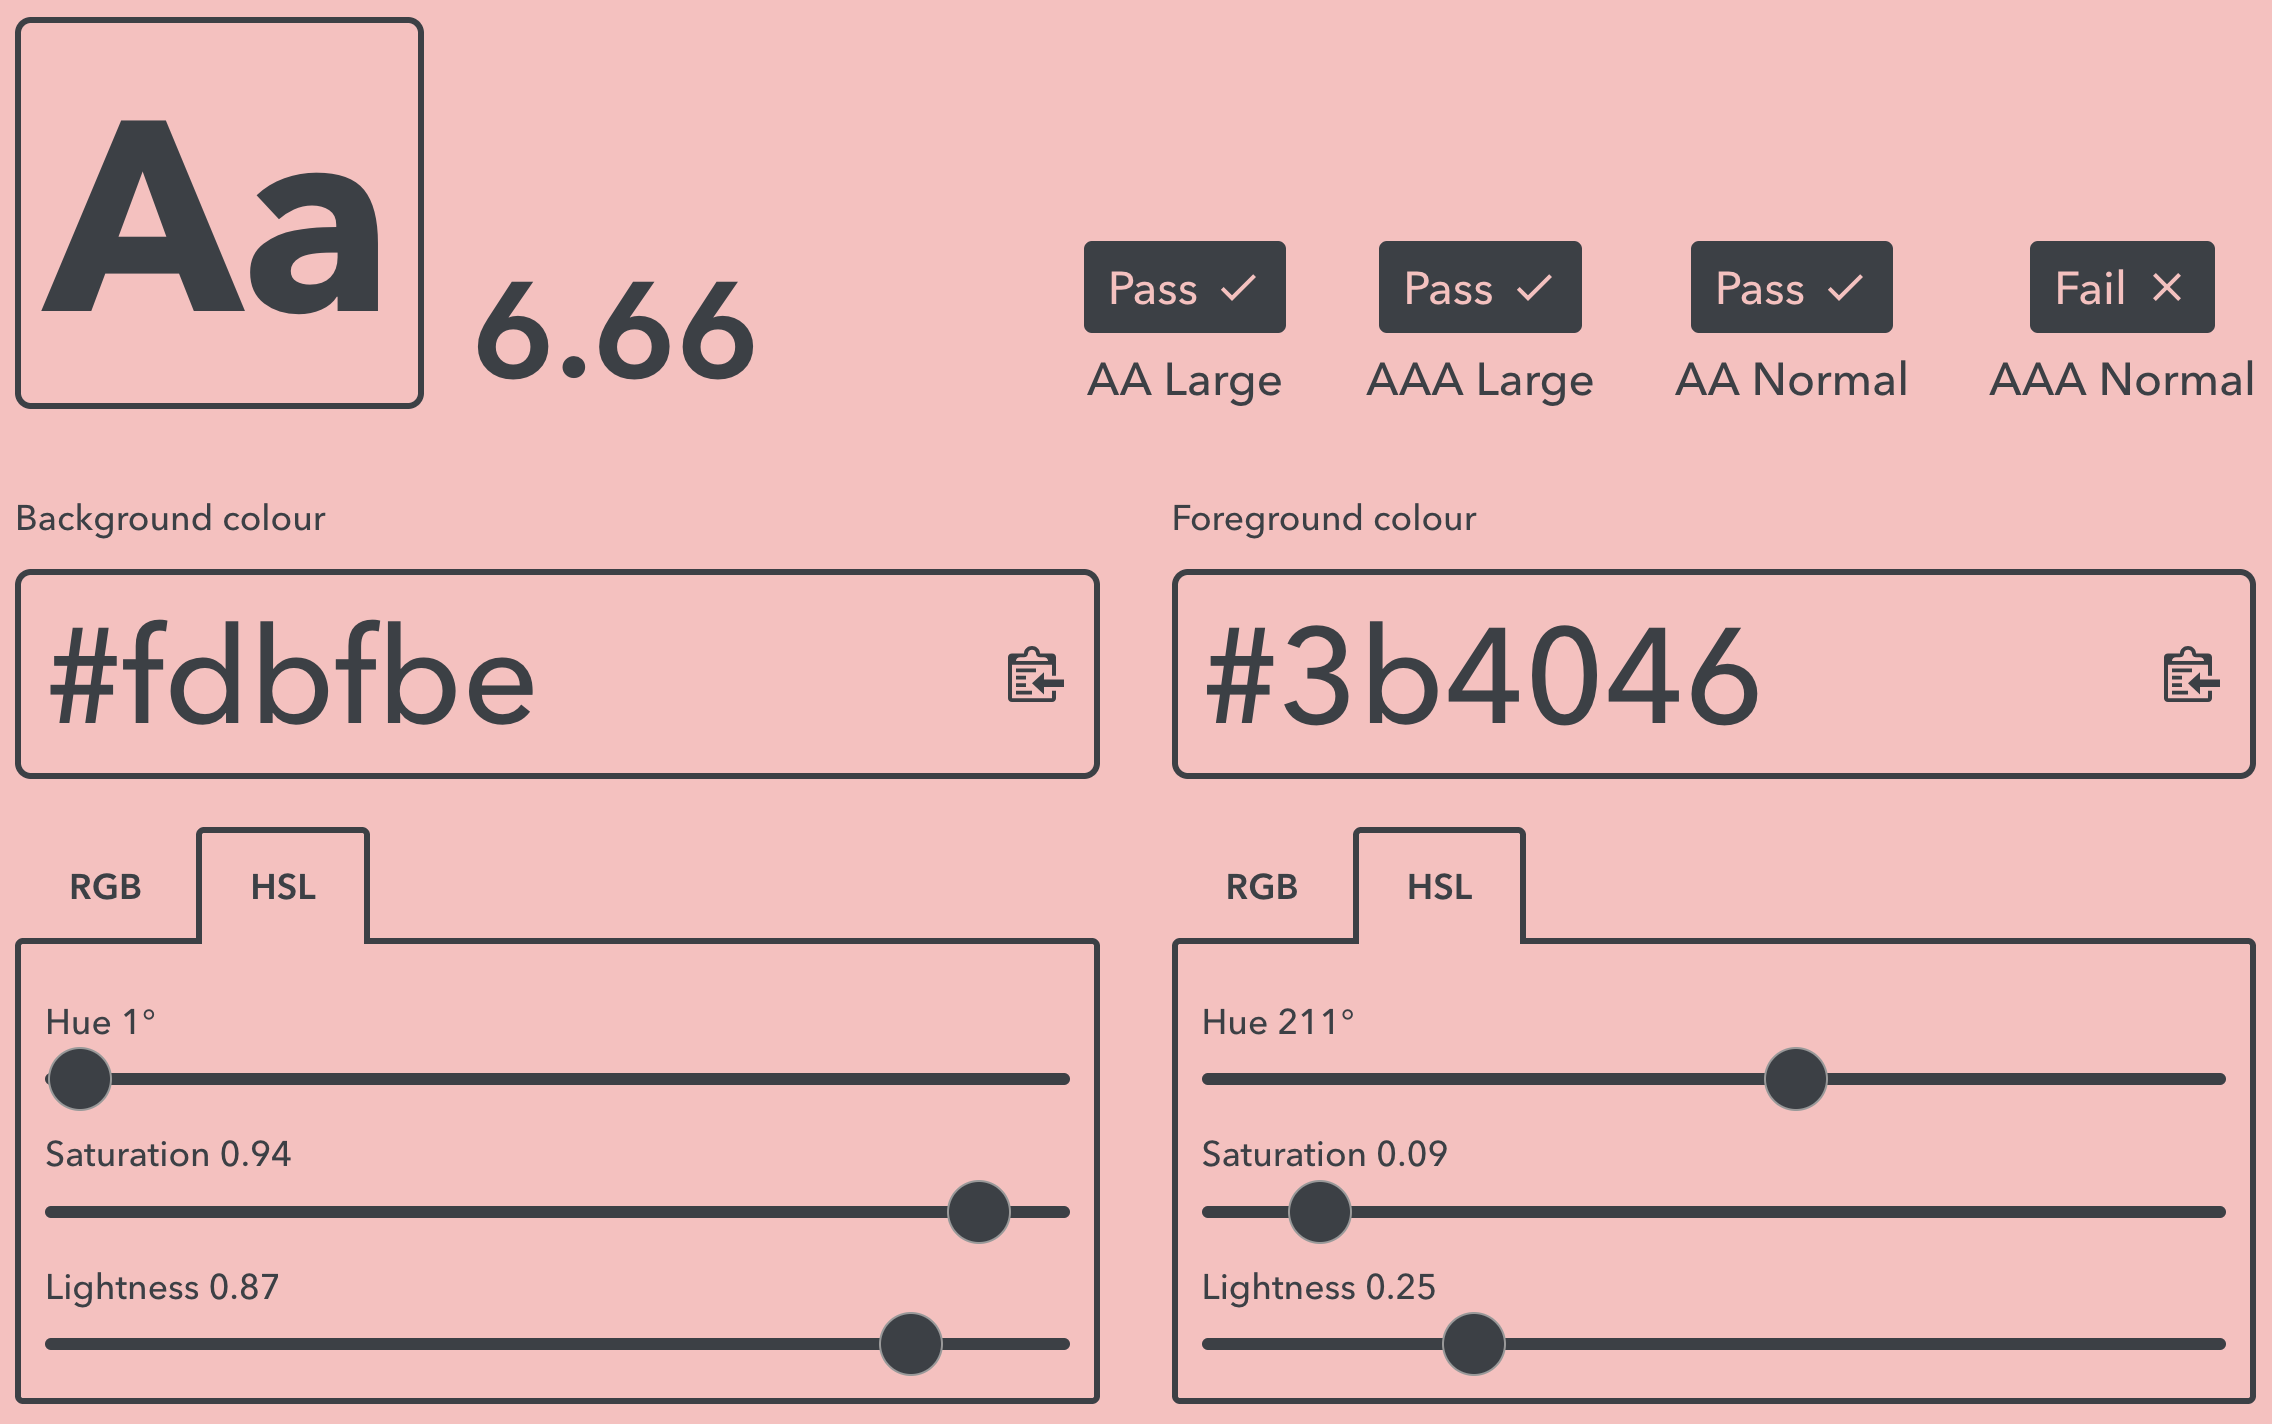
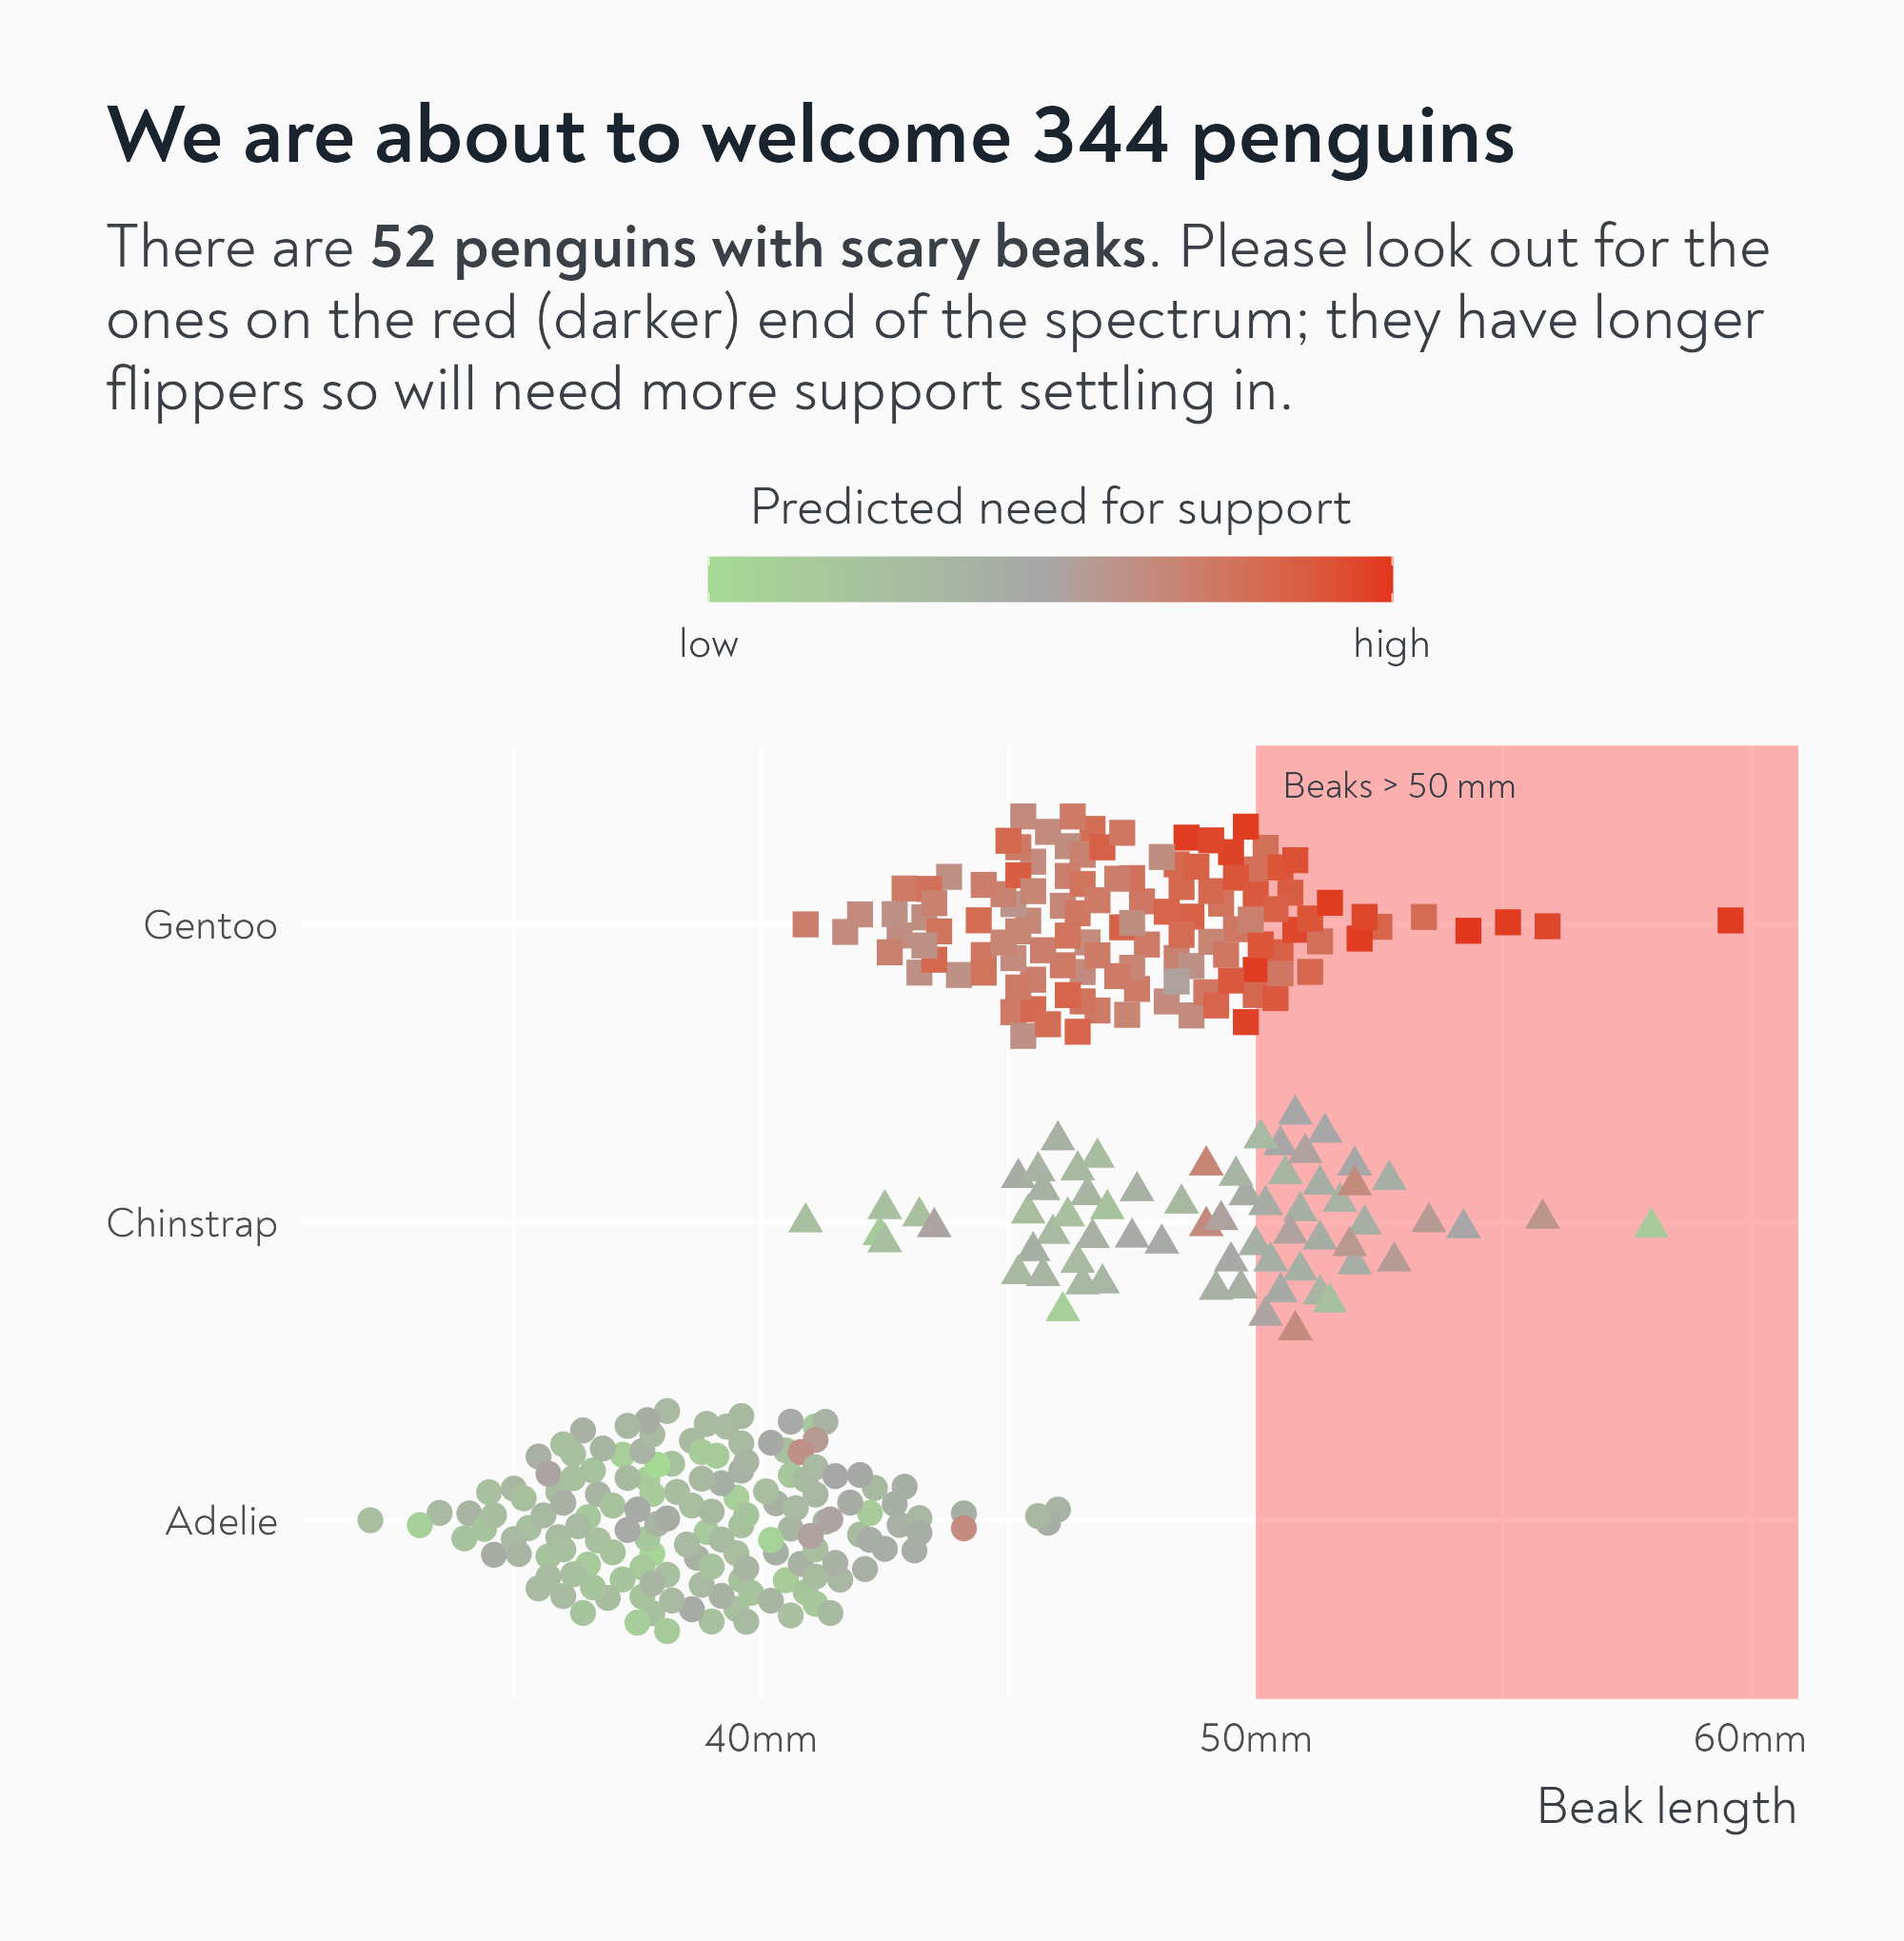
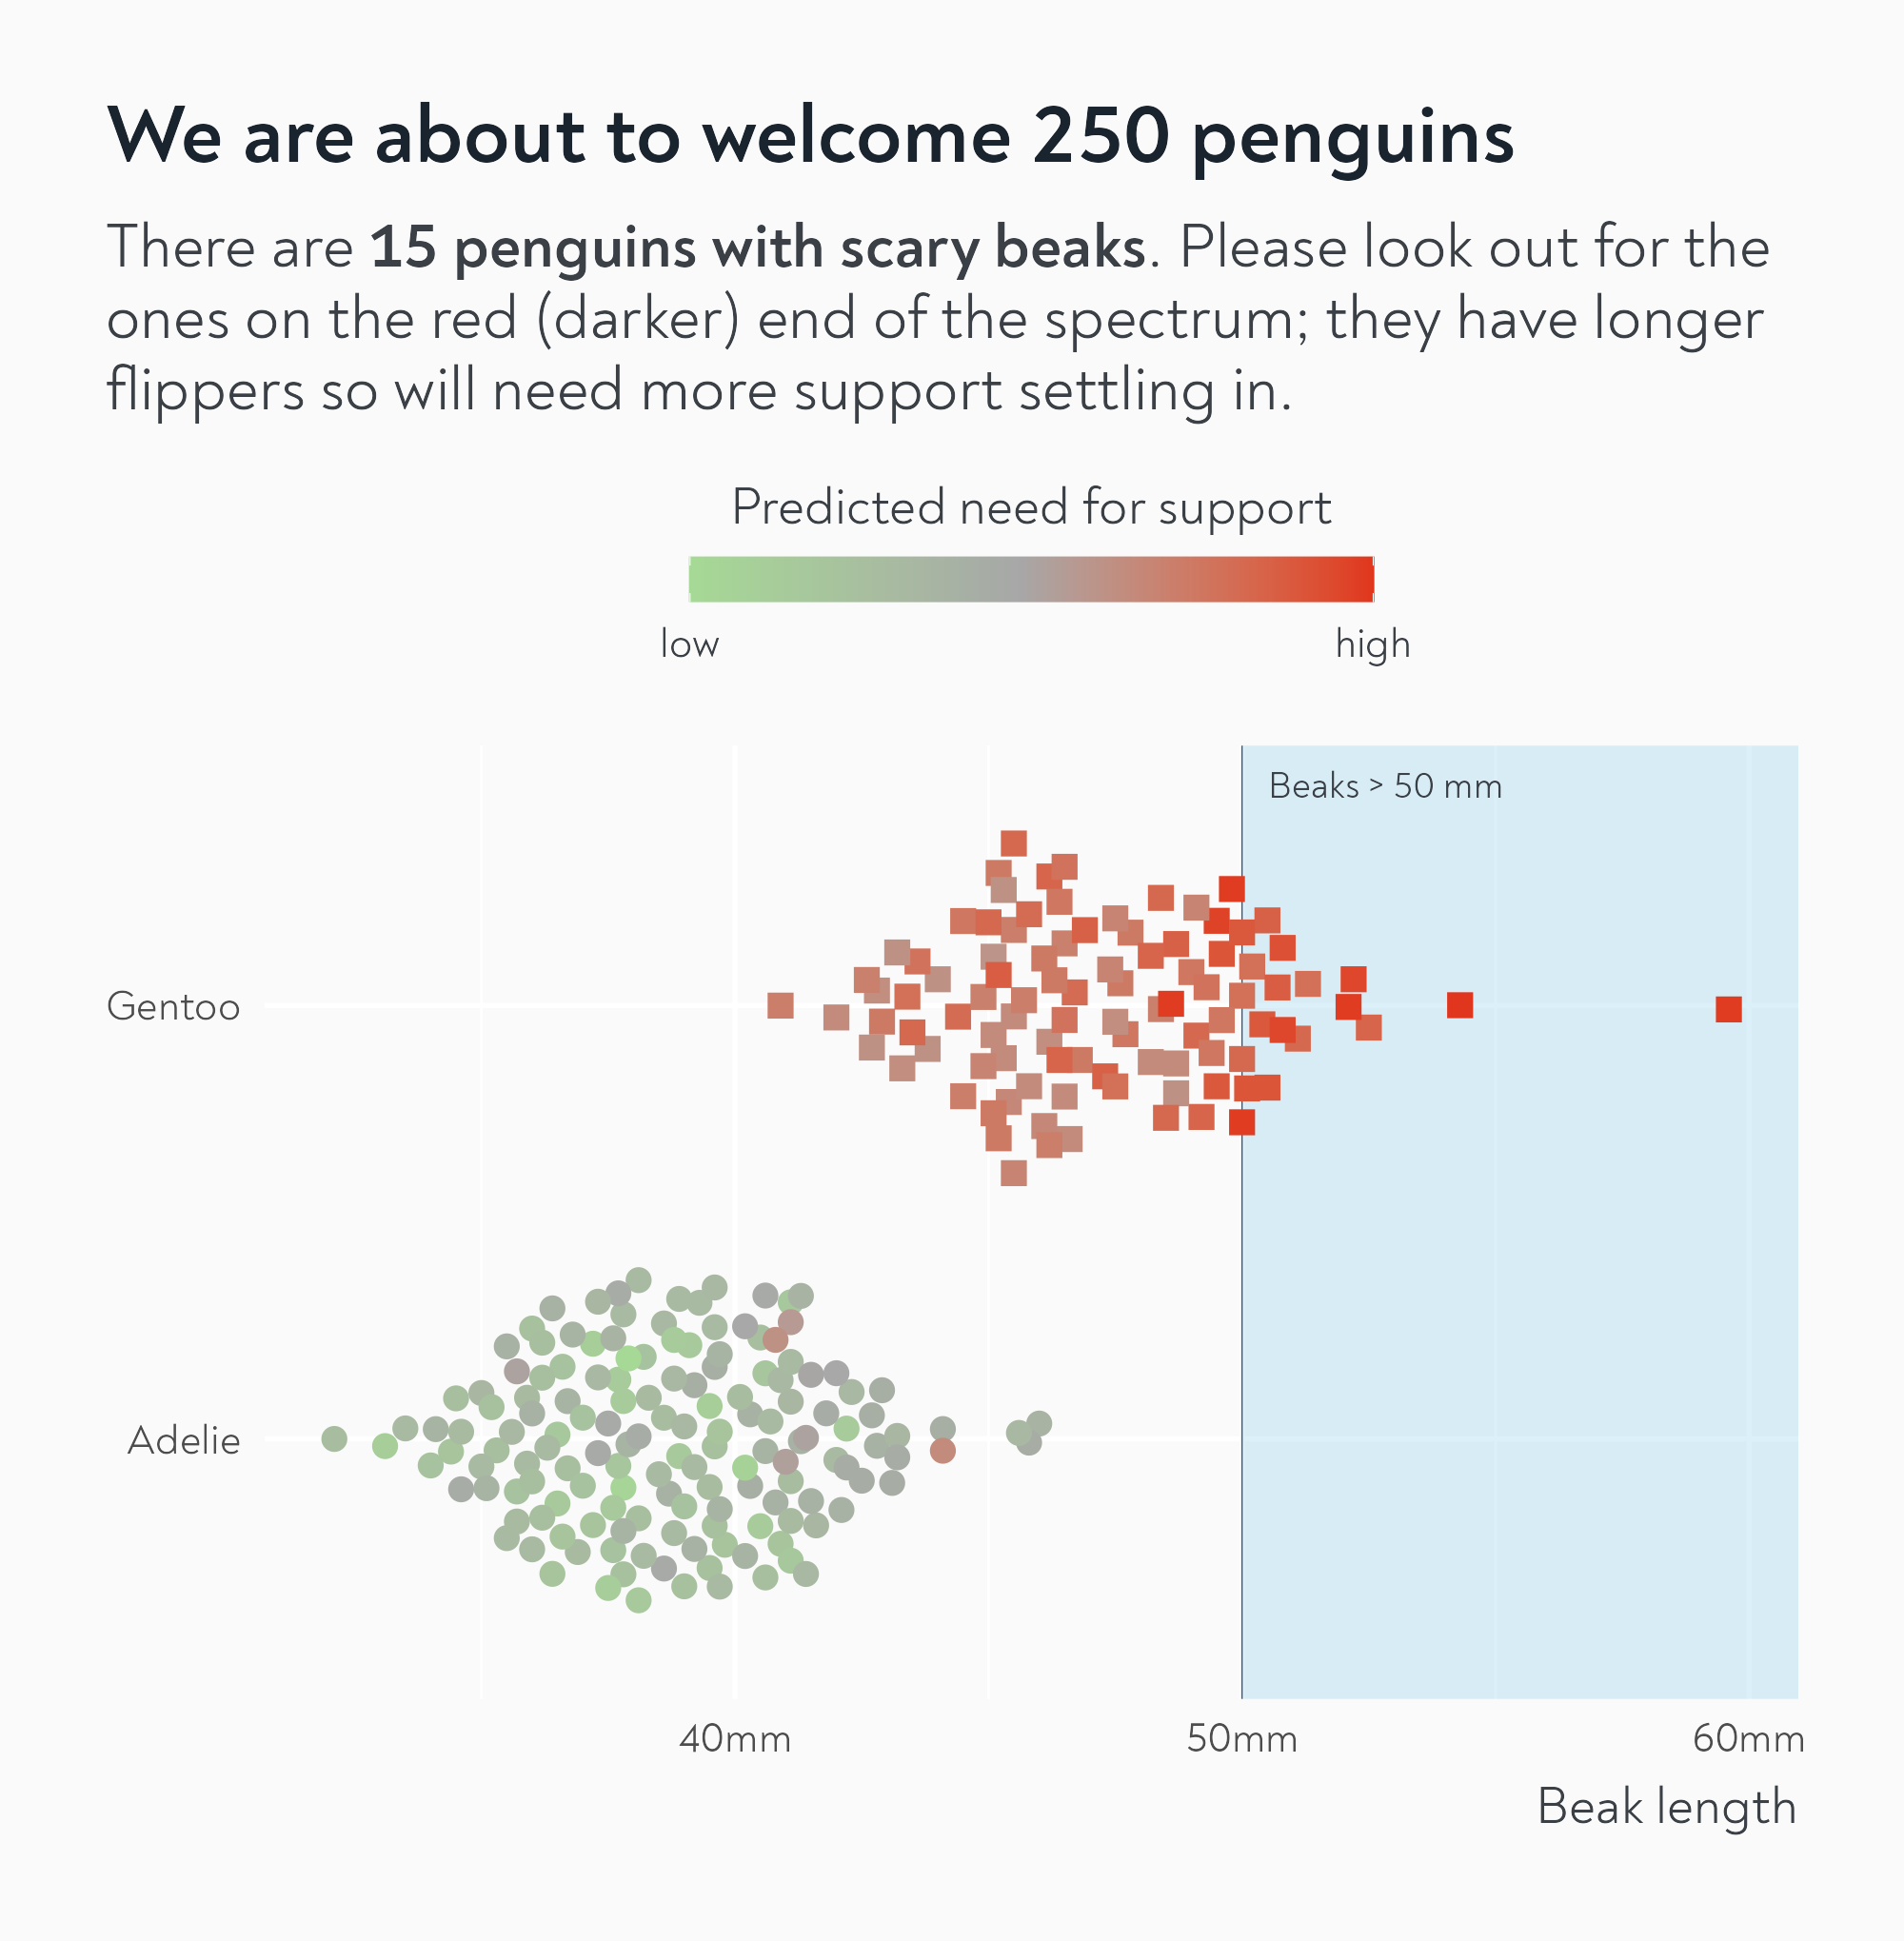
Fix 4: Check your colour contrasts
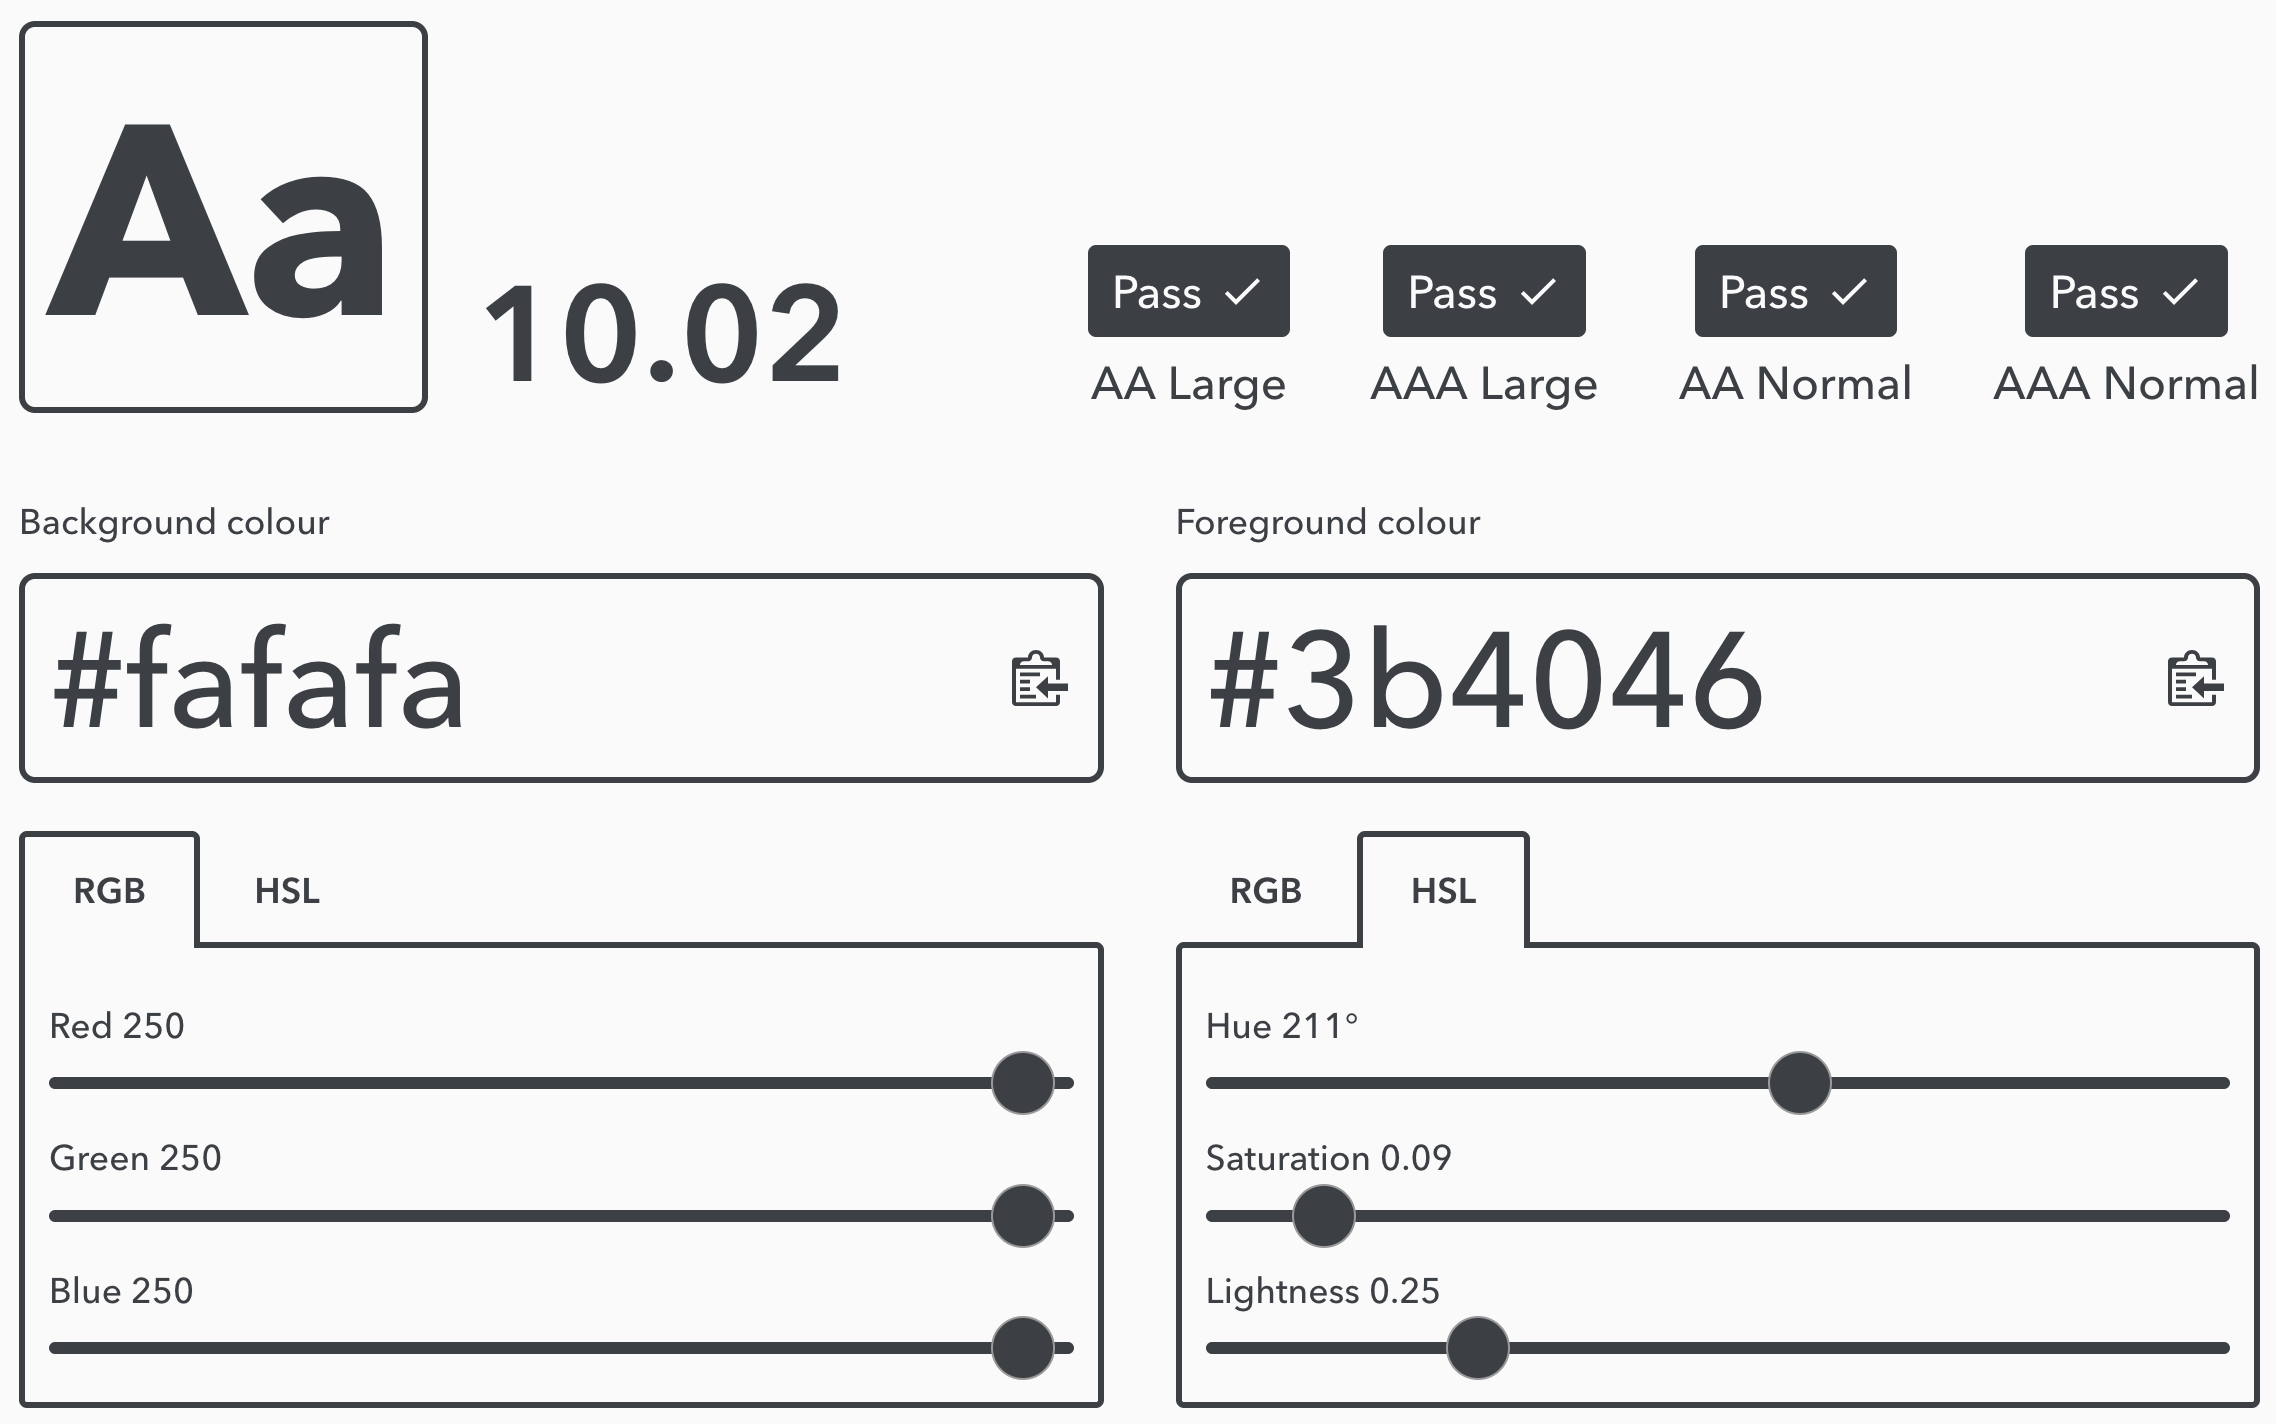
Fix 4: Check your colour contrasts
Fix 4: Check your colour contrasts
Fix 4: Check your colour contrasts
Starting point
penguins |>
ggplot() +
annotate(
"rect",
xmin = 50,
xmax = Inf,
ymin = -Inf,
ymax = Inf,
fill = alpha("red", 0.3)
) +
ggtext::geom_textbox(
data = data.frame(),
aes(x = 50, y = Inf, label = "Beaks > 50 mm"),
fill = NA,
box.colour = NA,
hjust = 0,
vjust = 1,
box.padding = unit(10, "pt"),
family = "Noah",
colour = "#3b4046",
size = 5
) +
ggbeeswarm::geom_quasirandom(
aes(
x = bill_len,
y = species,
shape = species,
colour = flipper_len
),
size = 4
) +
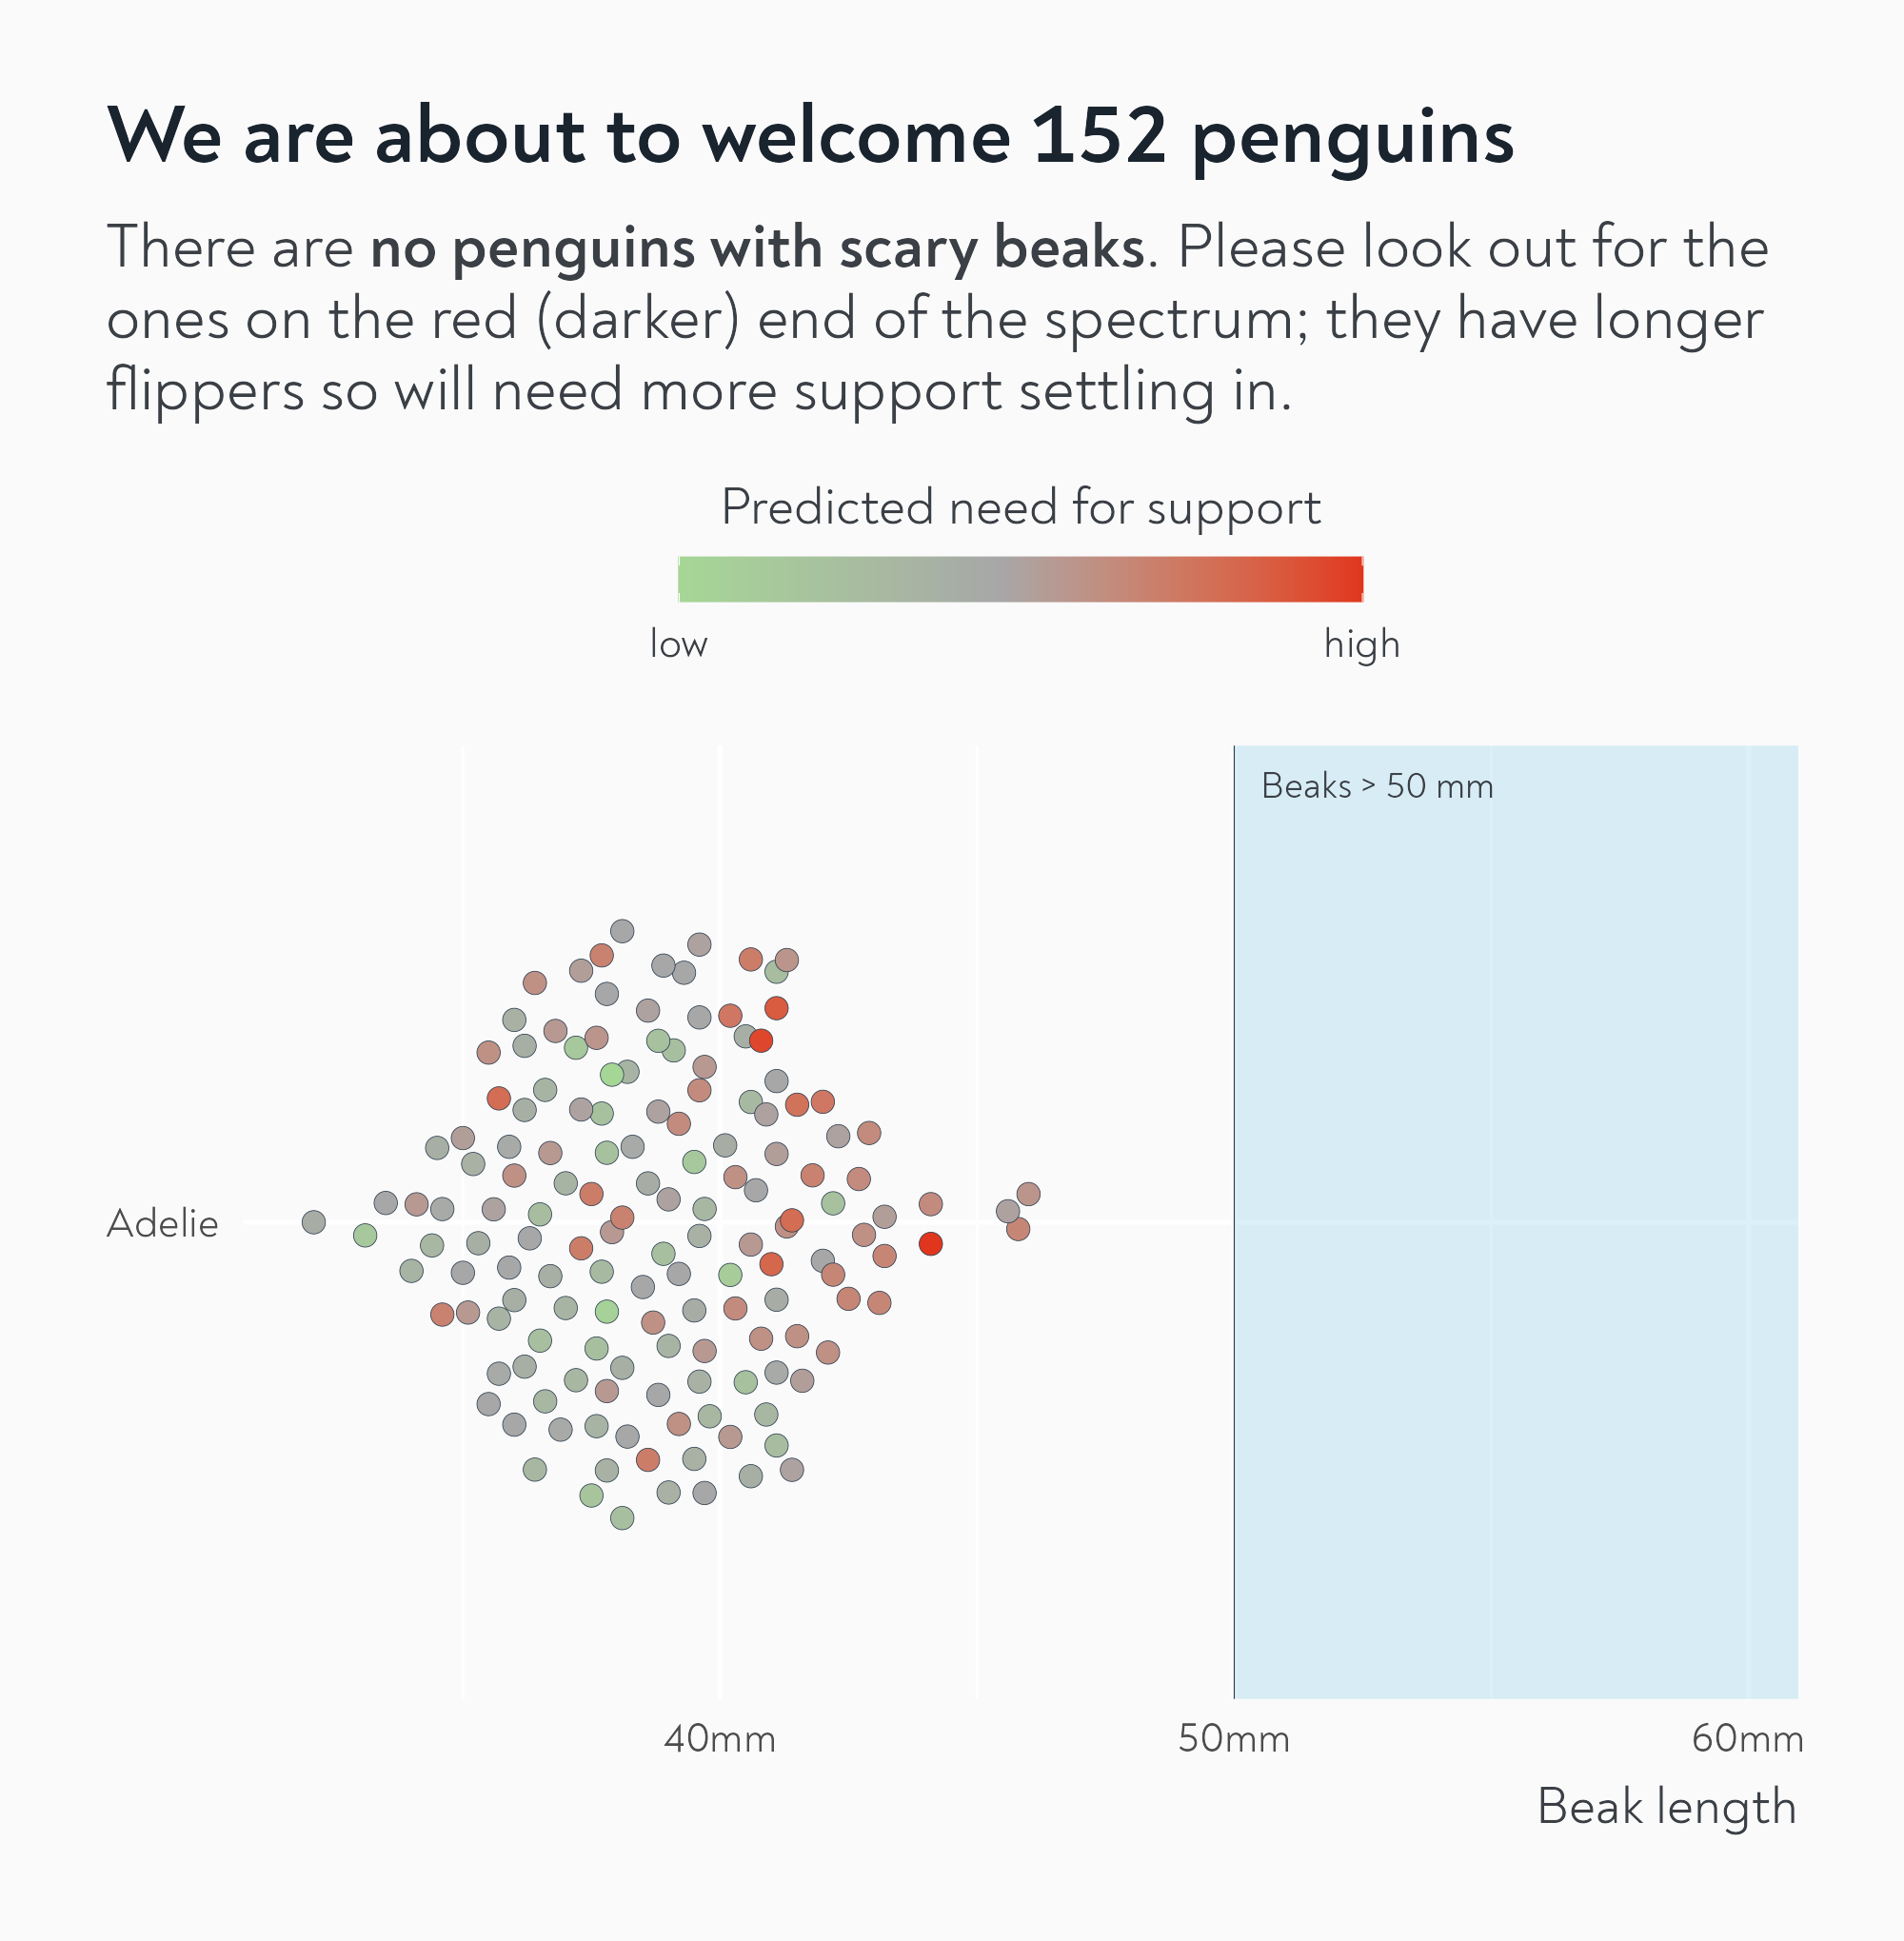
labs(
x = "Beak length",
title = paste0(
"We are about to welcome ",
nrow(penguins),
" penguins"
),
subtitle = paste0(
"There are **",
verbaliseR::pluralise(
sum(penguins$bill_len > 50, na.rm = TRUE),
word = "penguin"
),
" with scary beaks**. Please look out for the ones on the red (darker) end of the spectrum; they have longer flippers so will need more support settling in."
),
colour = "Predicted need for support"
) +
scale_x_continuous(label = function(x) paste0(x, "mm")) +
scale_shape(guide = "none") +
scale_colour_gradient2(
low = "#a5dc94",
mid = "#a7a7a7",
high = "#e0361d",
midpoint = mean(penguins$flipper_len, na.rm = TRUE),
limits = c(
min(penguins$flipper_len, na.rm = TRUE),
max(penguins$flipper_len, na.rm = TRUE)
),
breaks = c(
min(penguins$flipper_len, na.rm = TRUE),
max(penguins$flipper_len, na.rm = TRUE)
),
labels = c("low", "high")
) +
theme(
text = element_text(family = "Noah", colour = "#3b4046"),
plot.subtitle = marquee::element_marquee(
width = 1,
family = "Noah",
size = rel(1.2)
),
plot.title = element_text(
face = "bold",
size = rel(1.6),
colour = "#1A242F"
),
legend.title = element_text(hjust = 0.5),
axis.title.y = element_blank(),
panel.grid = element_line(colour = "white"),
plot.background = element_rect(fill = "#fafafa", colour = "#fafafa"),
plot.margin = margin_auto(40),
axis.title.x = element_text(hjust = 1, margin = margin(10, 0, 0, 0)),
legend.position = "top",
plot.title.position = "plot",
legend.title.position = "top",
legend.justification = 0.5,
legend.key.width = unit(3.6, "lines")
)
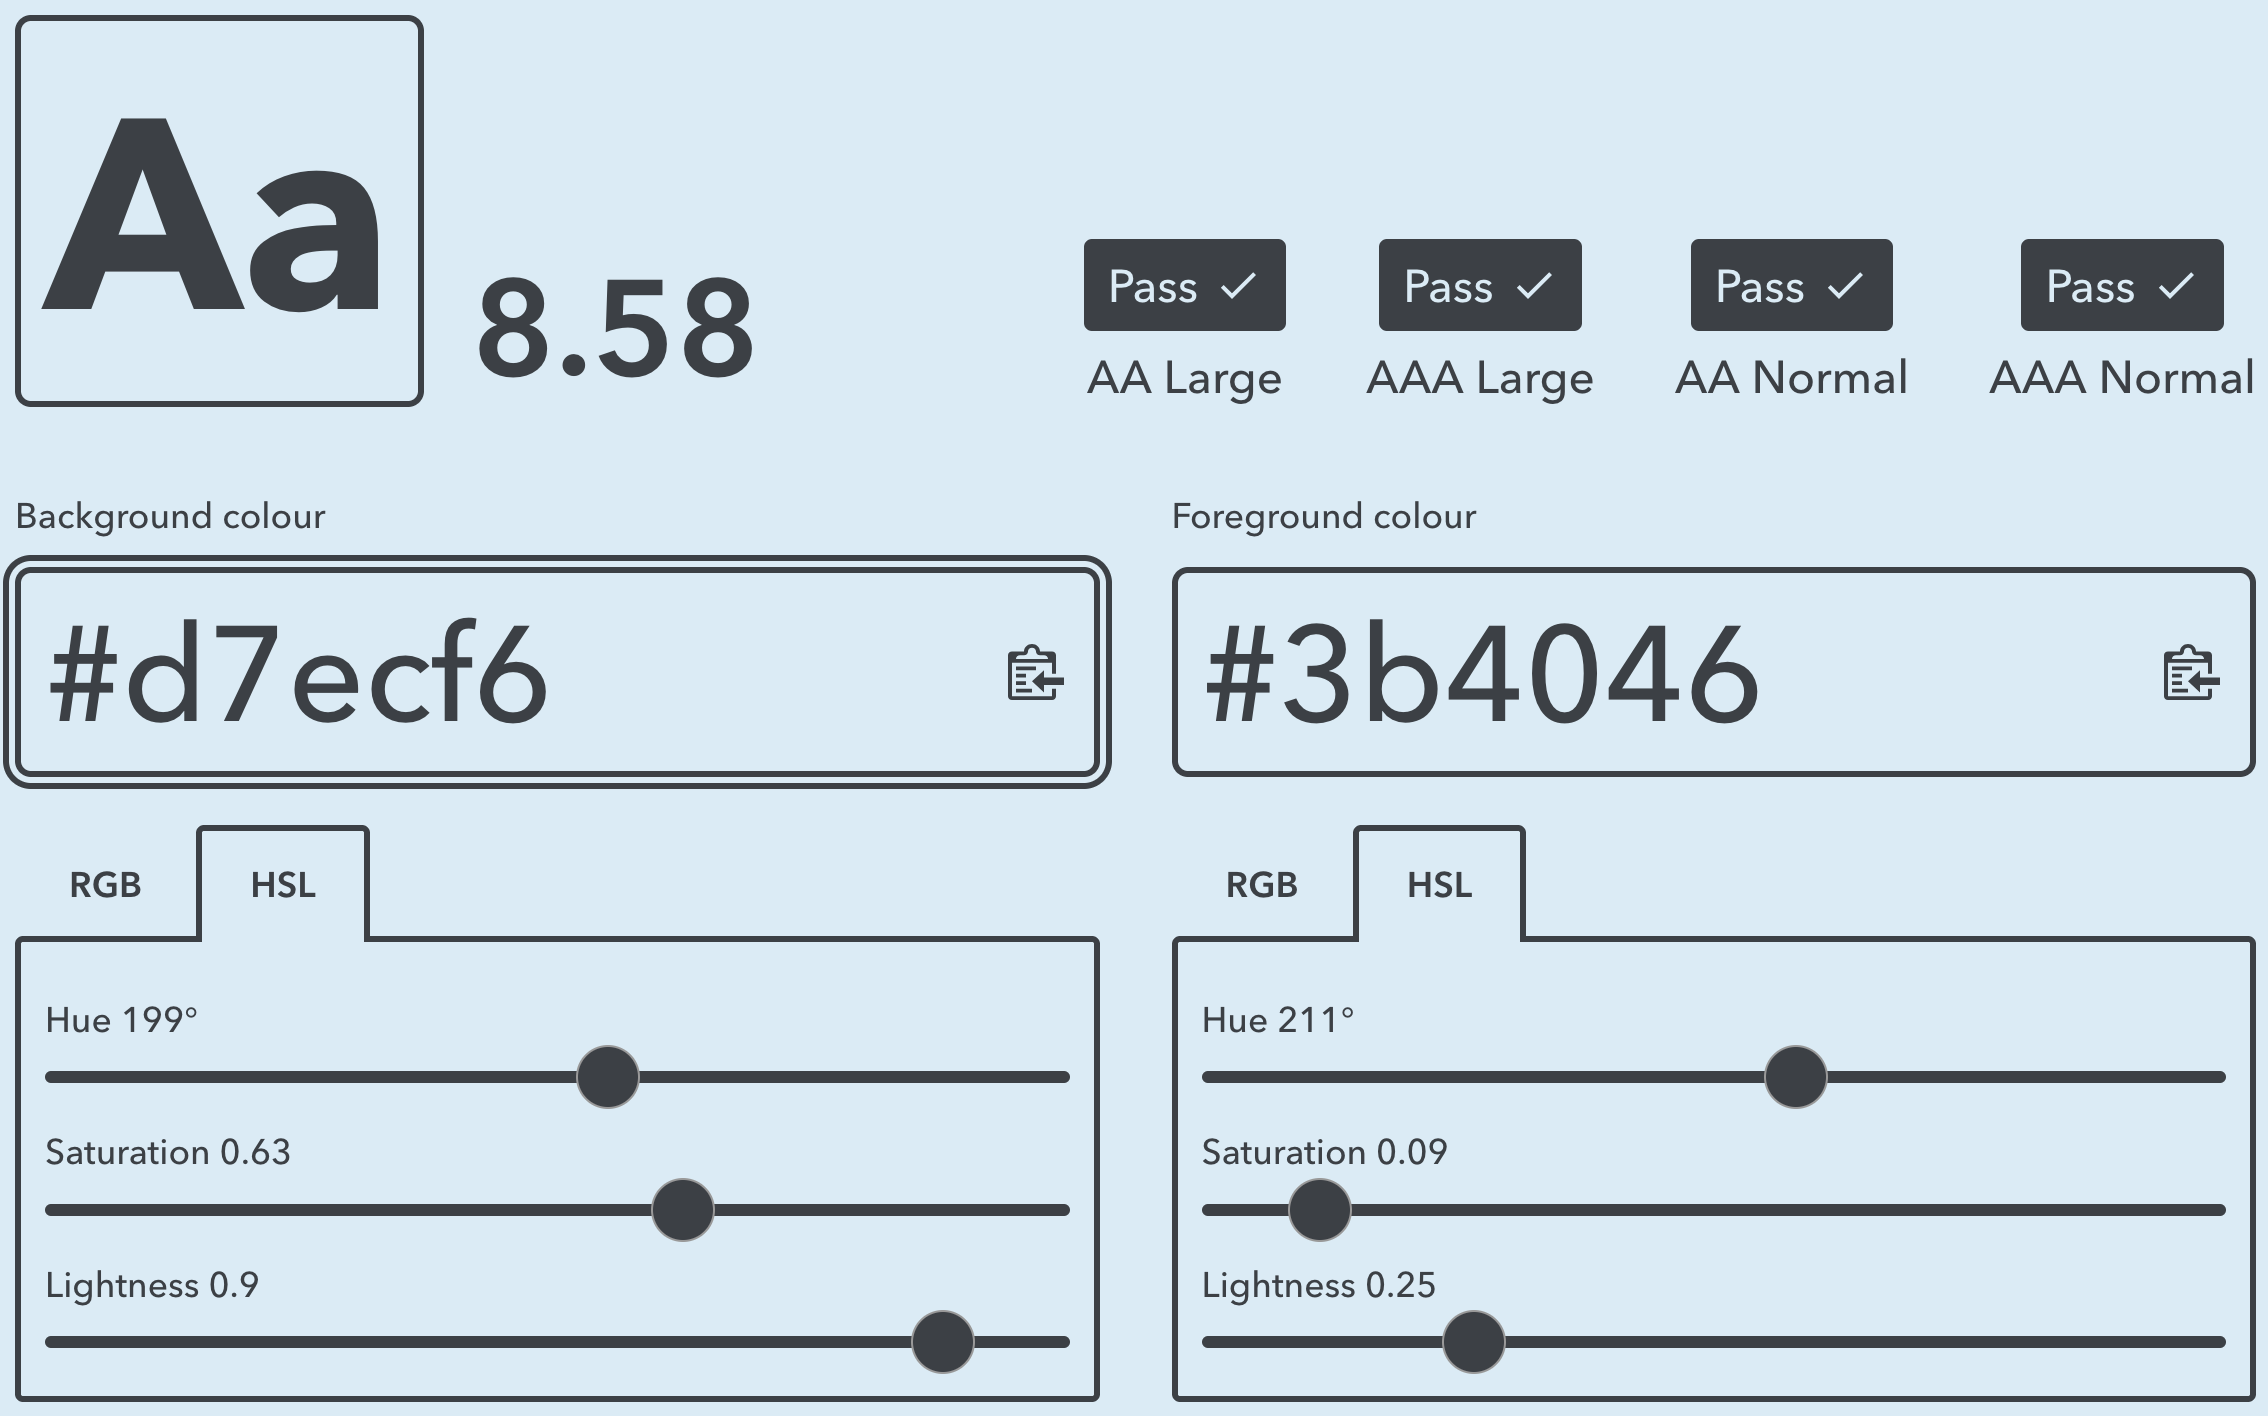
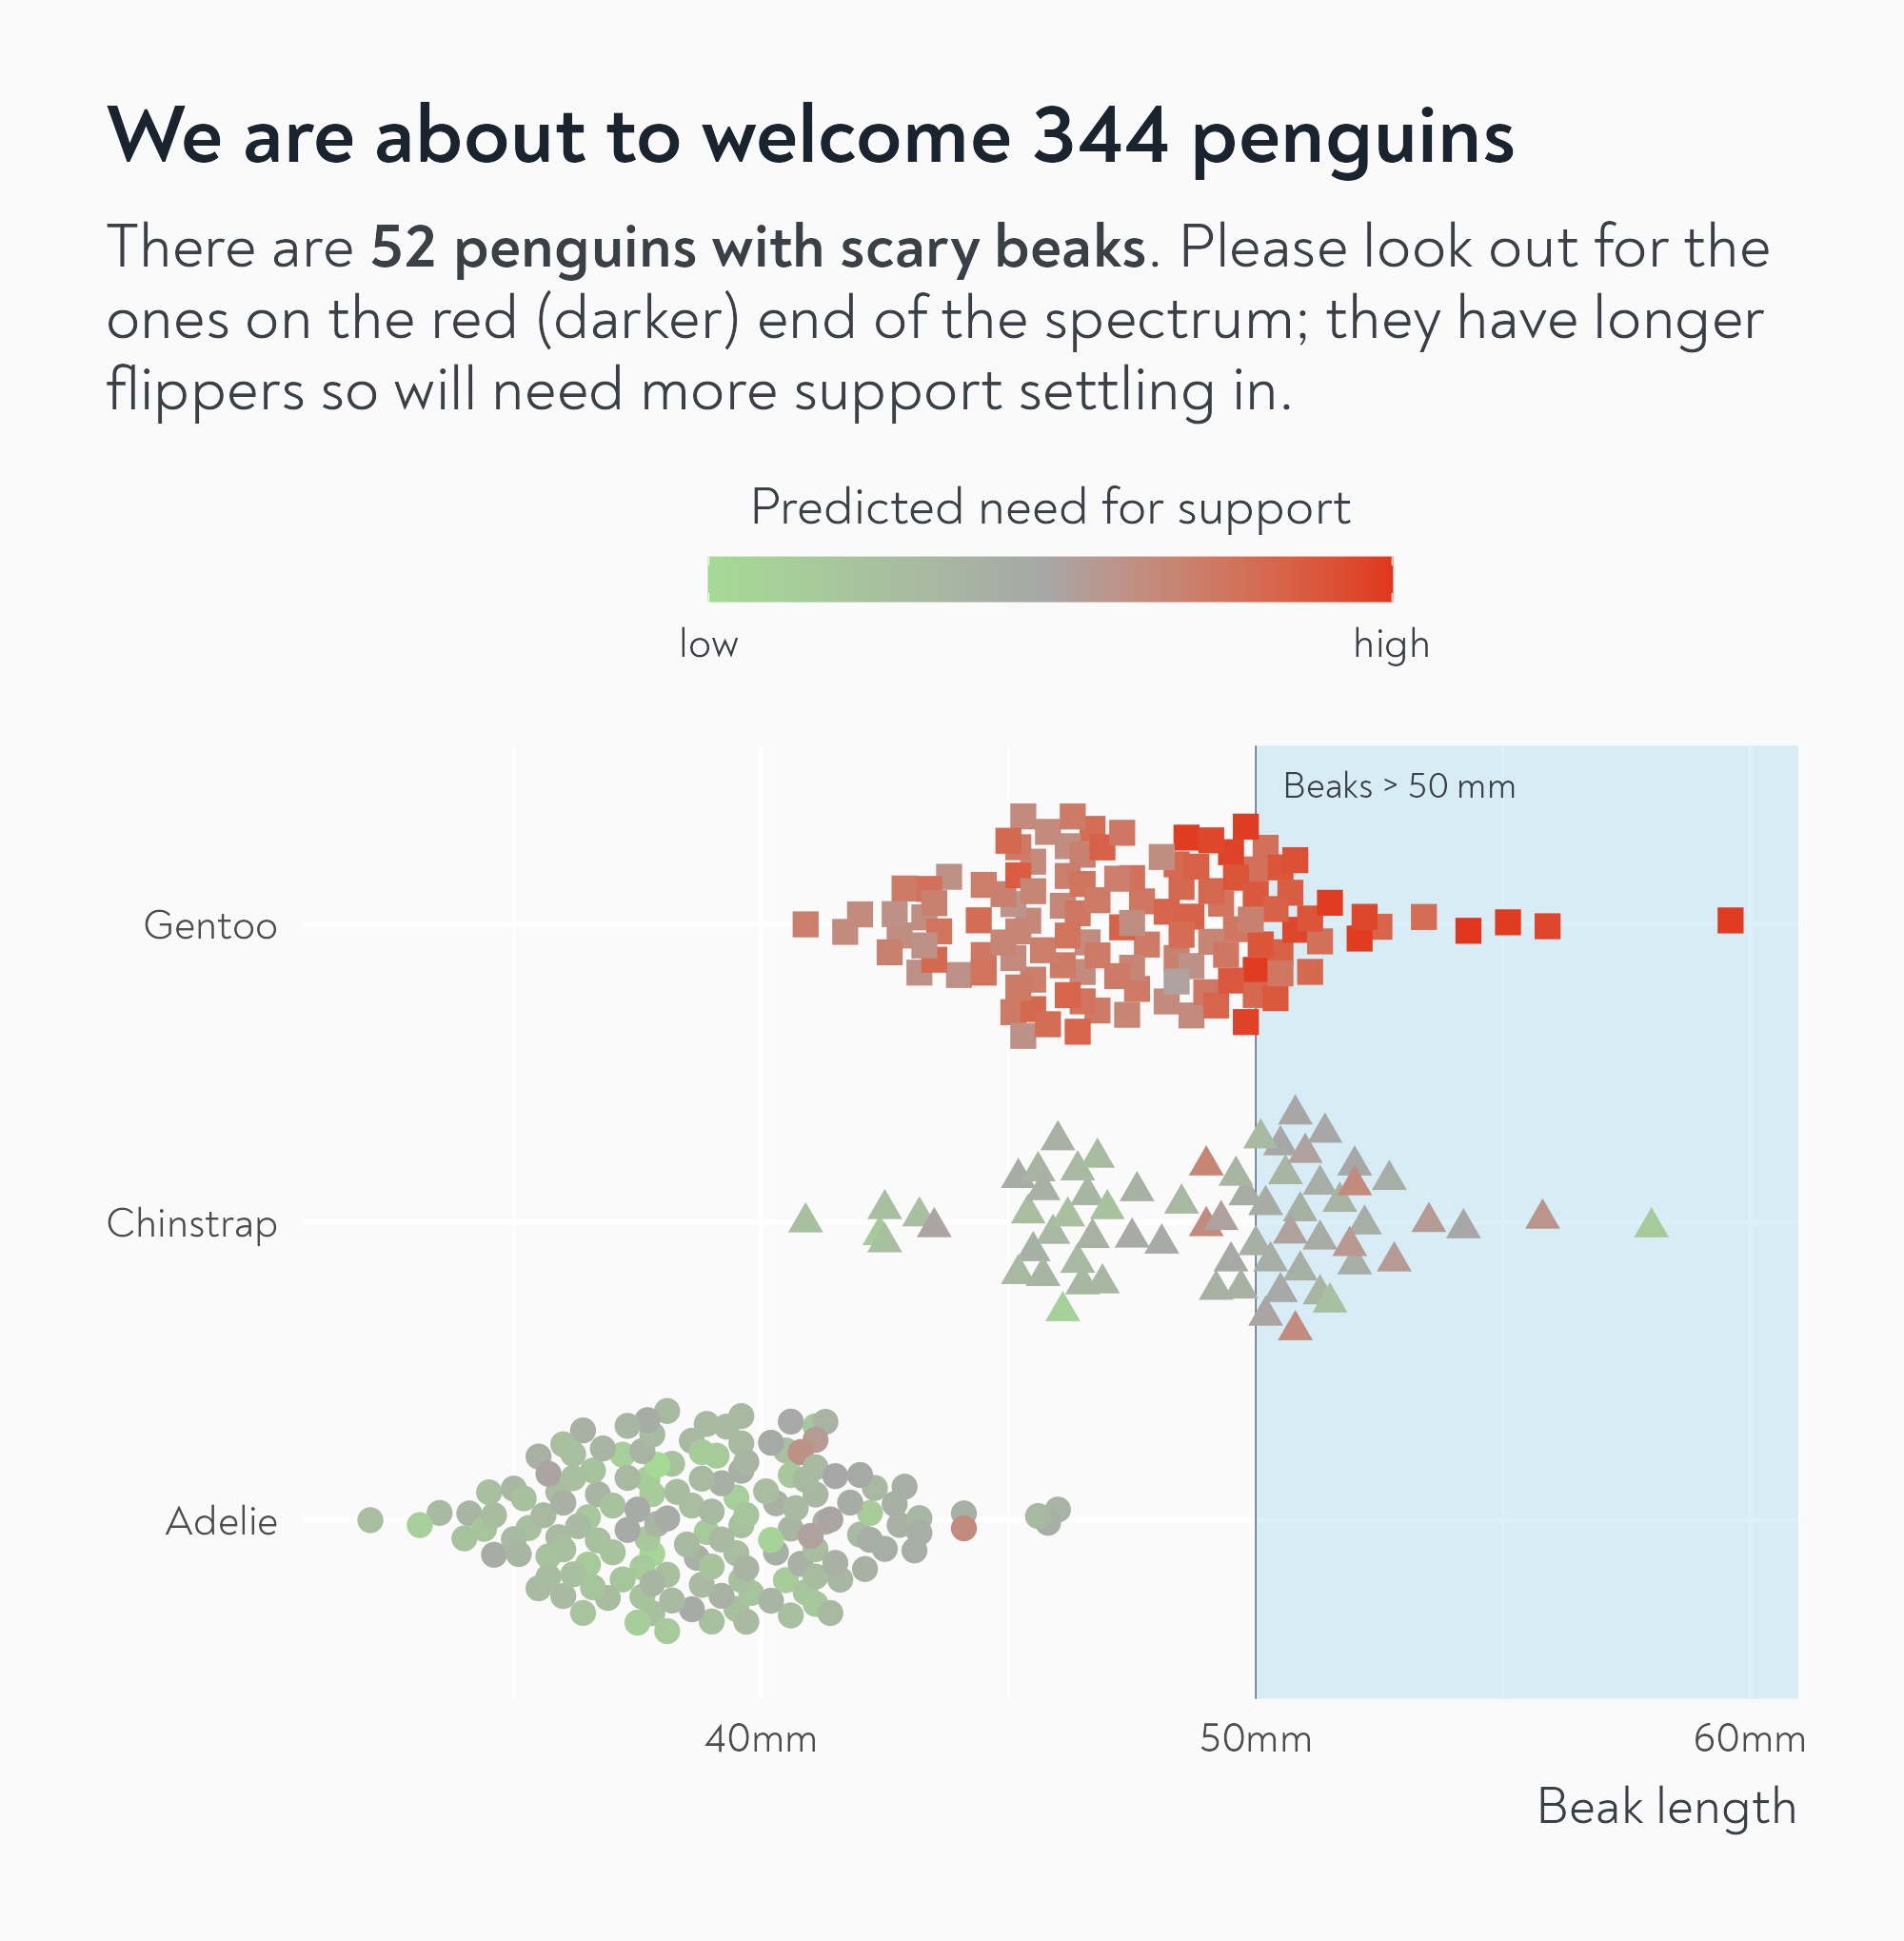
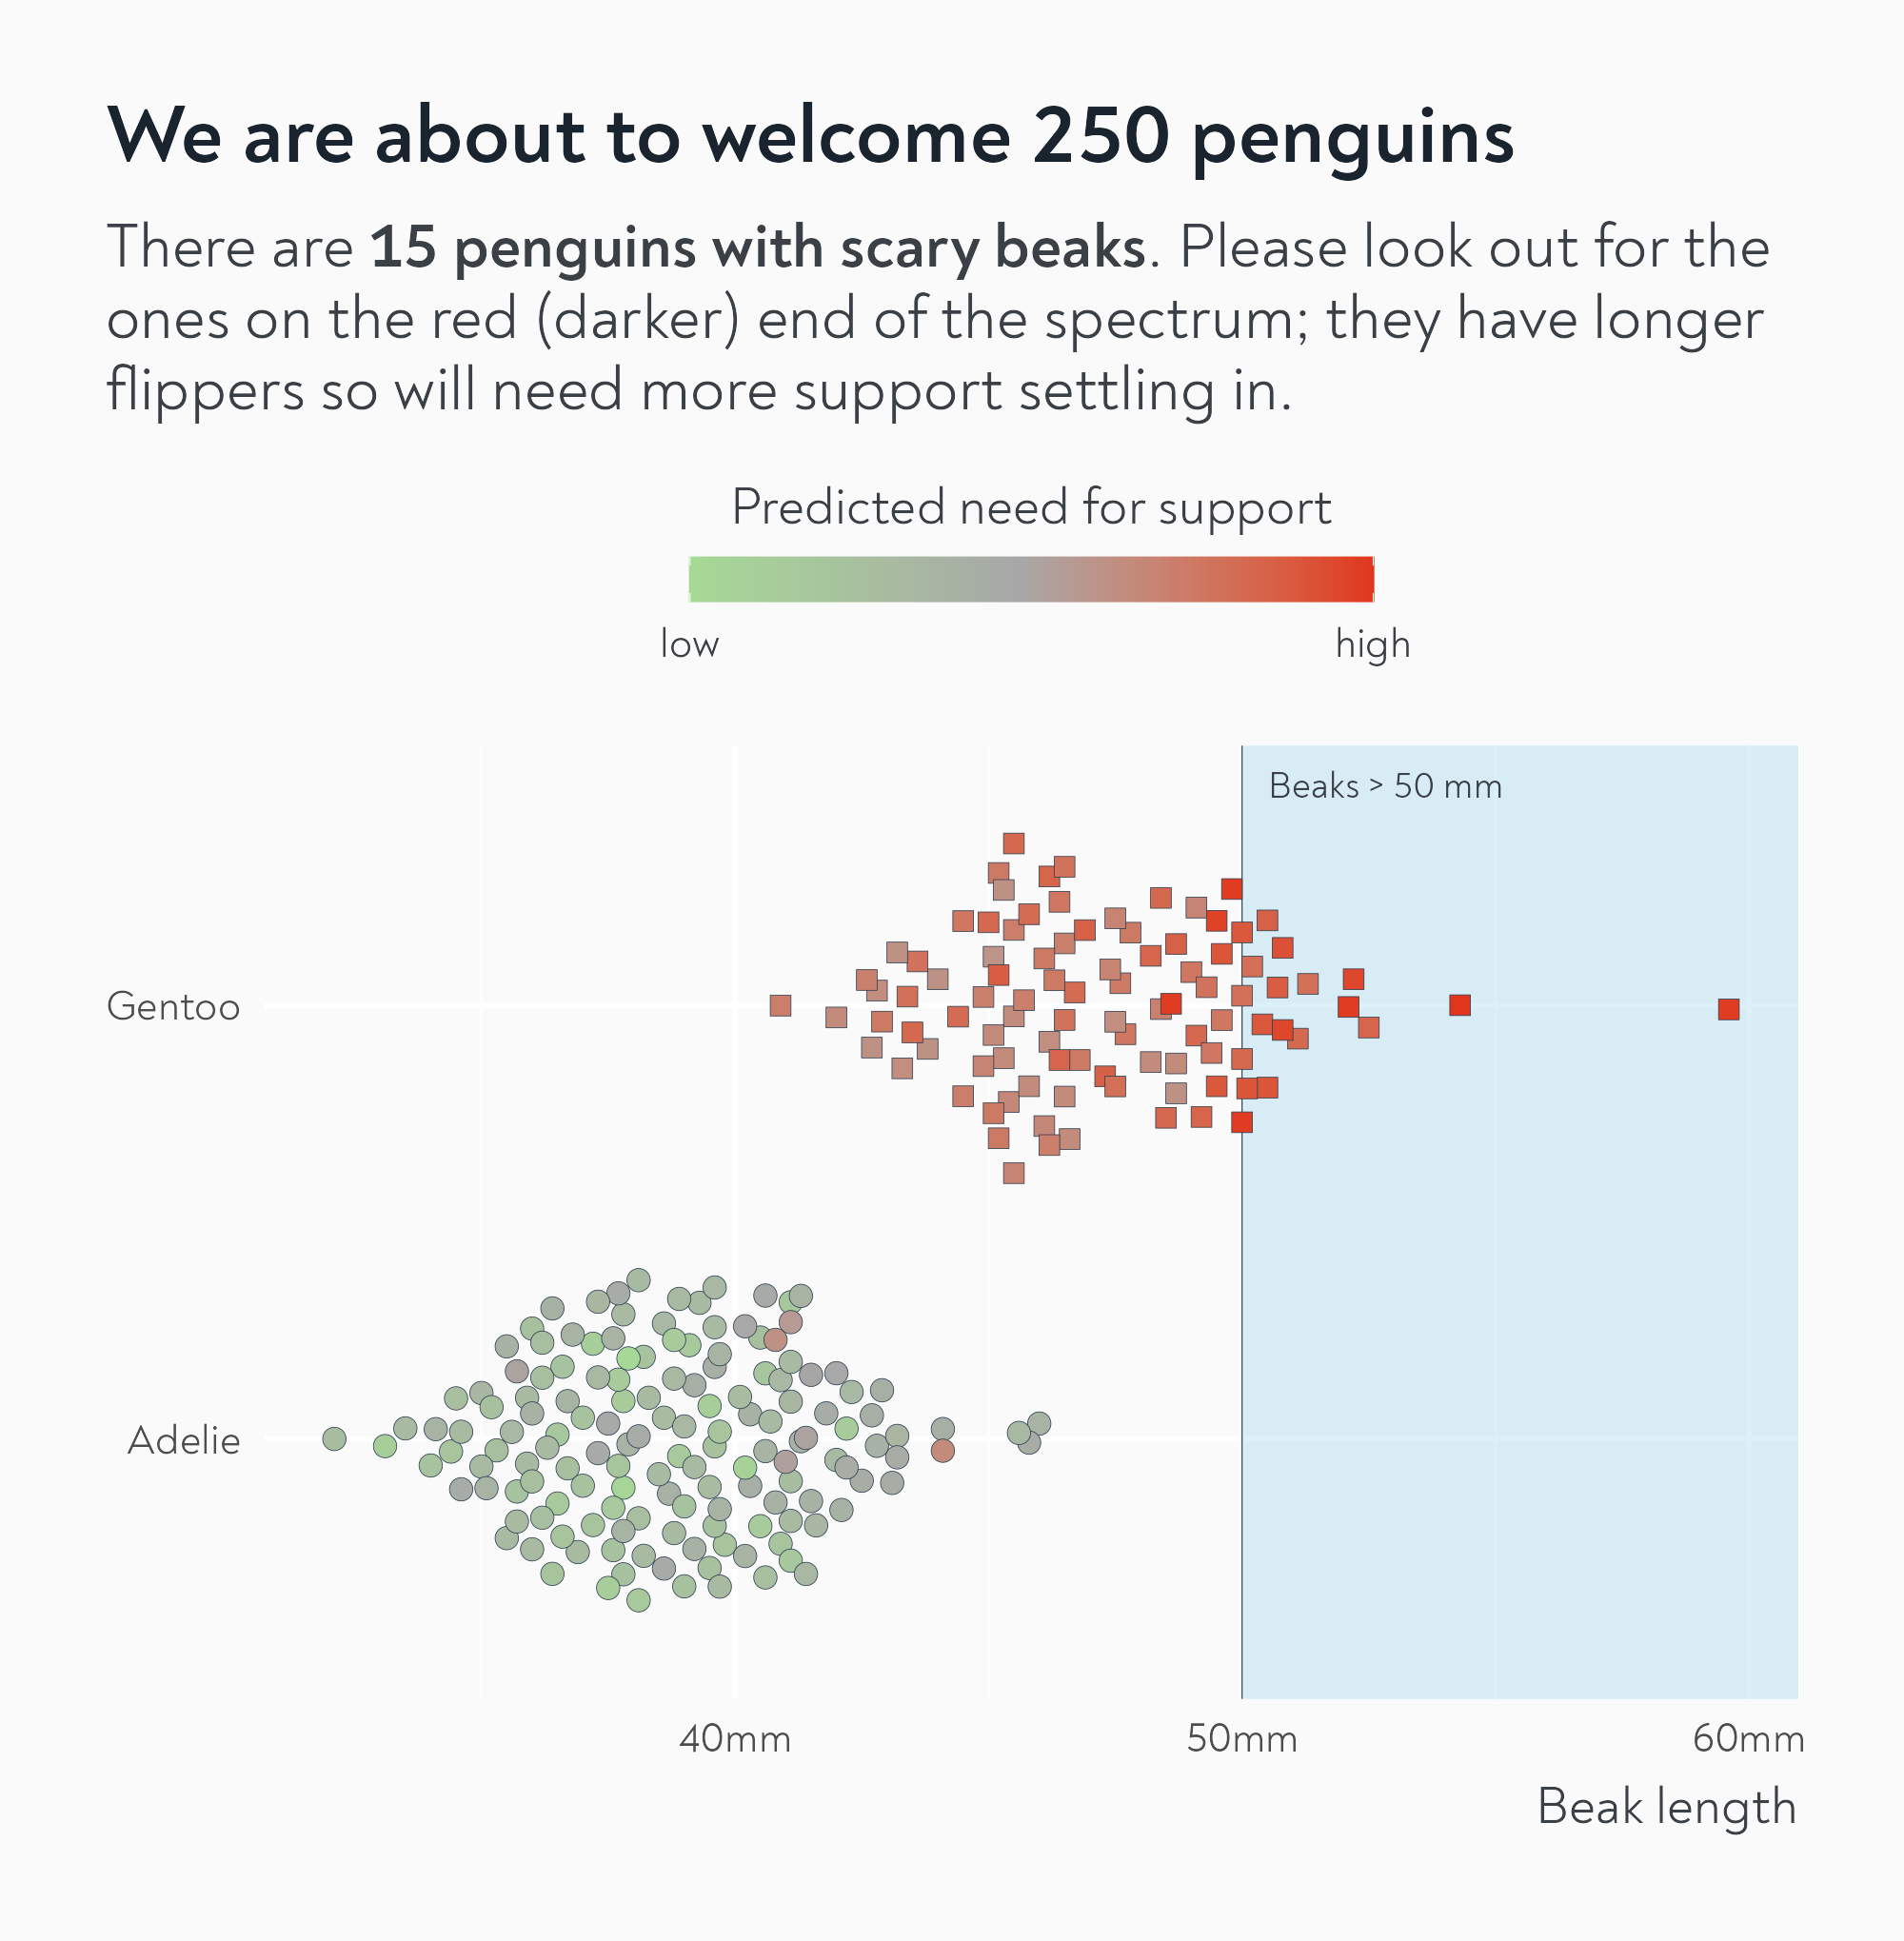
Fix 4: Check your colour contrasts
Better in several ways!
penguins |>
ggplot() +
annotate(
"rect",
xmin = 50,
xmax = Inf,
ymin = -Inf,
ymax = Inf,
fill = alpha("skyblue", 0.3)
) +
geom_vline(xintercept = 50, colour = "#2c3d4f", linewidth = 0.2) +
ggtext::geom_textbox(
data = data.frame(),
aes(x = 50, y = Inf, label = "Beaks > 50 mm"),
fill = NA,
box.colour = NA,
hjust = 0,
vjust = 1,
box.padding = unit(10, "pt"),
family = "Noah",
colour = "#3b4046",
size = 5
) +
ggbeeswarm::geom_quasirandom(
aes(
x = bill_len,
y = species,
shape = species,
colour = flipper_len
),
size = 4
) +
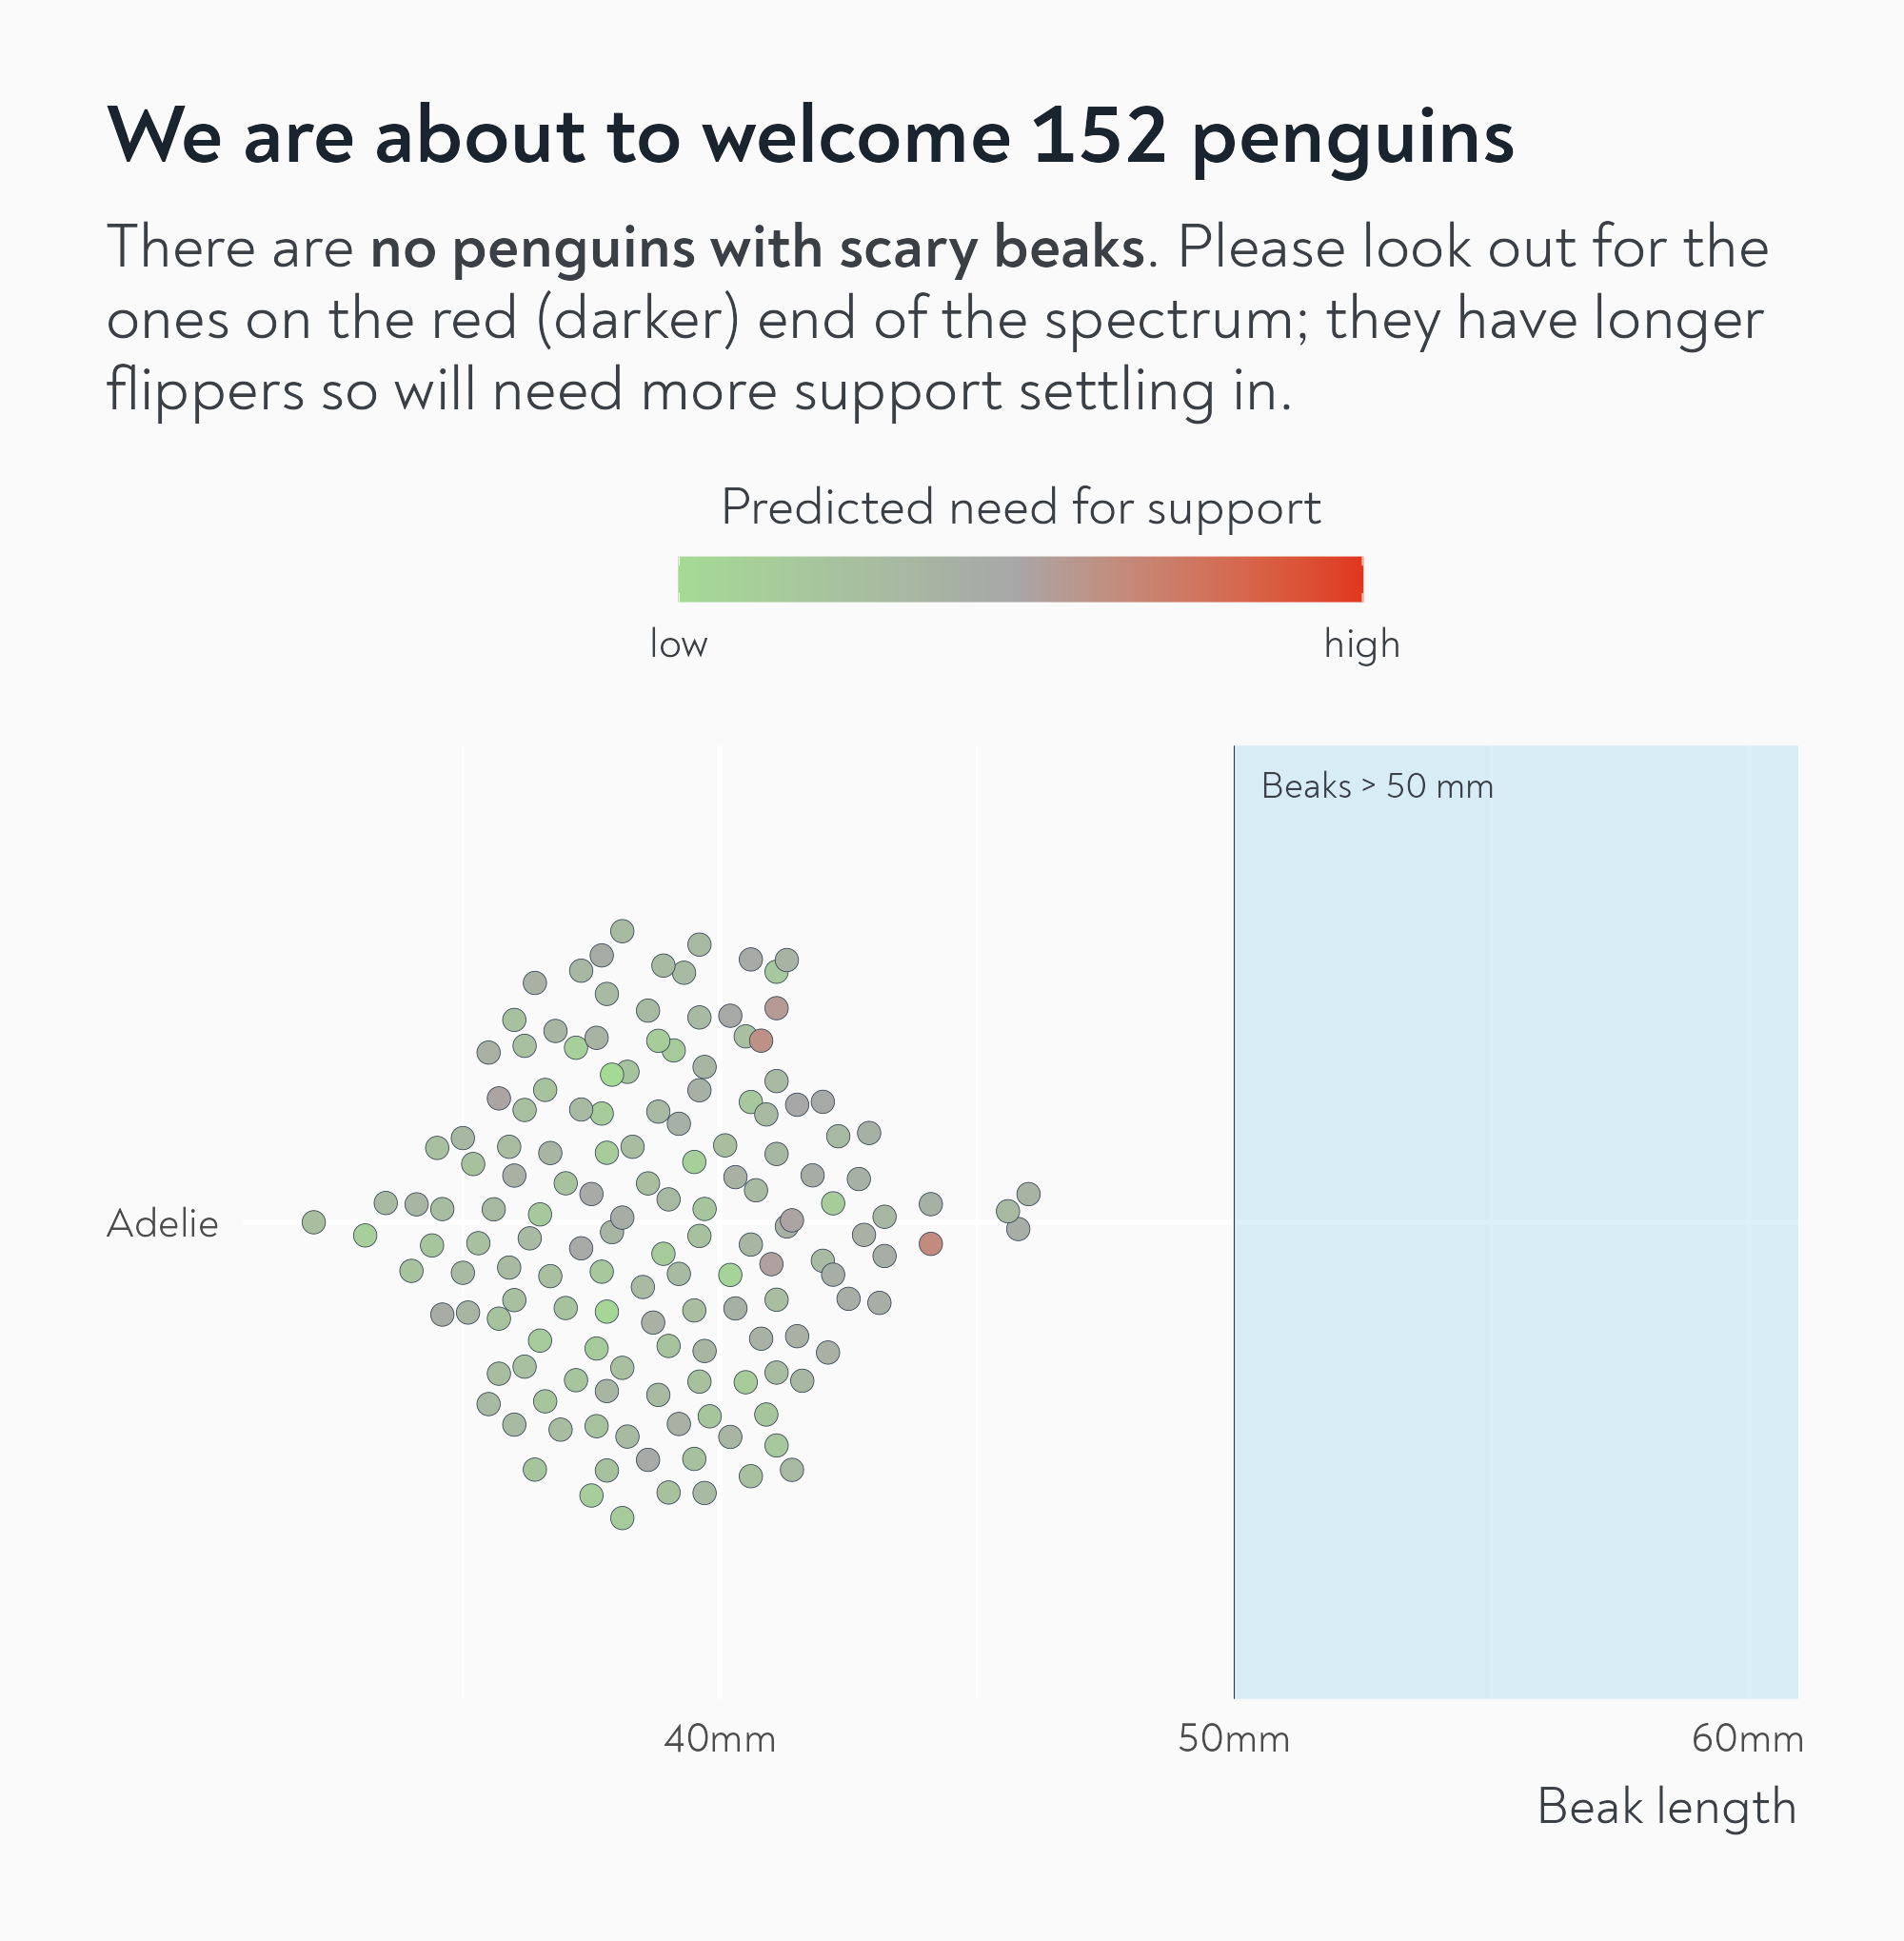
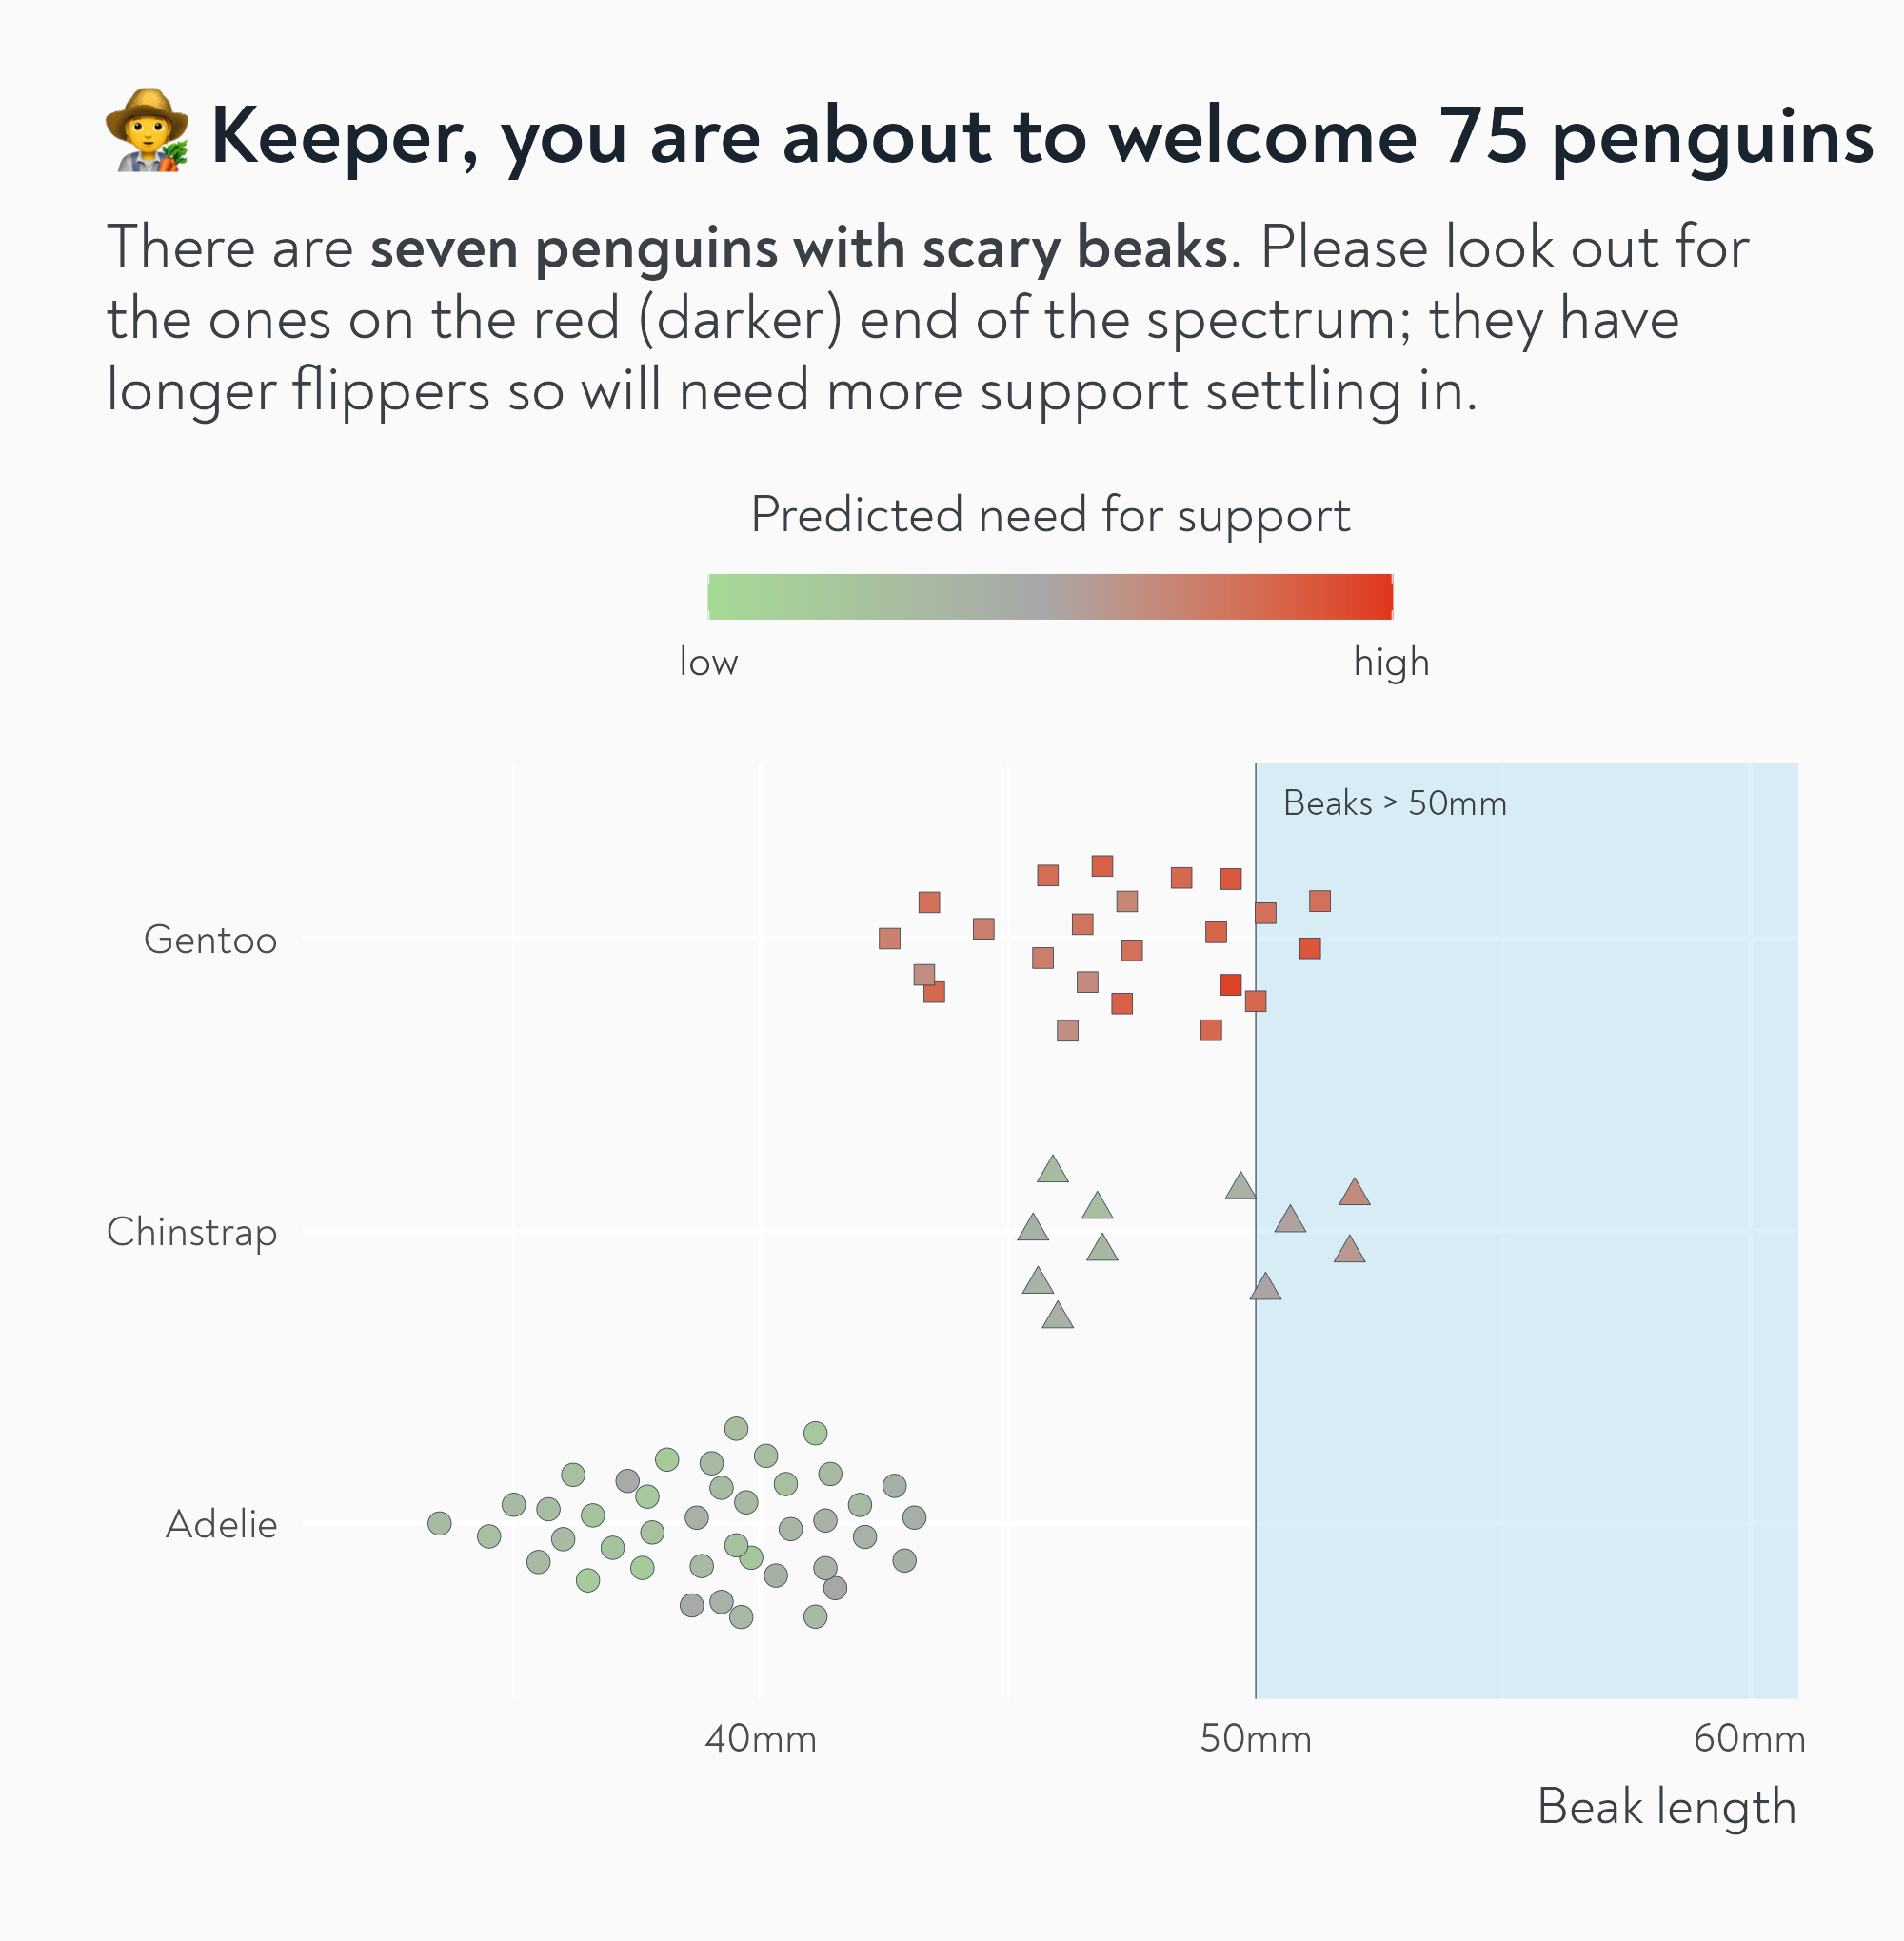
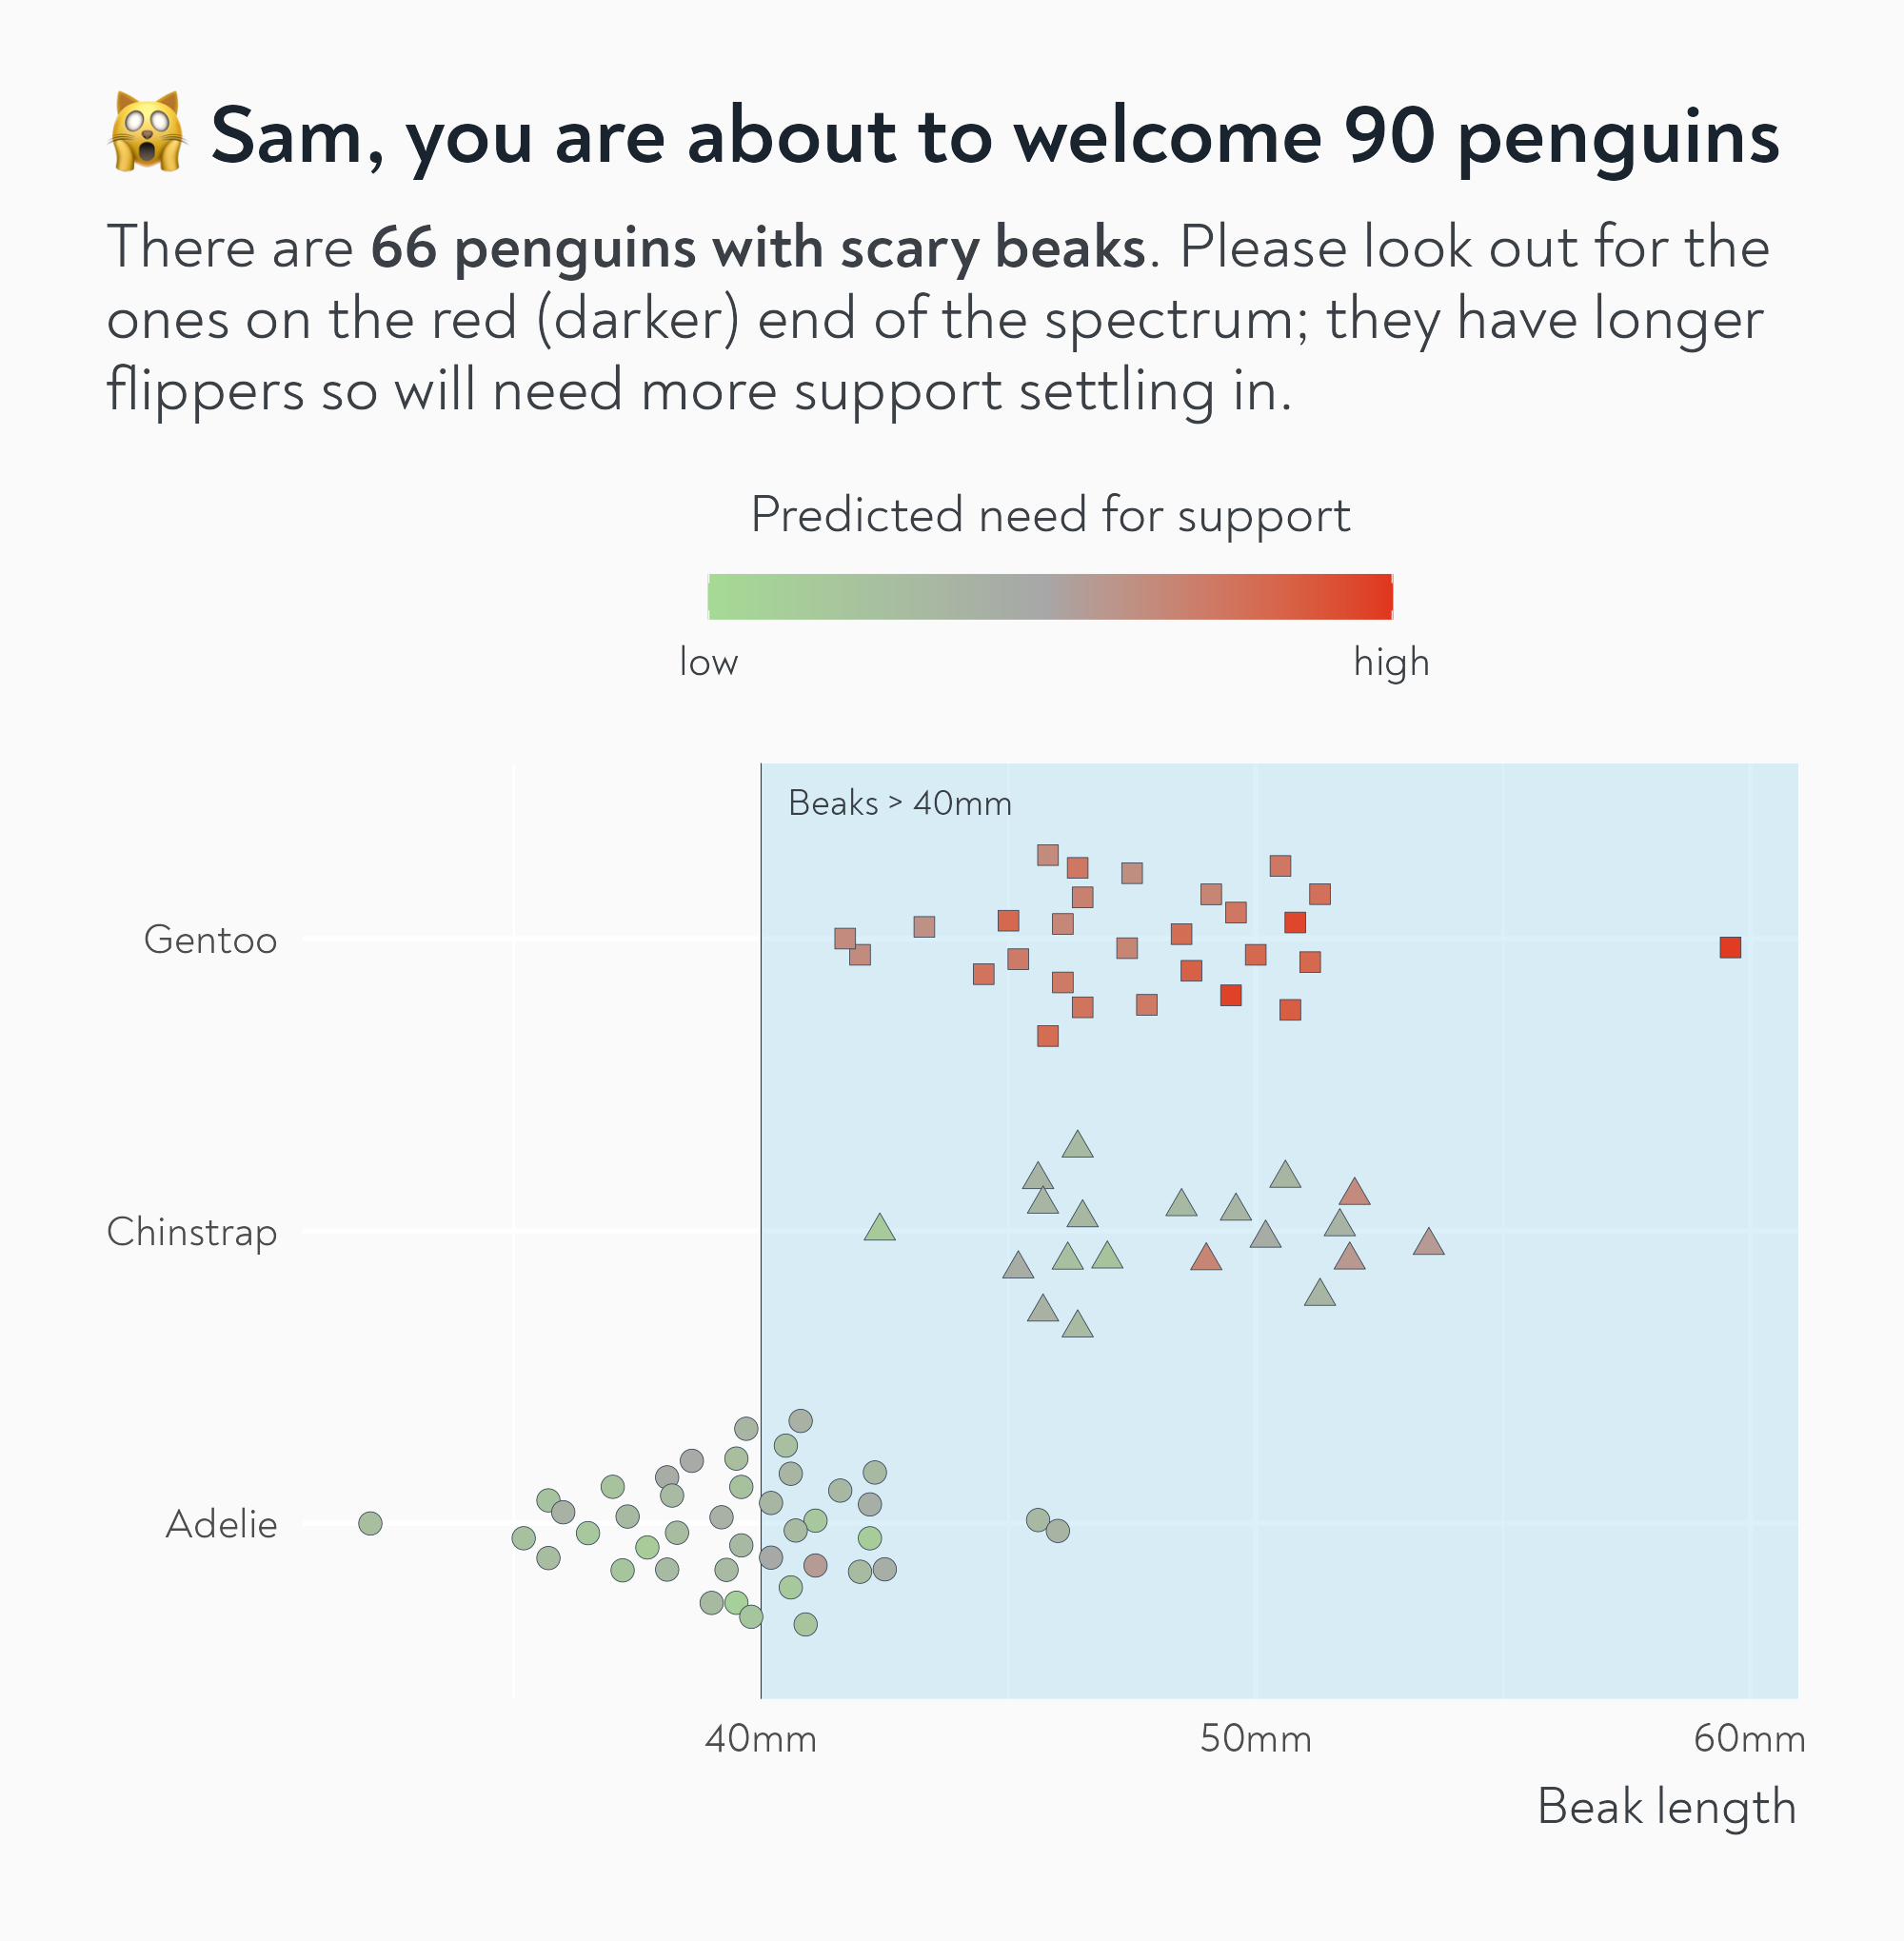
labs(
x = "Beak length",
title = paste0(
"We are about to welcome ",
nrow(penguins),
" penguins"
),
subtitle = paste0(
"There are **",
verbaliseR::pluralise(
sum(penguins$bill_len > 50, na.rm = TRUE),
word = "penguin"
),
" with scary beaks**. Please look out for the ones on the red (darker) end of the spectrum; they have longer flippers so will need more support settling in."
),
colour = "Predicted need for support"
) +
scale_x_continuous(label = function(x) paste0(x, "mm")) +
scale_shape(guide = "none") +
scale_colour_gradient2(
low = "#a5dc94",
mid = "#a7a7a7",
high = "#e0361d",
midpoint = mean(penguins$flipper_len, na.rm = TRUE),
limits = c(
min(penguins$flipper_len, na.rm = TRUE),
max(penguins$flipper_len, na.rm = TRUE)
),
breaks = c(
min(penguins$flipper_len, na.rm = TRUE),
max(penguins$flipper_len, na.rm = TRUE)
),
labels = c("low", "high")
) +
theme(
text = element_text(family = "Noah", colour = "#3b4046"),
plot.subtitle = marquee::element_marquee(
width = 1,
family = "Noah",
size = rel(1.2)
),
plot.title = element_text(
face = "bold",
size = rel(1.6),
colour = "#1A242F"
),
legend.title = element_text(hjust = 0.5),
axis.title.y = element_blank(),
panel.grid = element_line(colour = "white"),
plot.background = element_rect(fill = "#fafafa", colour = "#fafafa"),
plot.margin = margin_auto(40),
axis.title.x = element_text(hjust = 1, margin = margin(10, 0, 0, 0)),
legend.position = "top",
plot.title.position = "plot",
legend.title.position = "top",
legend.justification = 0.5,
legend.key.width = unit(3.6, "lines")
)
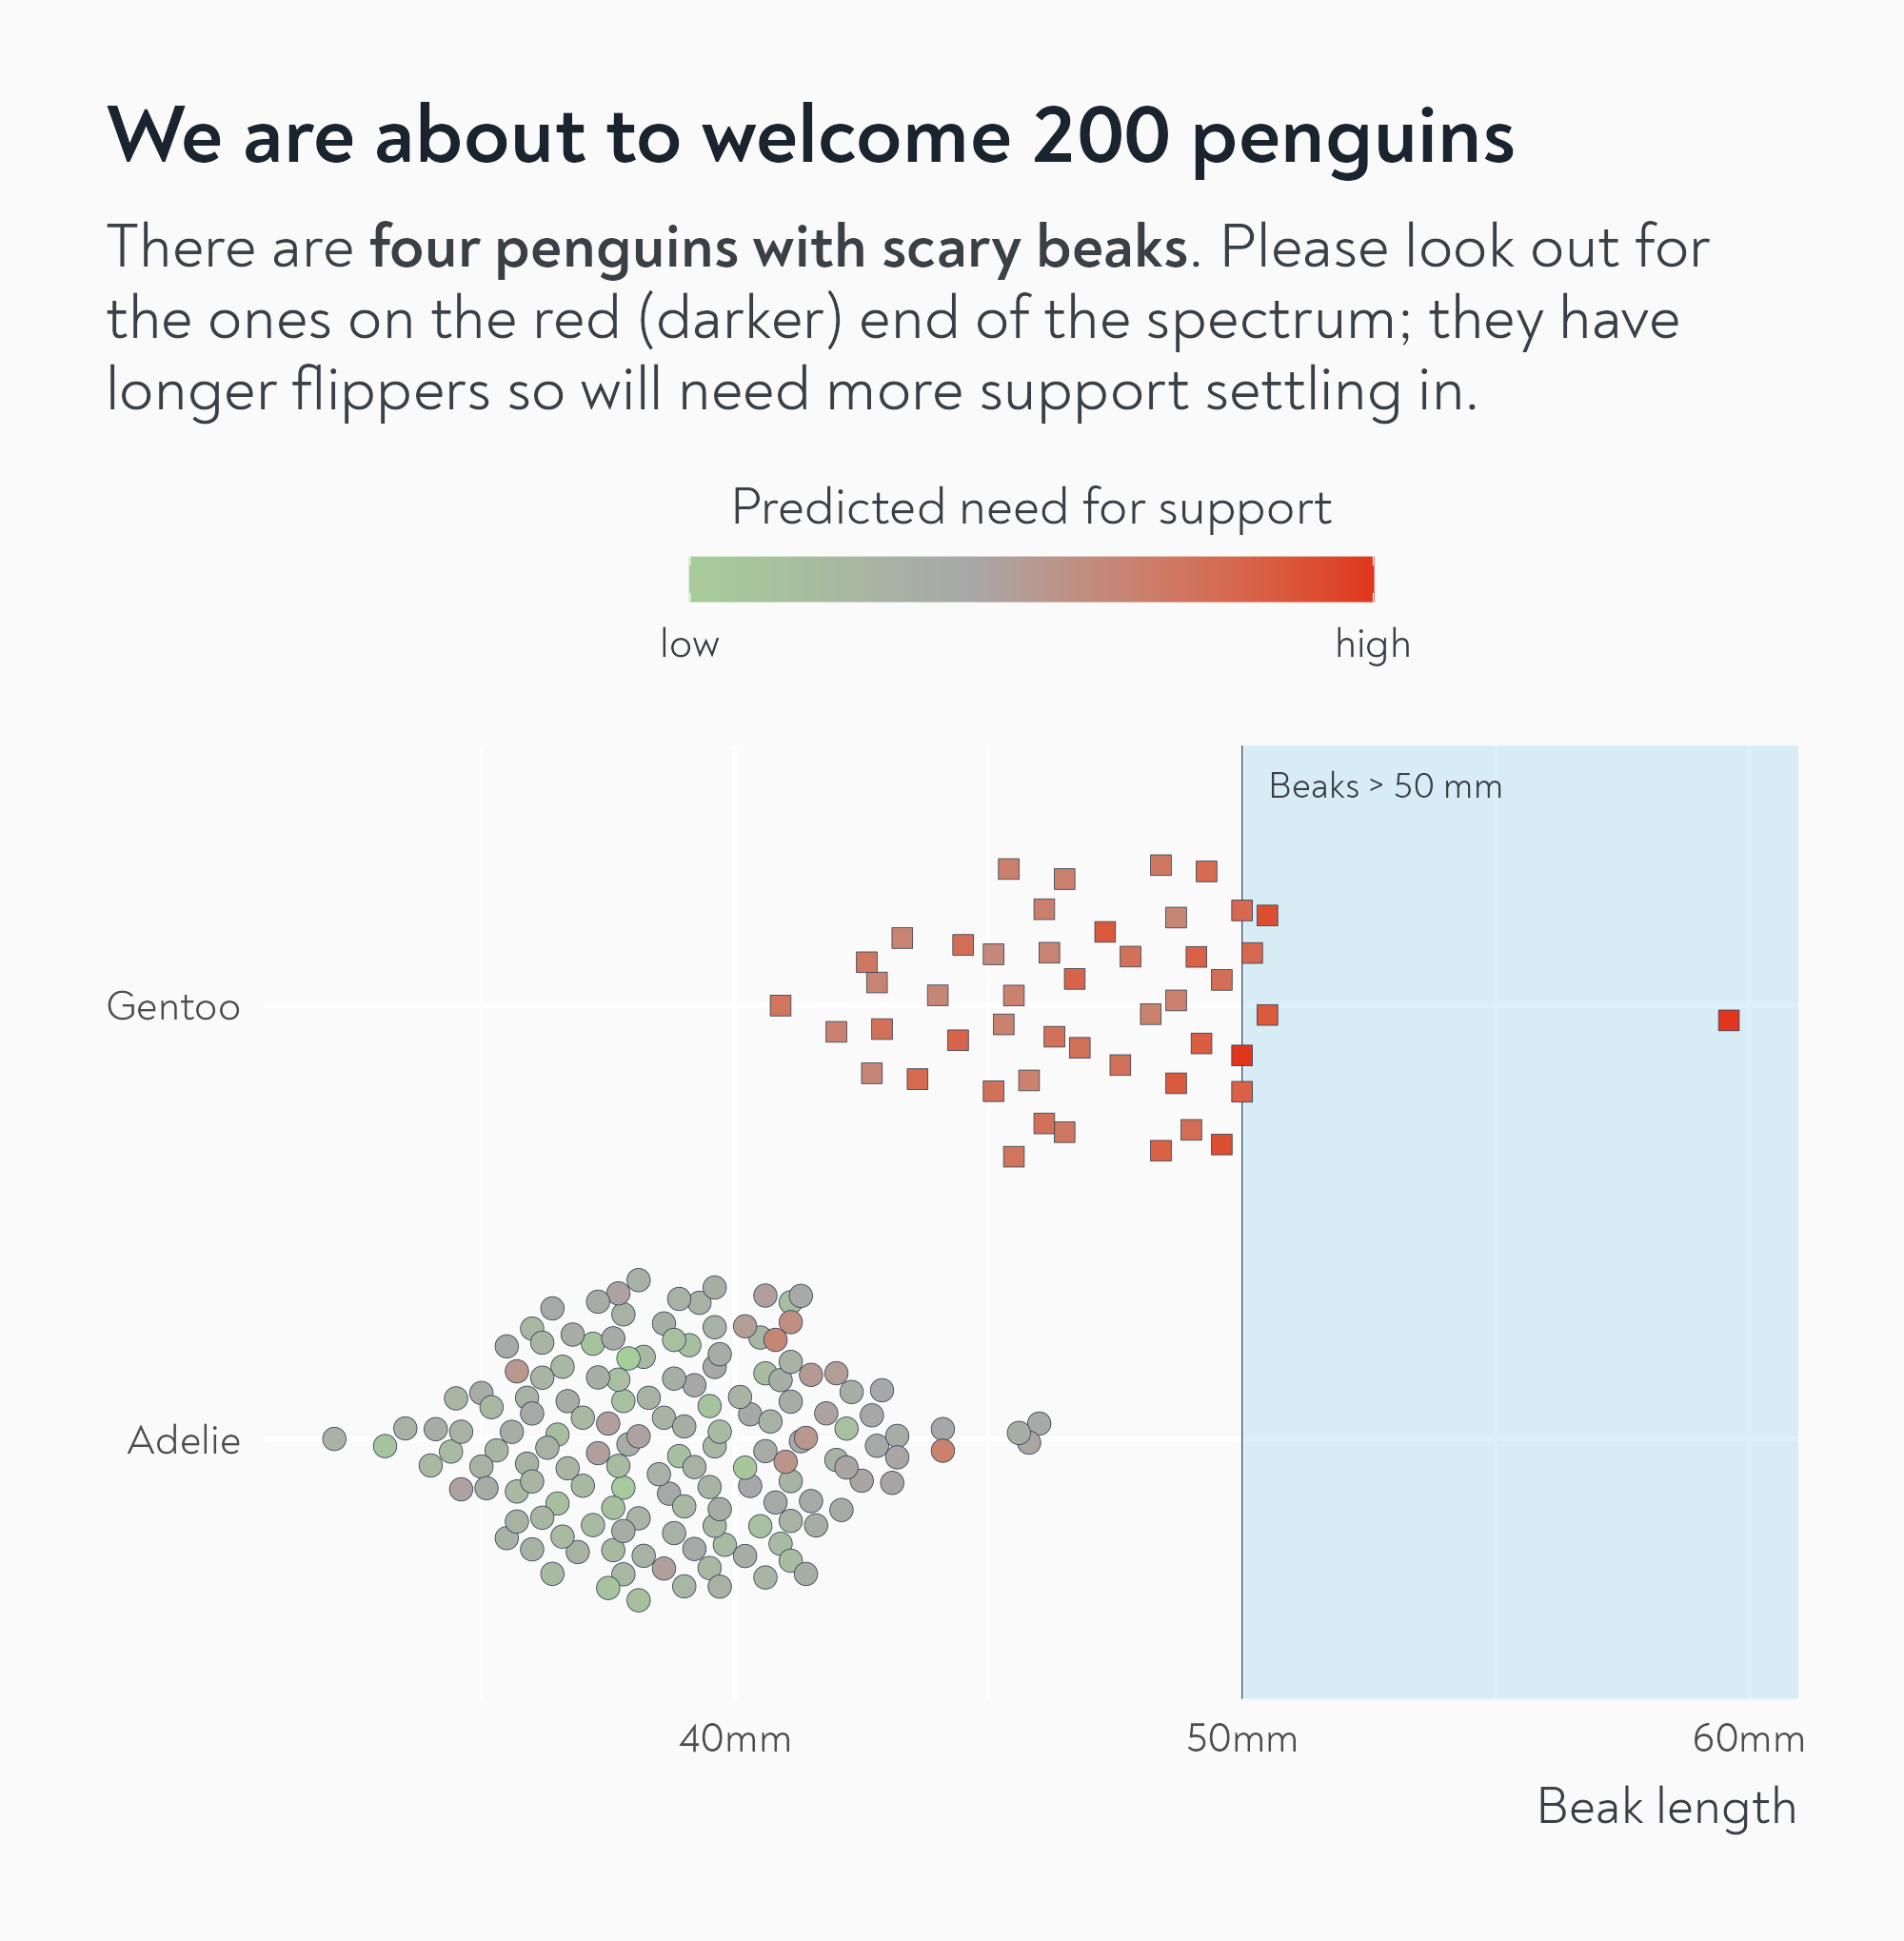
Now we can turn it into a parameterised function!
Fix 5: Named vectors

Fix 5: Named vectors

Fix 5: Named vectors
Fix 6: Specify your limits
Fix 6: Specify your limits

Fix 7: Parameterise the threshold

Fix 7: Parameterise the threshold

Fix 8: Parameterise the text
Fix 8: Parameterise the text
Fix 9: Know thyself
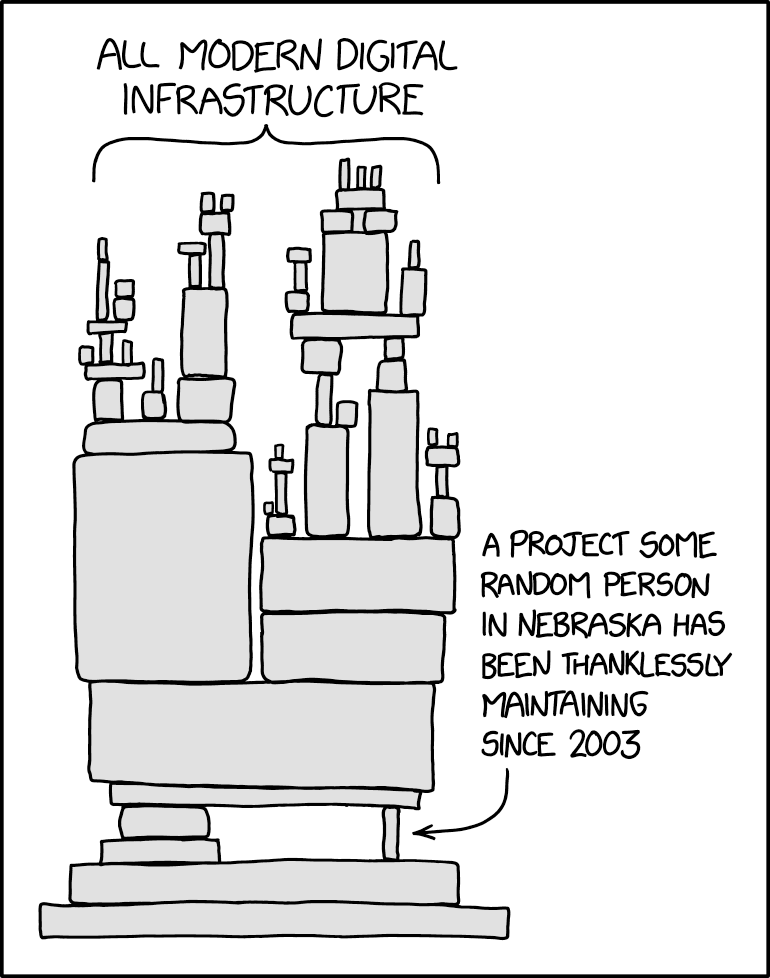
🤯 Visualising the risks in the visualisation tools you’re using
to visualise risk
Fix 10: Set up dataviz tests
Spot the (unanticipated) difference.