Variations on a ggplot theme
Cara Thompson | NHS-R 2022 Conference | 16th November 2022
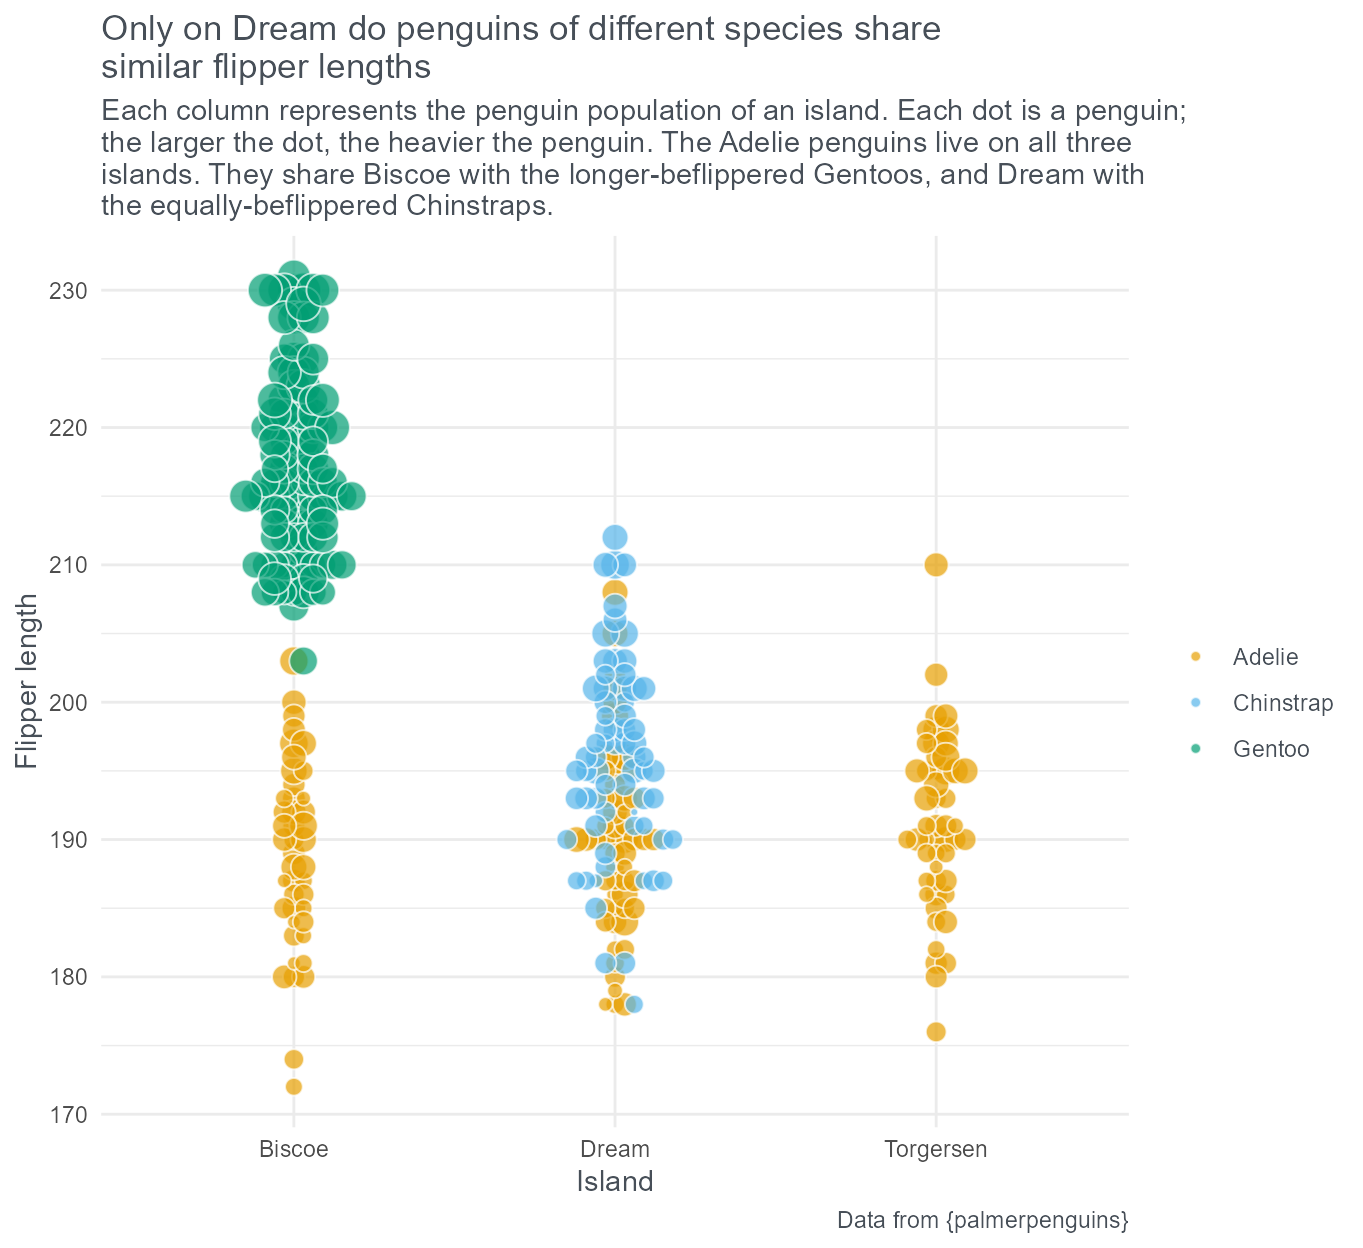
#1 - Add text hierarchy
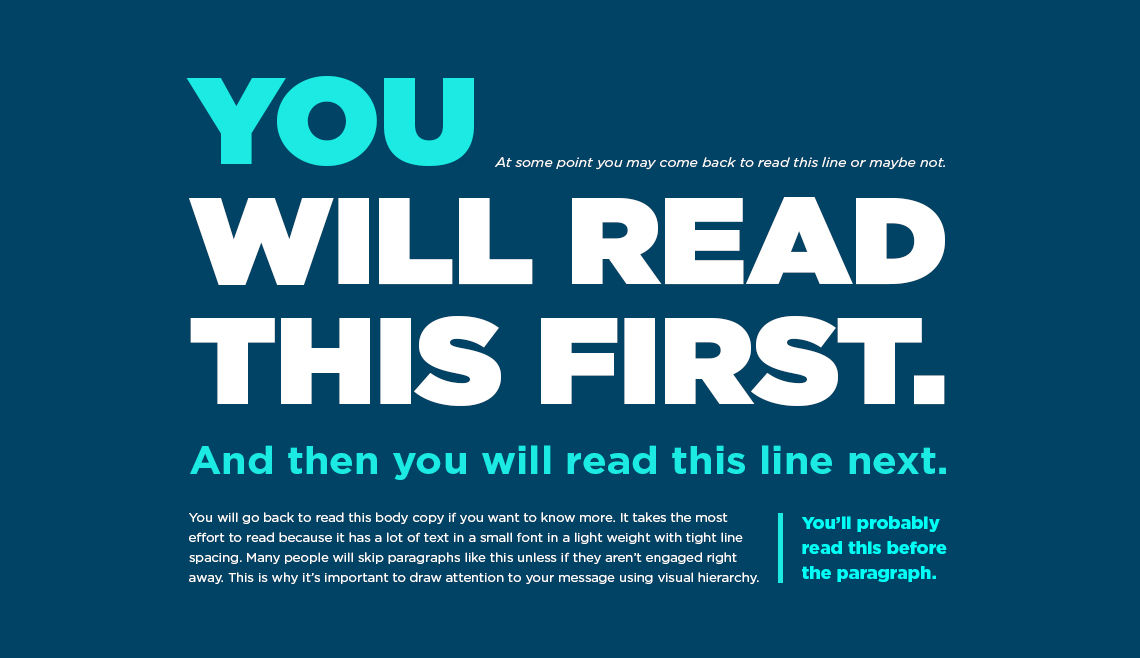
#1 - Add text hierarchy
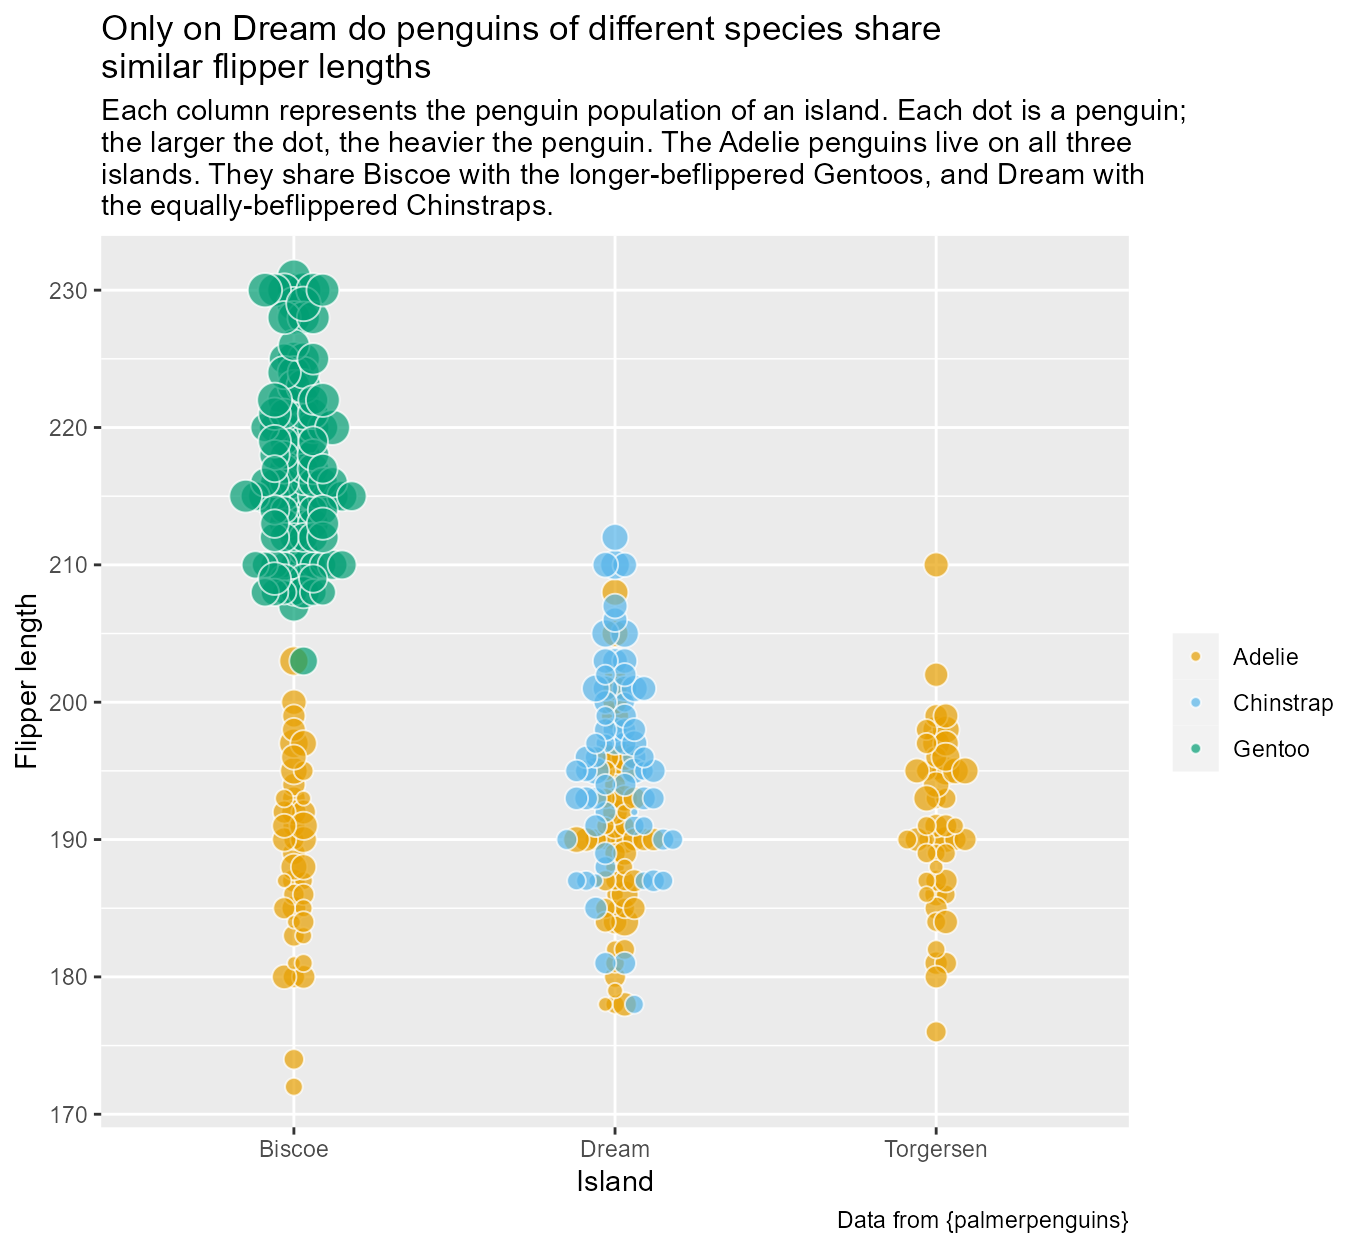
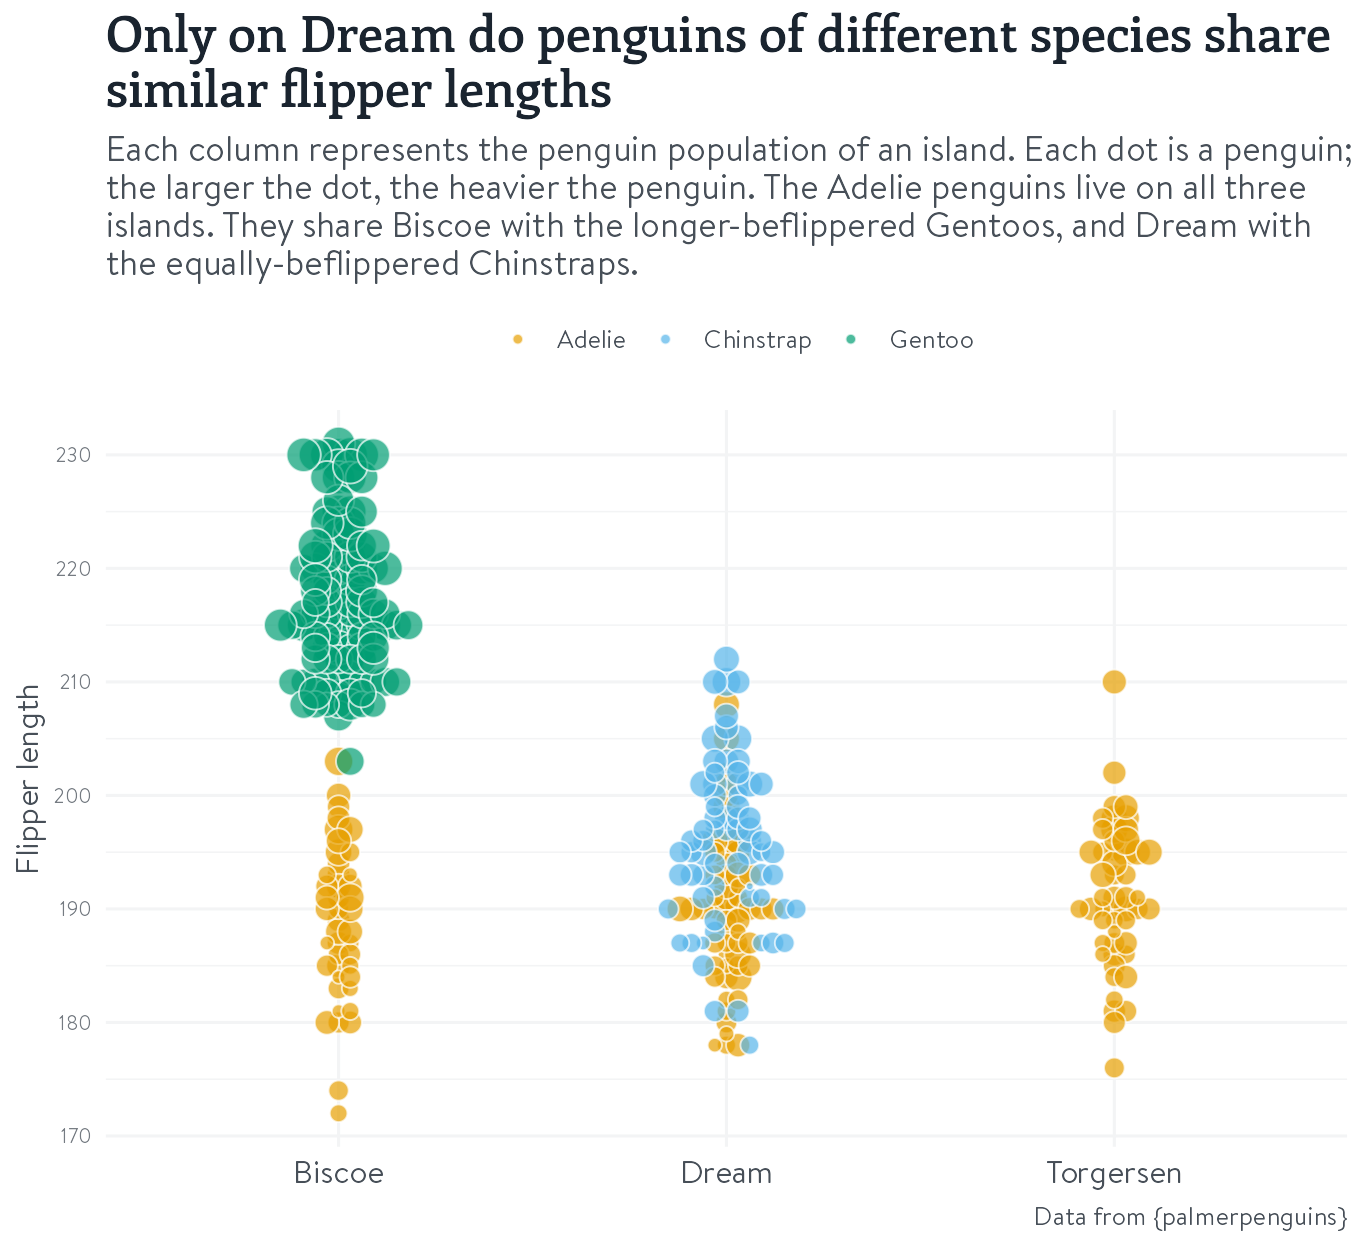
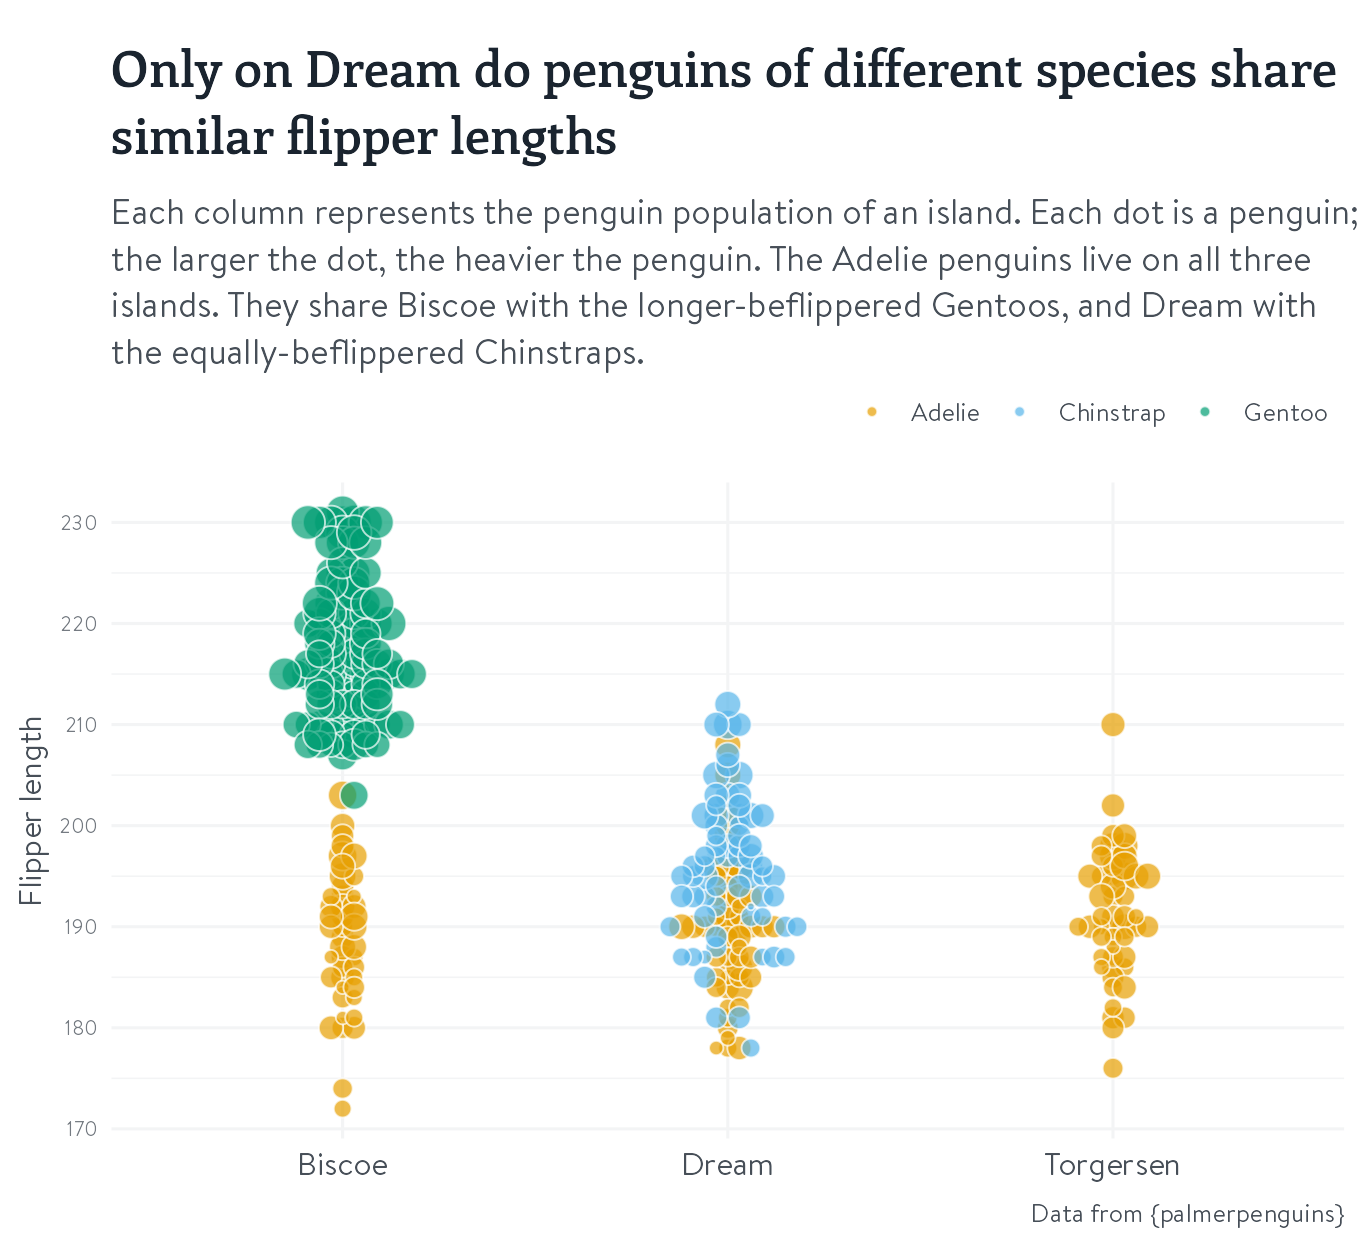
📦 = {ggbeeswarm} + {palmerpenguins} + 🎨{colorblindr}
#1 - Add text hierarchy
A first easy tweak: theme_minimal()

#1 - Add text hierarchy
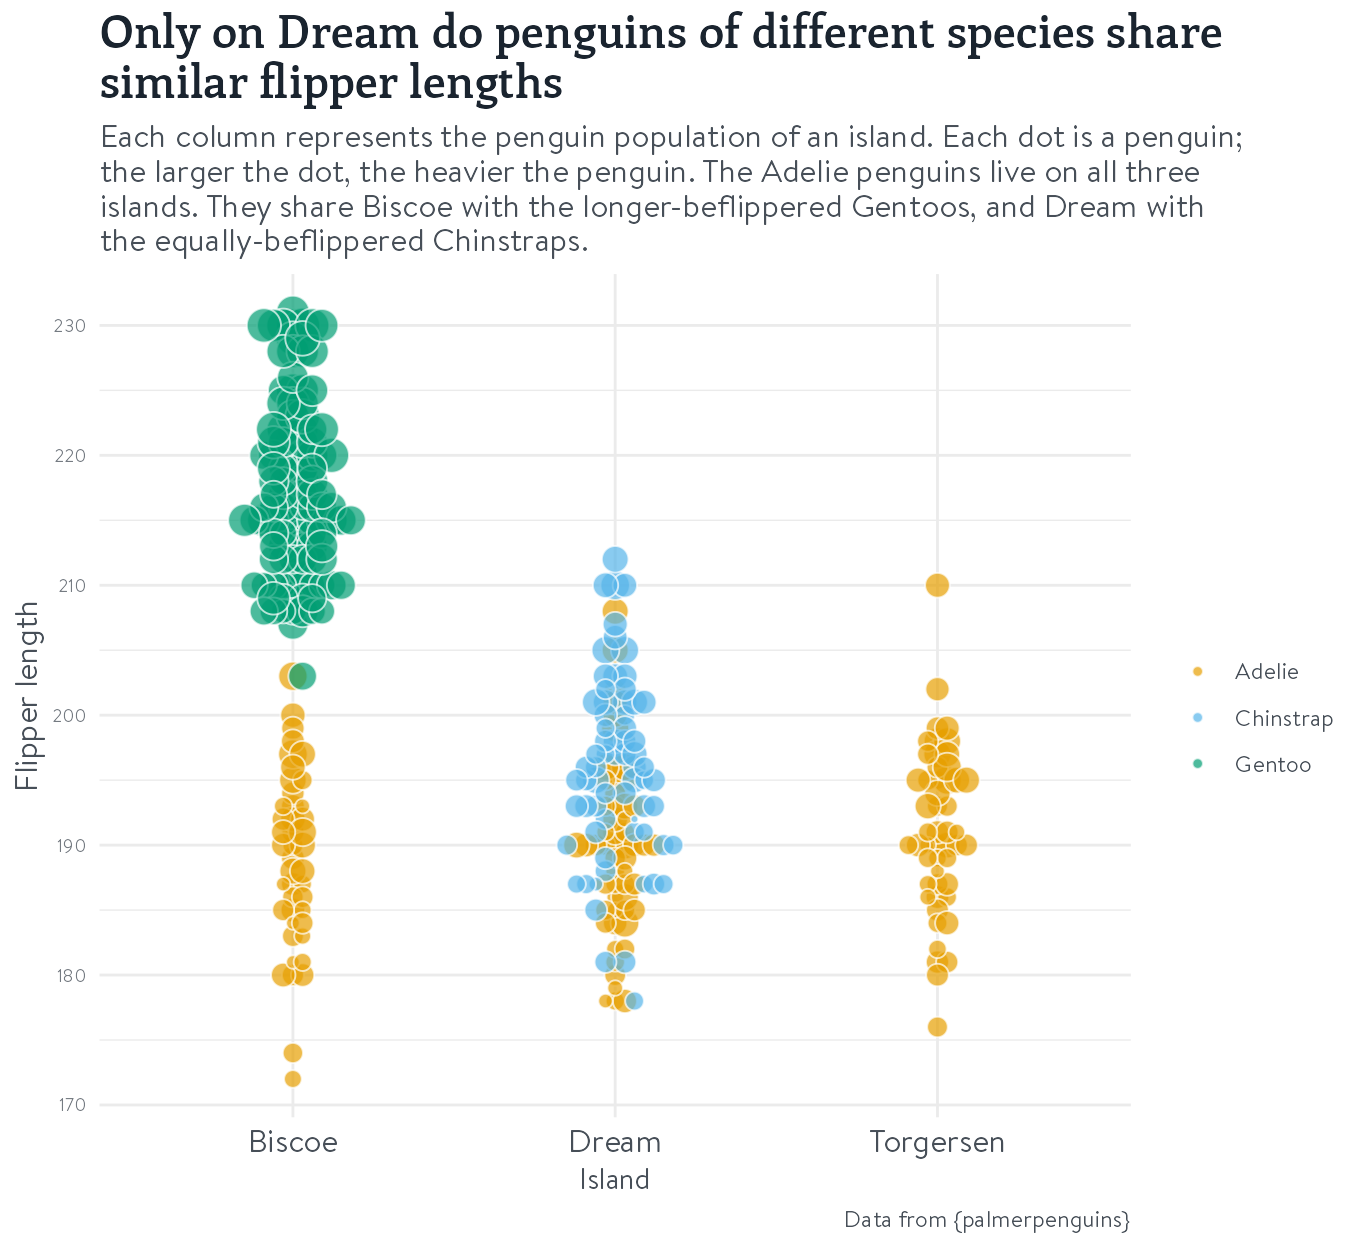
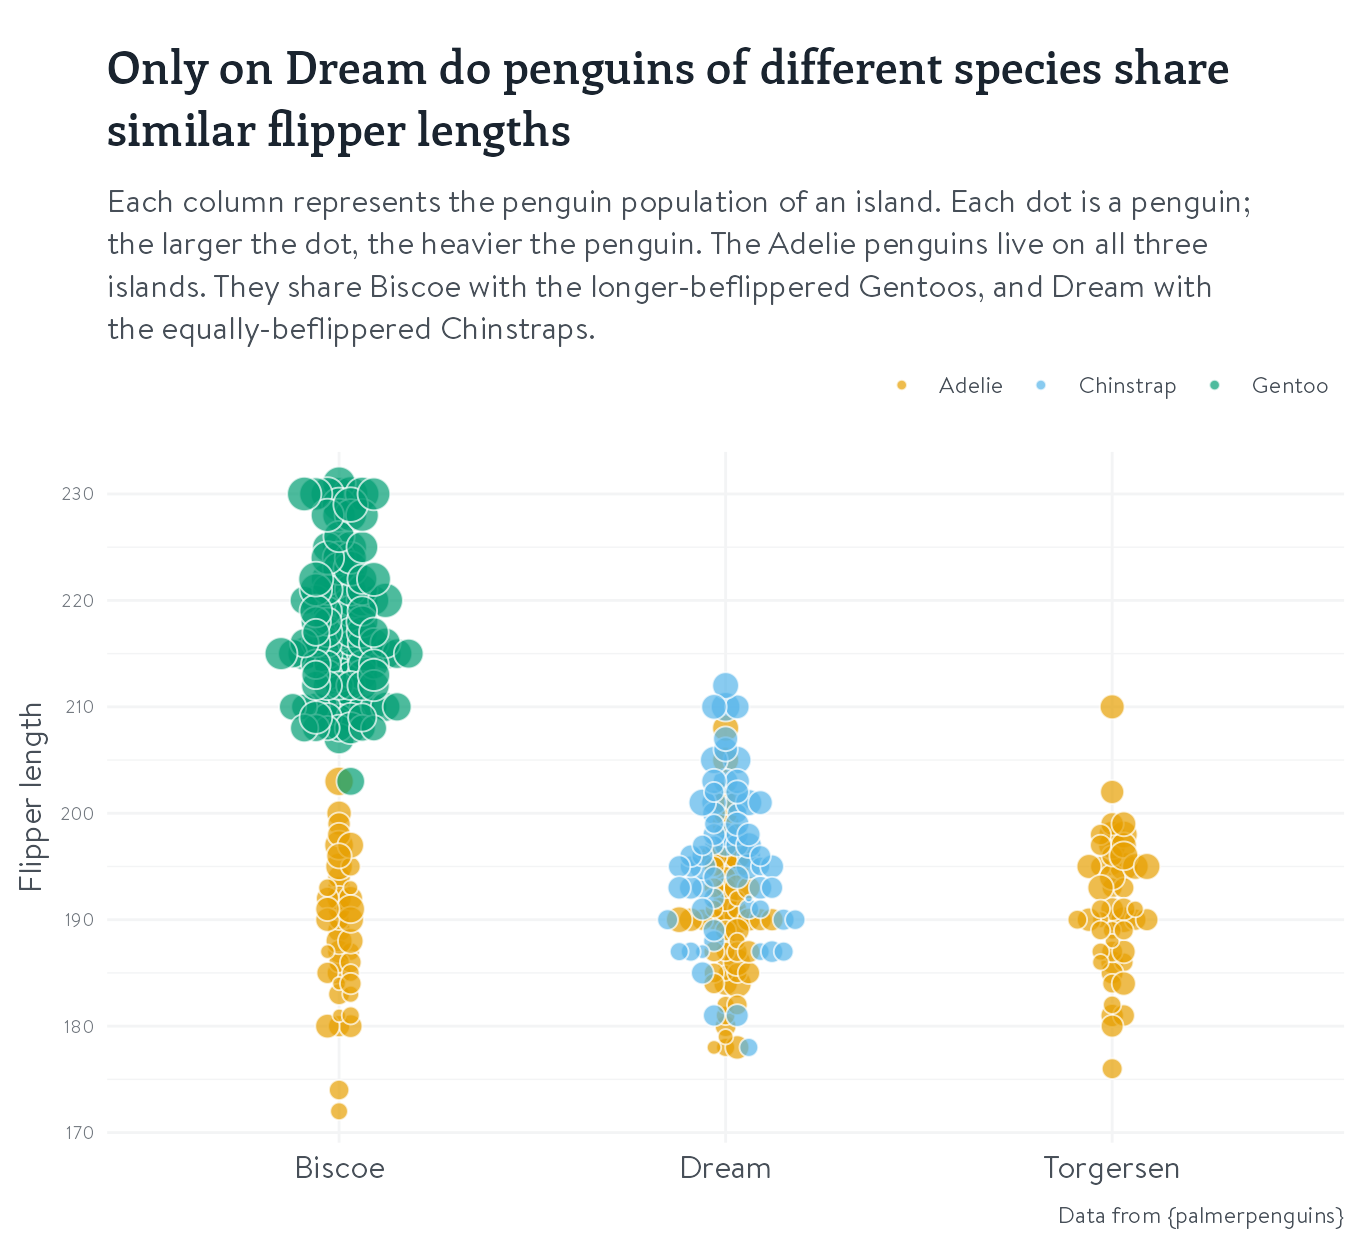
Create and apply different text colours

#1 - Add text hierarchy
Create and apply different text colours
#1 - Add text hierarchy
Create and apply different text colours
#1 - Add text hierarchy
Create and apply different text colours

#1 - Add text hierarchy
Create and apply different text colours

#1 - Add text hierarchy
Add your own fonts

#1 - Add text hierarchy
Change the text sizes (relative or absolute)
basic_plot +
theme_minimal() +
theme(
text = element_text(colour = mid_text,
family = "BrandonText"),
plot.title = element_text(colour = dark_text,
family = "EnriquetaSB",
size = rel(1.6)),
plot.subtitle = element_text(size = rel(1.1)),
axis.text.y = element_text(colour = light_text,
size = rel(0.8)),
axis.title.y = element_text(size = 12),
axis.text.x = element_text(colour = mid_text,
size = 12),
plot.caption = element_text(size = rel(0.8))
)
#1 - Add text hierarchy


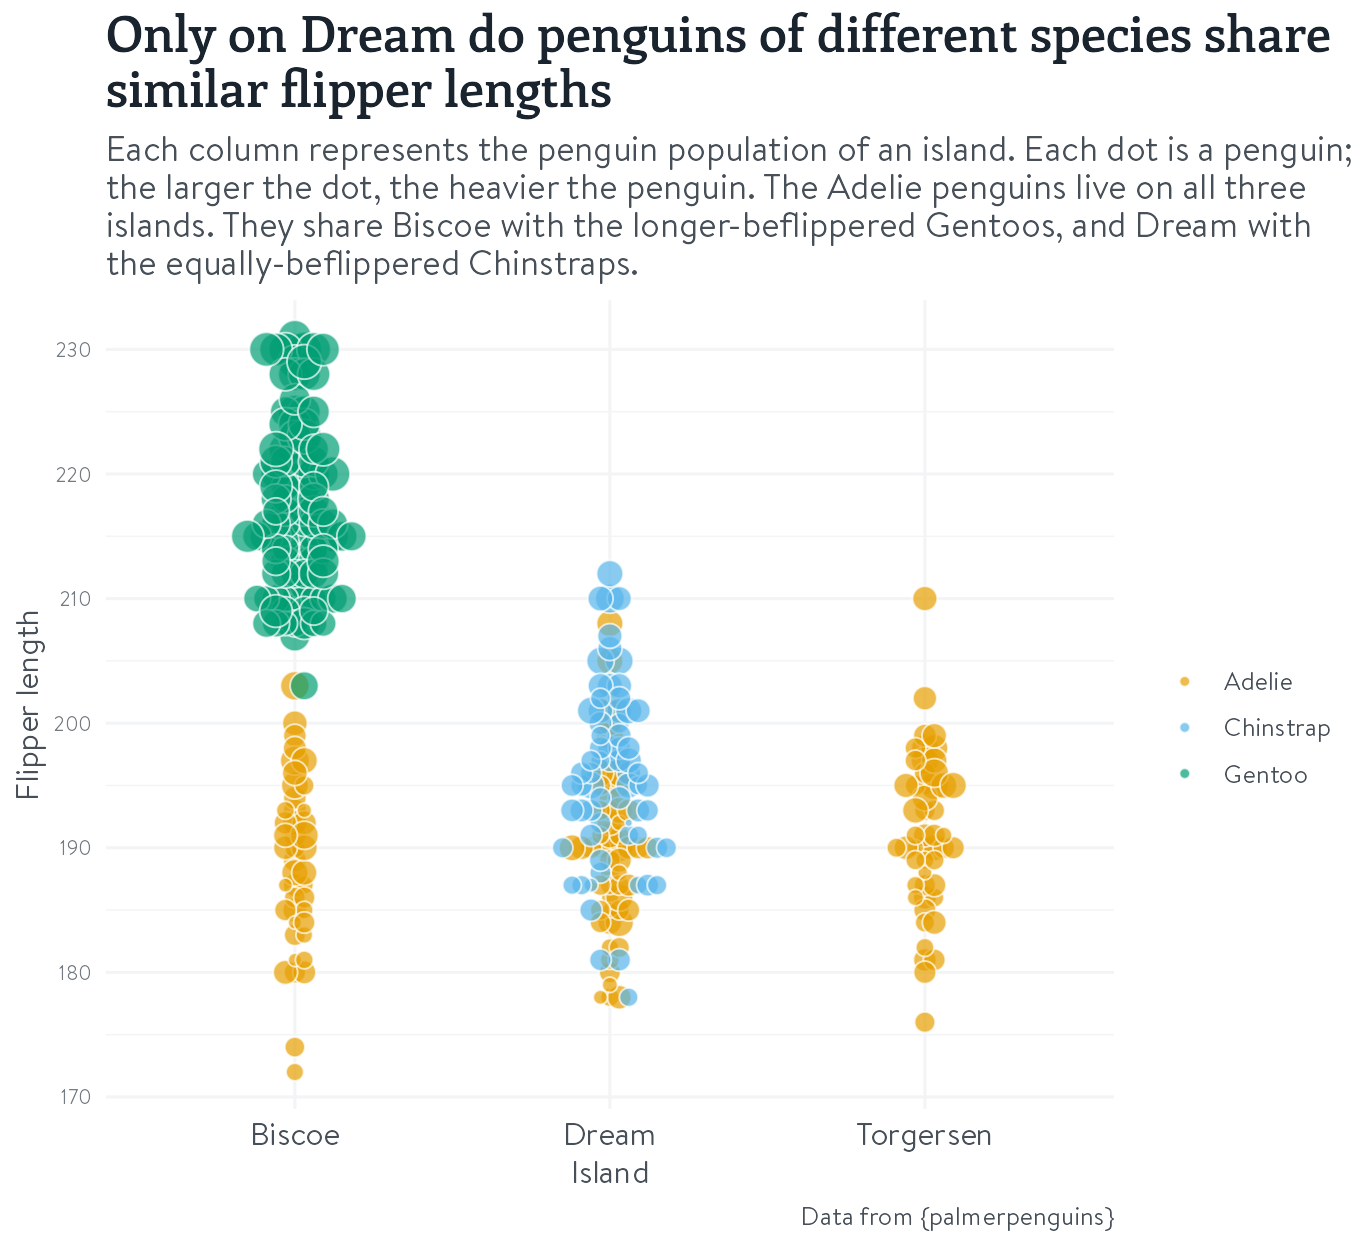
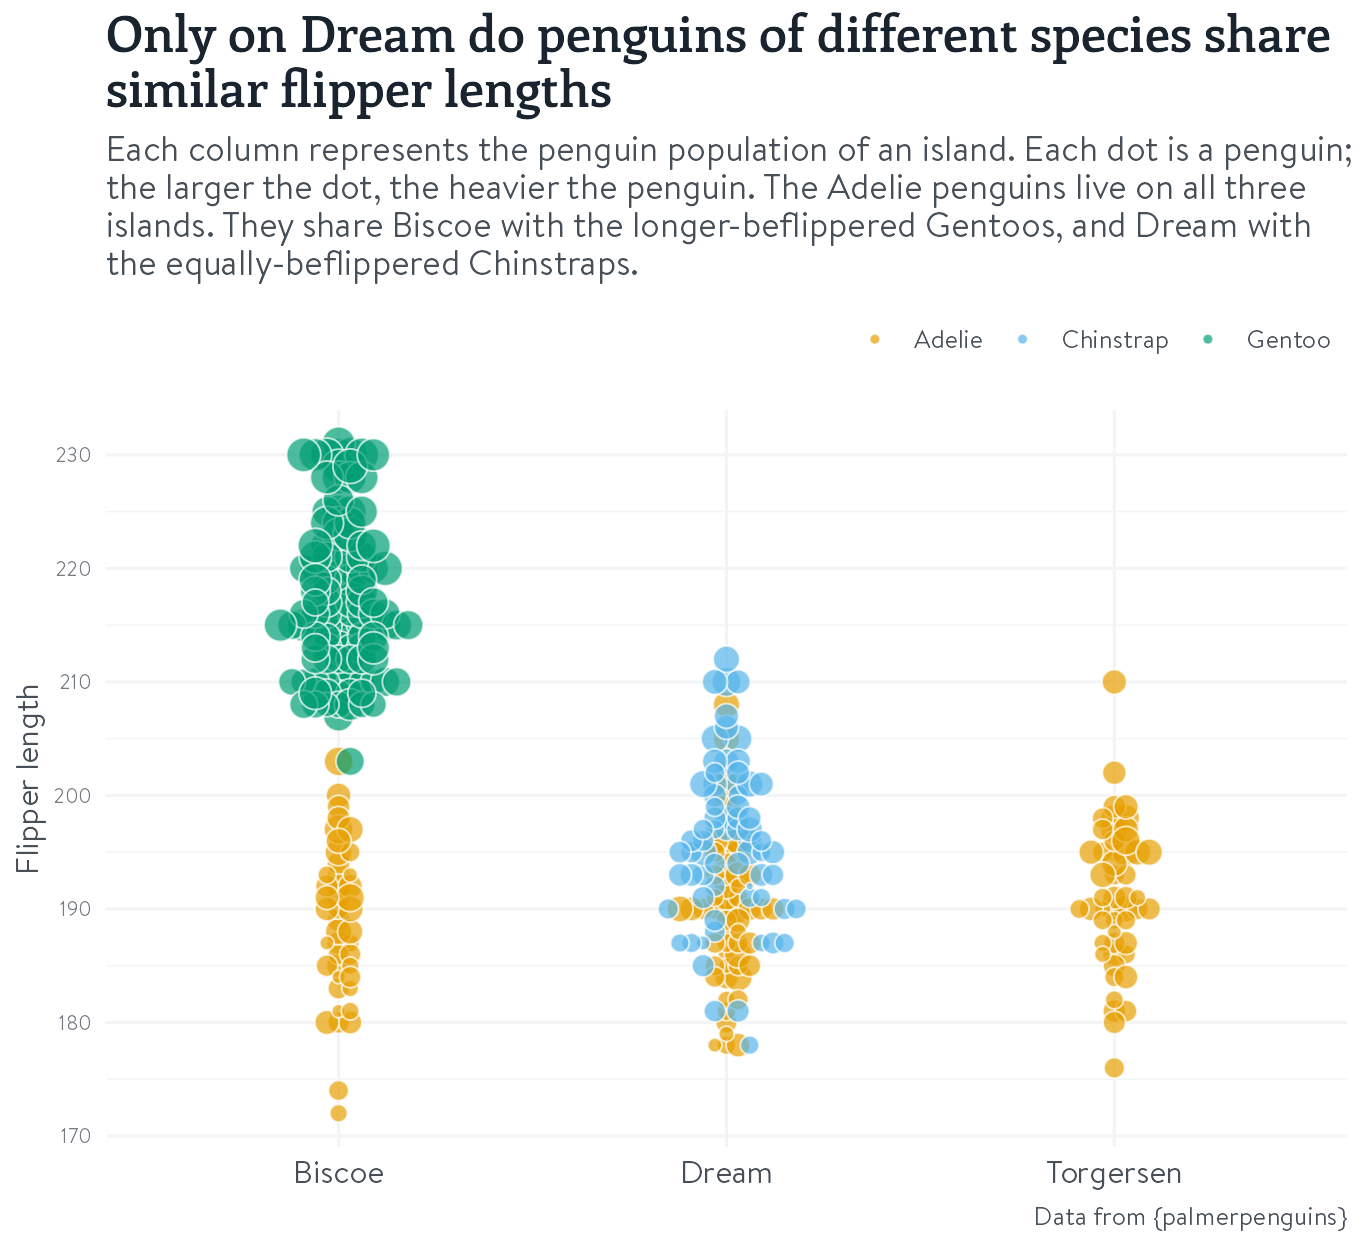
#2 - Give everything some space to breathe
basic_plot +
  theme_minimal(base_size = 12) +
  theme(
    text = element_text(colour = mid_text,
                        family = "BrandonText"),
    plot.title = element_text(colour = dark_text,
                              family = "EnriquetaSB",
                              size = rel(1.6)),
    plot.subtitle = element_text(size = rel(1.1)),
    axis.text.y = element_text(colour = light_text,
                               size = rel(0.8)),
    axis.title.y = element_text(size = 12),
    axis.text.x = element_text(colour = mid_text,
                               size = 12),
    plot.caption = element_text(size = rel(0.8))
  )
#2 - Give everything some space to breathe
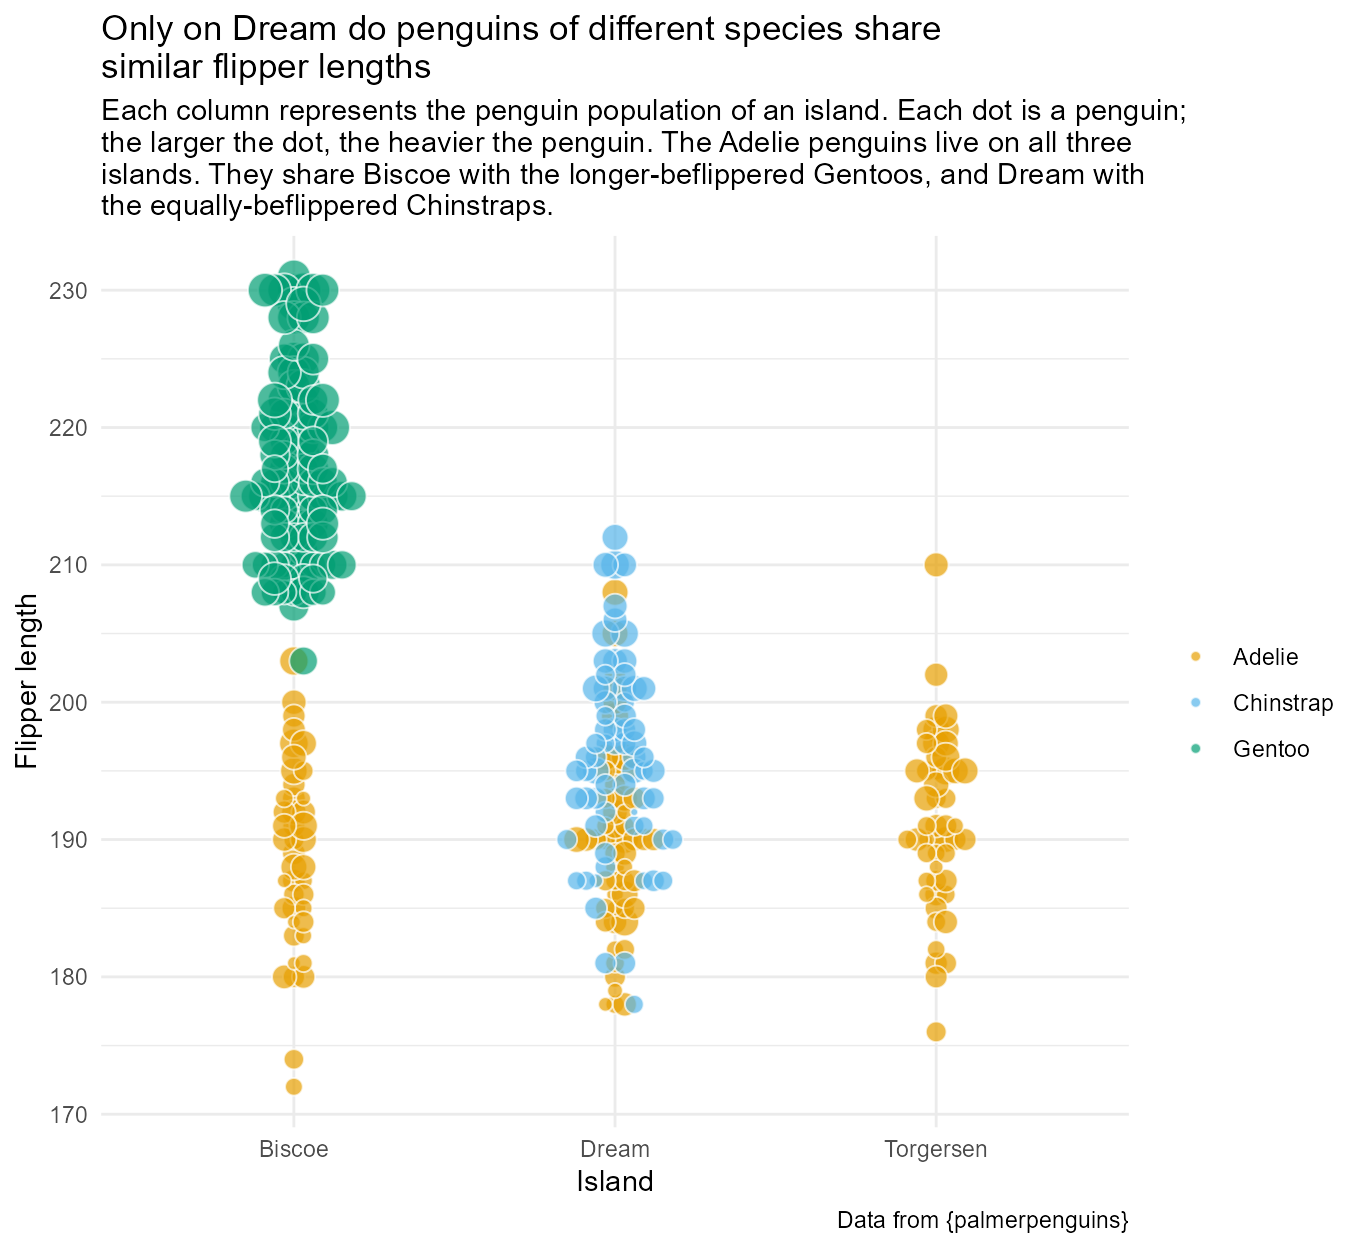
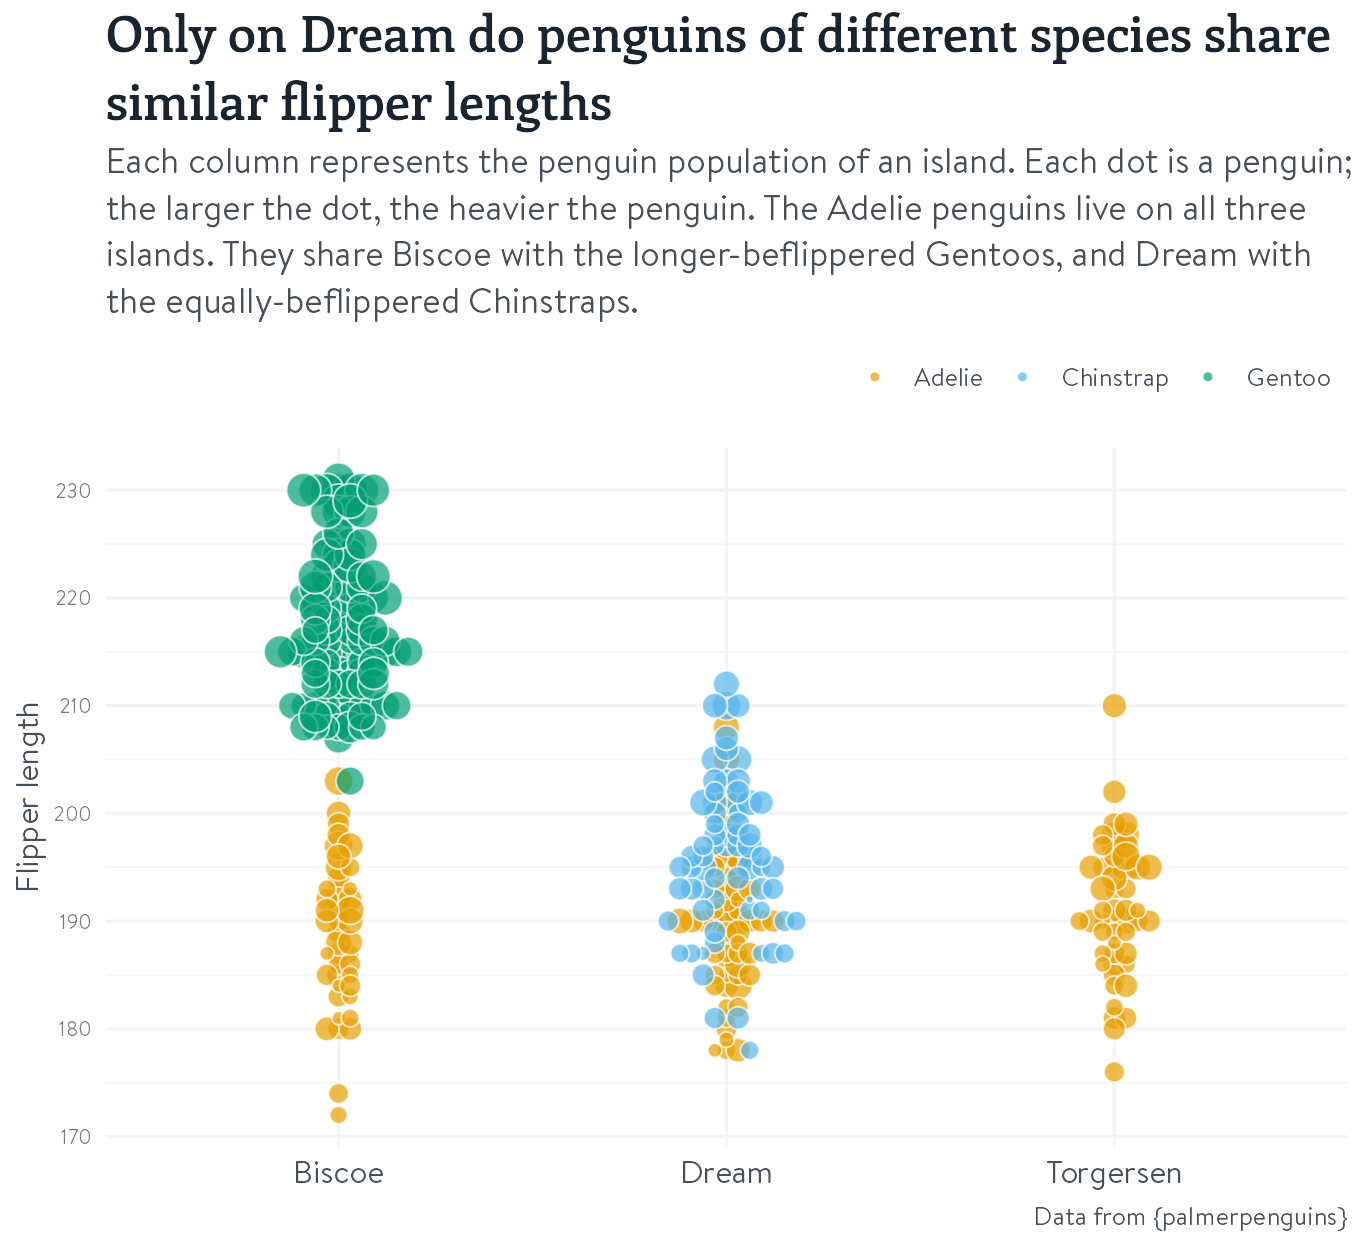
Remove clutter: grid lines
basic_plot +
  theme_minimal(base_size = 12) +
  theme(
    text = element_text(colour = mid_text,
                        family = "BrandonText"),
    plot.title = element_text(colour = dark_text,
                              family = "EnriquetaSB",
                              size = rel(1.6)),
    plot.subtitle = element_text(size = rel(1.1)),
    axis.text.y = element_text(colour = light_text,
                               size = rel(0.8)),
    axis.title.y = element_text(size = 12),
    axis.text.x = element_text(colour = mid_text,
                               size = 12),
    panel.grid = element_line(colour = "#F3F4F5"),
    plot.caption = element_text(size = rel(0.8))
  )
#2 - Give everything some space to breathe
Remove clutter: any unnecessary axis titles
basic_plot +
  theme_minimal(base_size = 12) +
  theme(
    text = element_text(colour = mid_text,
                        family = "BrandonText"),
    plot.title = element_text(colour = dark_text,
                              family = "EnriquetaSB",
                              size = rel(1.6)),
    plot.subtitle = element_text(size = rel(1.1)),
    axis.text.y = element_text(colour = light_text,
                               size = rel(0.8)),
    axis.title.y = element_text(size = 12),
    axis.text.x = element_text(colour = mid_text,
                               size = 12),
    axis.title.x = element_blank(),
    panel.grid = element_line(colour = "#F3F4F5"),
    plot.caption = element_text(size = rel(0.8))
  )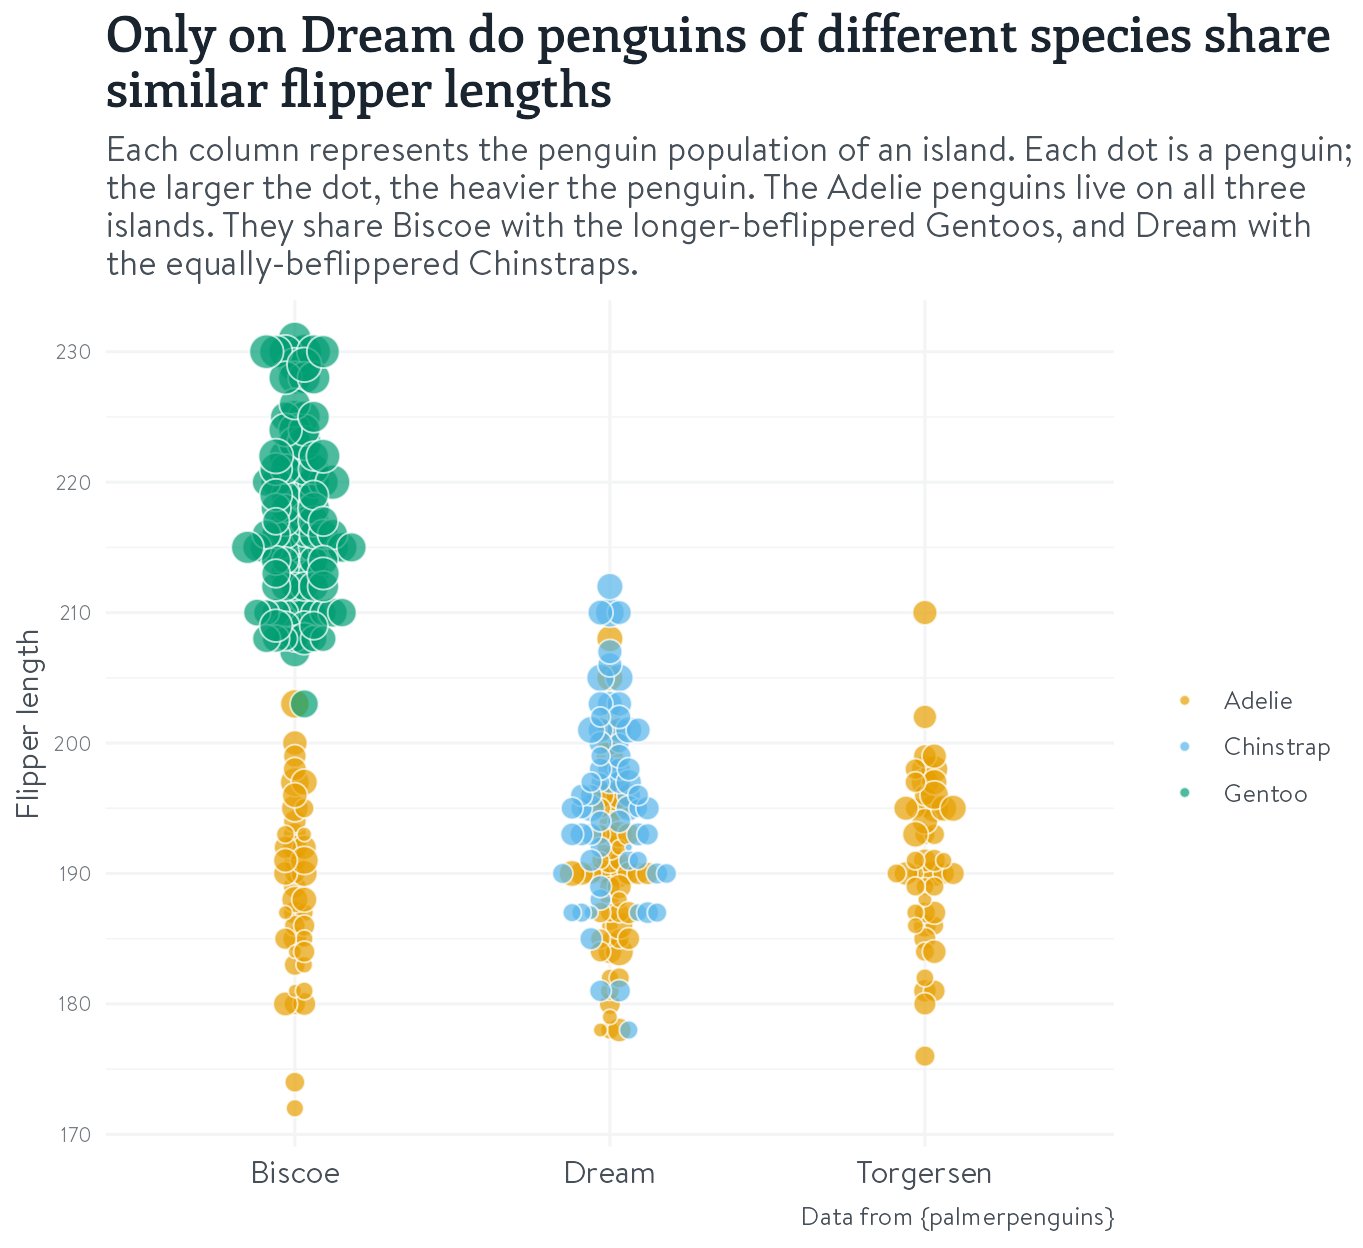
#2 - Give everything some space to breathe
Reduce eye movements
basic_plot +
  theme_minimal(base_size = 12) +
  theme(
    text = element_text(colour = mid_text,
                        family = "BrandonText"),
    plot.title = element_text(colour = dark_text,
                              family = "EnriquetaSB",
                              size = rel(1.6)),
    plot.subtitle = element_text(size = rel(1.1)),
    axis.text.y = element_text(colour = light_text,
                               size = rel(0.8)),
    axis.title.y = element_text(size = 12),
    axis.text.x = element_text(colour = mid_text,
                               size = 12),
    axis.title.x = element_blank(),
    panel.grid = element_line(colour = "#F3F4F5"),
    legend.position = "top",
    legend.justification = 1,
    plot.caption = element_text(size = rel(0.8))
  )
#2 - Give everything some space to breathe
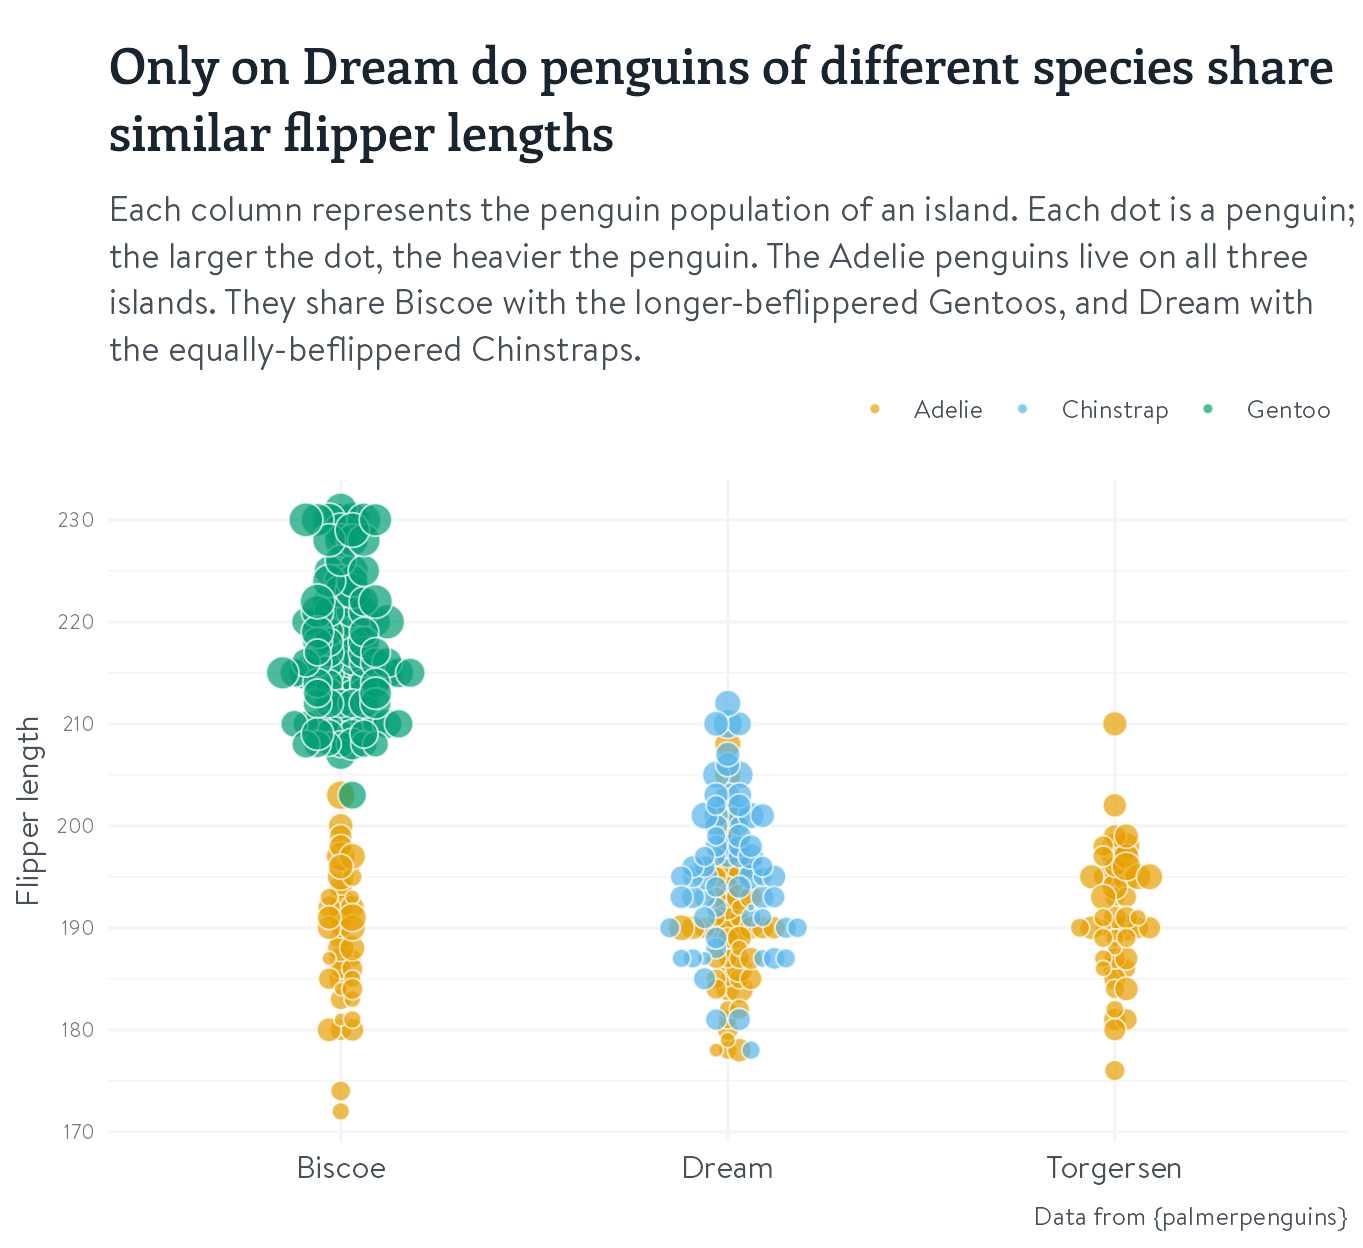
Add breathing space - line height
basic_plot +
  theme_minimal(base_size = 12) +
  theme(
    text = element_text(colour = mid_text,
                        family = "BrandonText",
                        lineheight = 1.1),
    plot.title = element_text(colour = dark_text,
                              family = "EnriquetaSB",
                              size = rel(1.6)),
    plot.subtitle = element_text(size = rel(1.1)),
    axis.text.y = element_text(colour = light_text,
                               size = rel(0.8)),
    axis.title.y = element_text(size = 12),
    axis.text.x = element_text(colour = mid_text,
                               size = 12),
    axis.title.x = element_blank(),
    panel.grid = element_line(colour = "#F3F4F5"),
    legend.position = "top",
    legend.justification = 1,
    plot.caption = element_text(size = rel(0.8))
  )
#2 - Give everything some space to breathe
Add breathing space - margins around text items (TRouBLe)
basic_plot +
  theme_minimal(base_size = 12) +
  theme(
    text = element_text(colour = mid_text,
                        family = "BrandonText",
                        lineheight = 1.1),
    plot.title = element_text(colour = dark_text,
                              family = "EnriquetaSB",
                              size = rel(1.6),
                              margin = margin(12, 0, 8, 0)),
    plot.subtitle = element_text(size = rel(1.1),
                                 margin = margin(4, 0, 0, 0)),
    axis.text.y = element_text(colour = light_text,
                               size = rel(0.8)),
    axis.title.y = element_text(size = 12,
                                margin = margin(0, 4, 0, 0)),
    axis.text.x = element_text(colour = mid_text,
                               size = 12),
    axis.title.x = element_blank(),
    panel.grid = element_line(colour = "#F3F4F5"),
    legend.position = "top",
    legend.justification = 1,
    plot.caption = element_text(size = rel(0.8),
                                margin = margin(8, 0, 0, 0))
  )
#2 - Give everything some space to breathe
Add breathing space - margins around the plot (TRouBLe)
basic_plot +
  theme_minimal(base_size = 12) +
  theme(
    text = element_text(colour = mid_text,
                        family = "BrandonText",
                        lineheight = 1.1),
    plot.title = element_text(colour = dark_text,
                              family = "EnriquetaSB",
                              size = rel(1.6),
                              margin = margin(12, 0, 8, 0)),
    plot.subtitle = element_text(size = rel(1.1),
                                 margin = margin(4, 0, 0, 0)),
    axis.text.y = element_text(colour = light_text,
                               size = rel(0.8)),
    axis.title.y = element_text(size = 12,
                                margin = margin(0, 4, 0, 0)),
    axis.text.x = element_text(colour = mid_text,
                               size = 12),
    axis.title.x = element_blank(),
    panel.grid = element_line(colour = "#F3F4F5"),
    legend.position = "top",
    legend.justification = 1,
    plot.caption = element_text(size = rel(0.8),
                                margin = margin(8, 0, 0, 0)),
    plot.margin = margin(0.25, 0.25,
                         0.25, 0.25,
                         "cm")
  )
#2 - Give everything some space to breathe
Add breathing space - adjust text size (🙏 rel()!)
basic_plot +
  theme_minimal(base_size = 11) +
  theme(
    text = element_text(colour = mid_text,
                        family = "BrandonText",
                        lineheight = 1.1),
    plot.title = element_text(colour = dark_text,
                              family = "EnriquetaSB",
                              size = rel(1.6),
                              margin = margin(12, 0, 8, 0)),
    plot.subtitle = element_text(size = rel(1.1),
                                 margin = margin(4, 0, 0, 0)),
    axis.text.y = element_text(colour = light_text,
                               size = rel(0.8)),
    axis.title.y = element_text(size = 12,
                                margin = margin(0, 4, 0, 0)),
    axis.text.x = element_text(colour = mid_text,
                               size = 12),
    axis.title.x = element_blank(),
    panel.grid = element_line(colour = "#F3F4F5"),
    legend.position = "top",
    legend.justification = 1,
    plot.caption = element_text(size = rel(0.8),
                                margin = margin(8, 0, 0, 0)),
    plot.margin = margin(0.25, 0.25, 0.25, 0.25, "cm")
  )
#2 - Give everything some space to breathe

#3 - Create aesthetic consistency
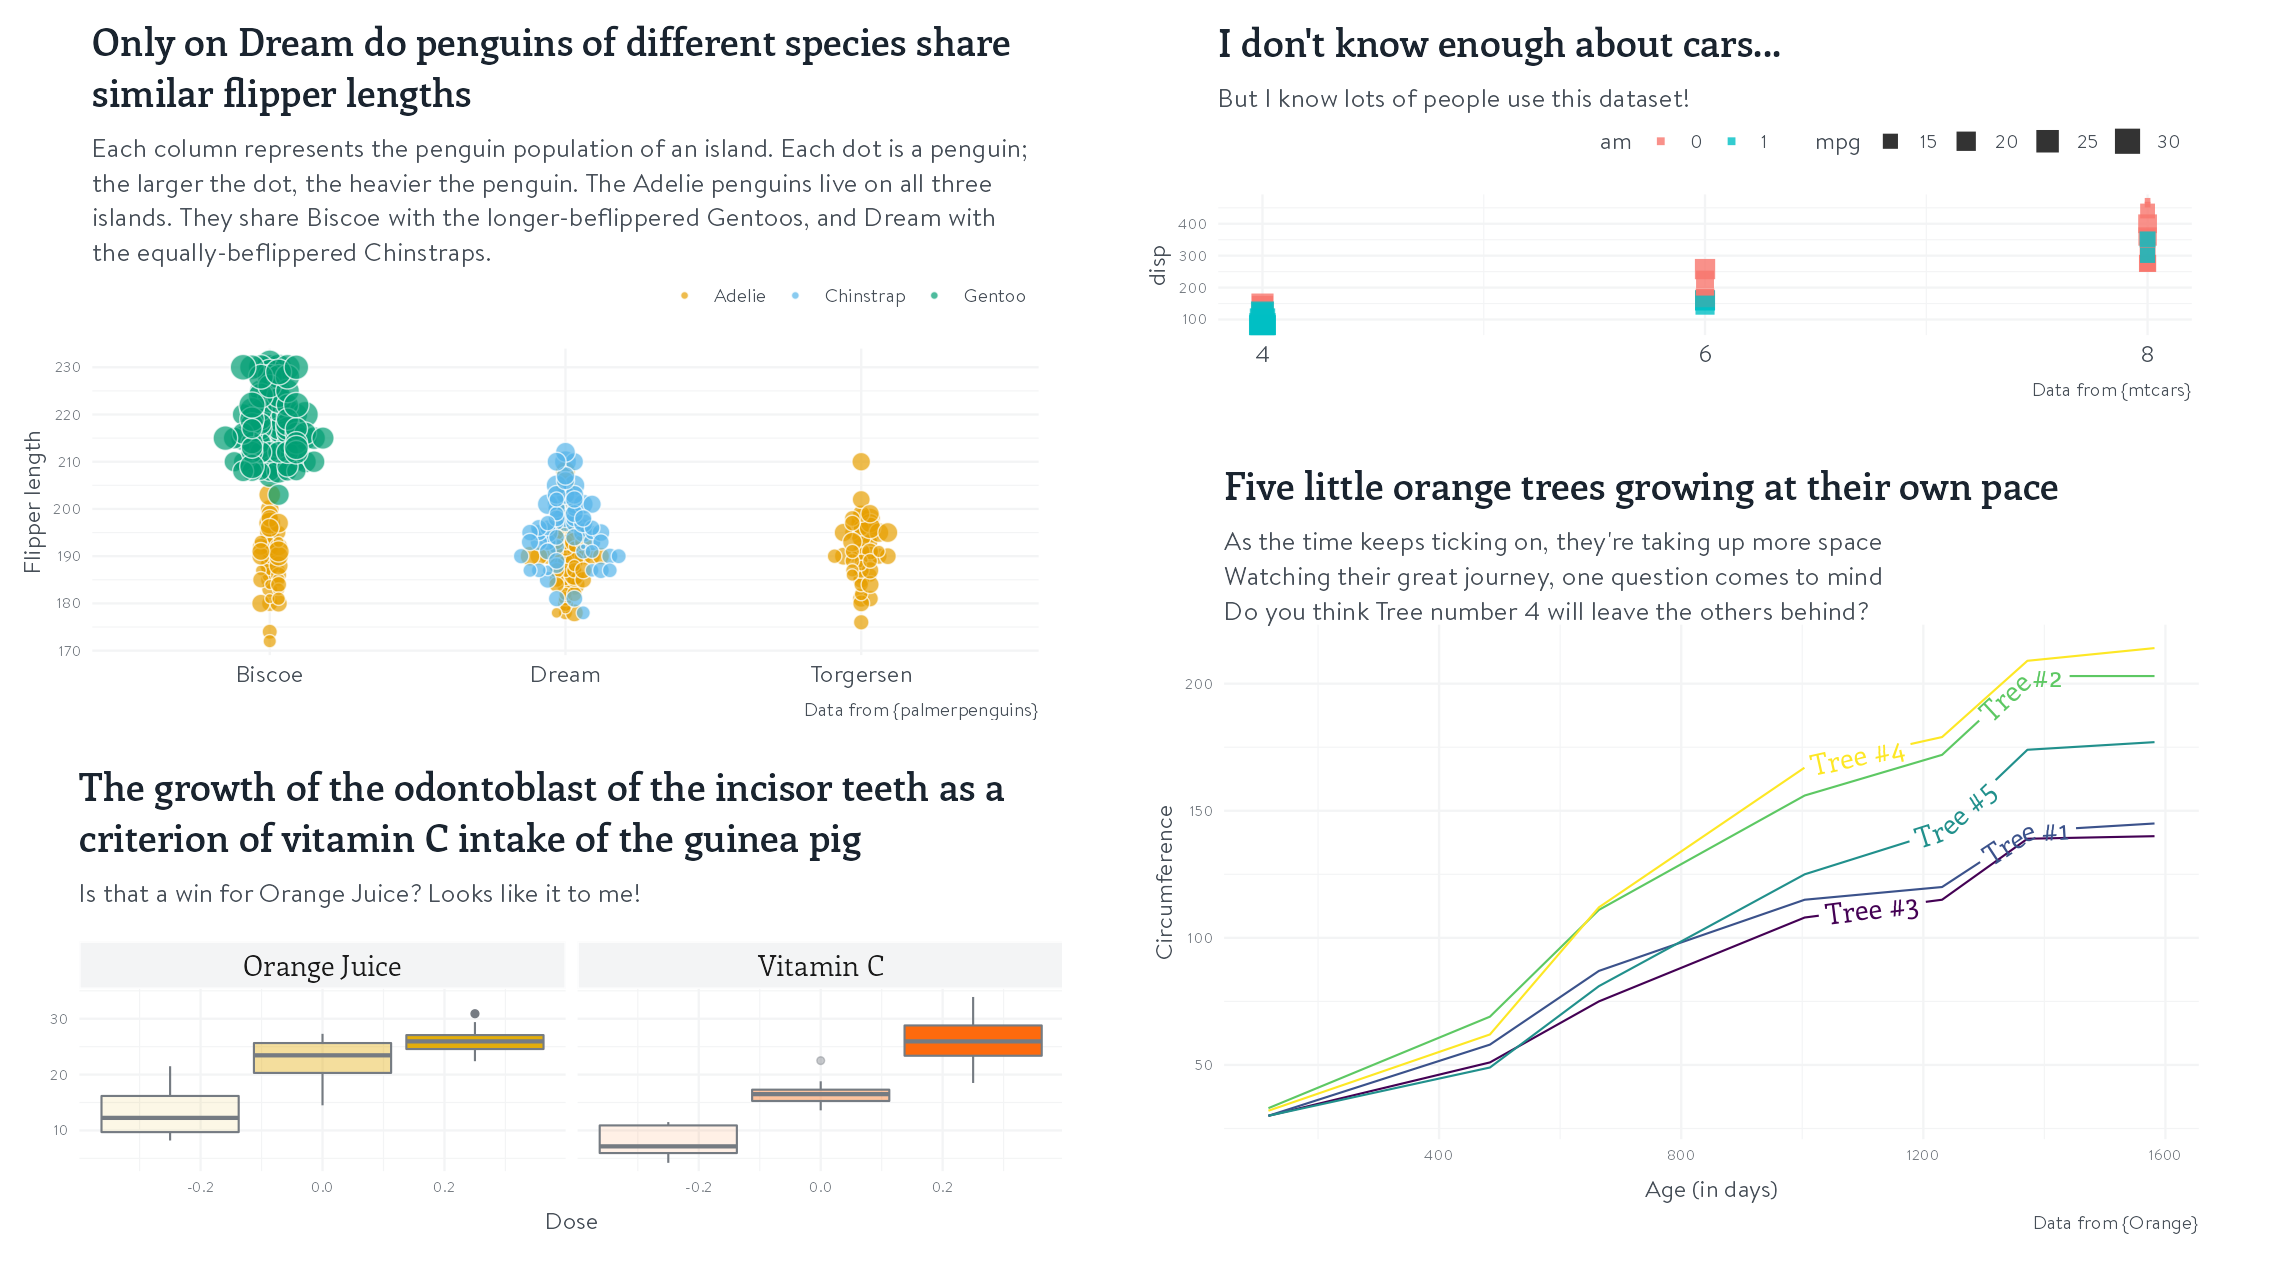
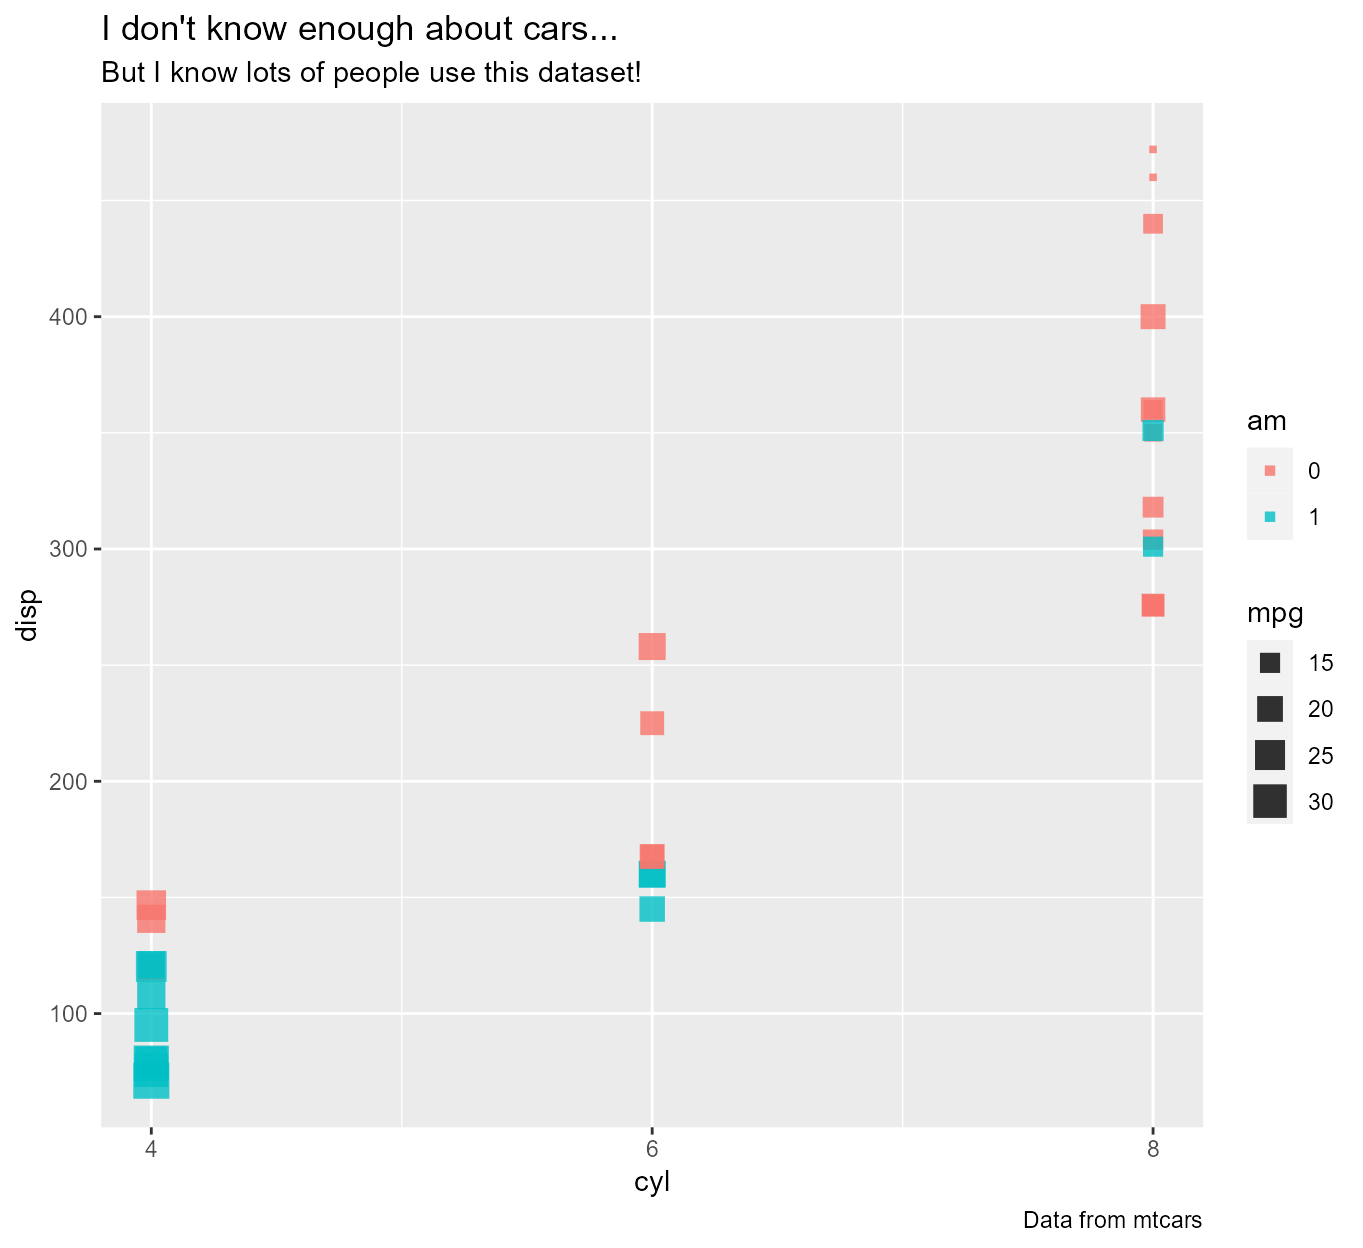
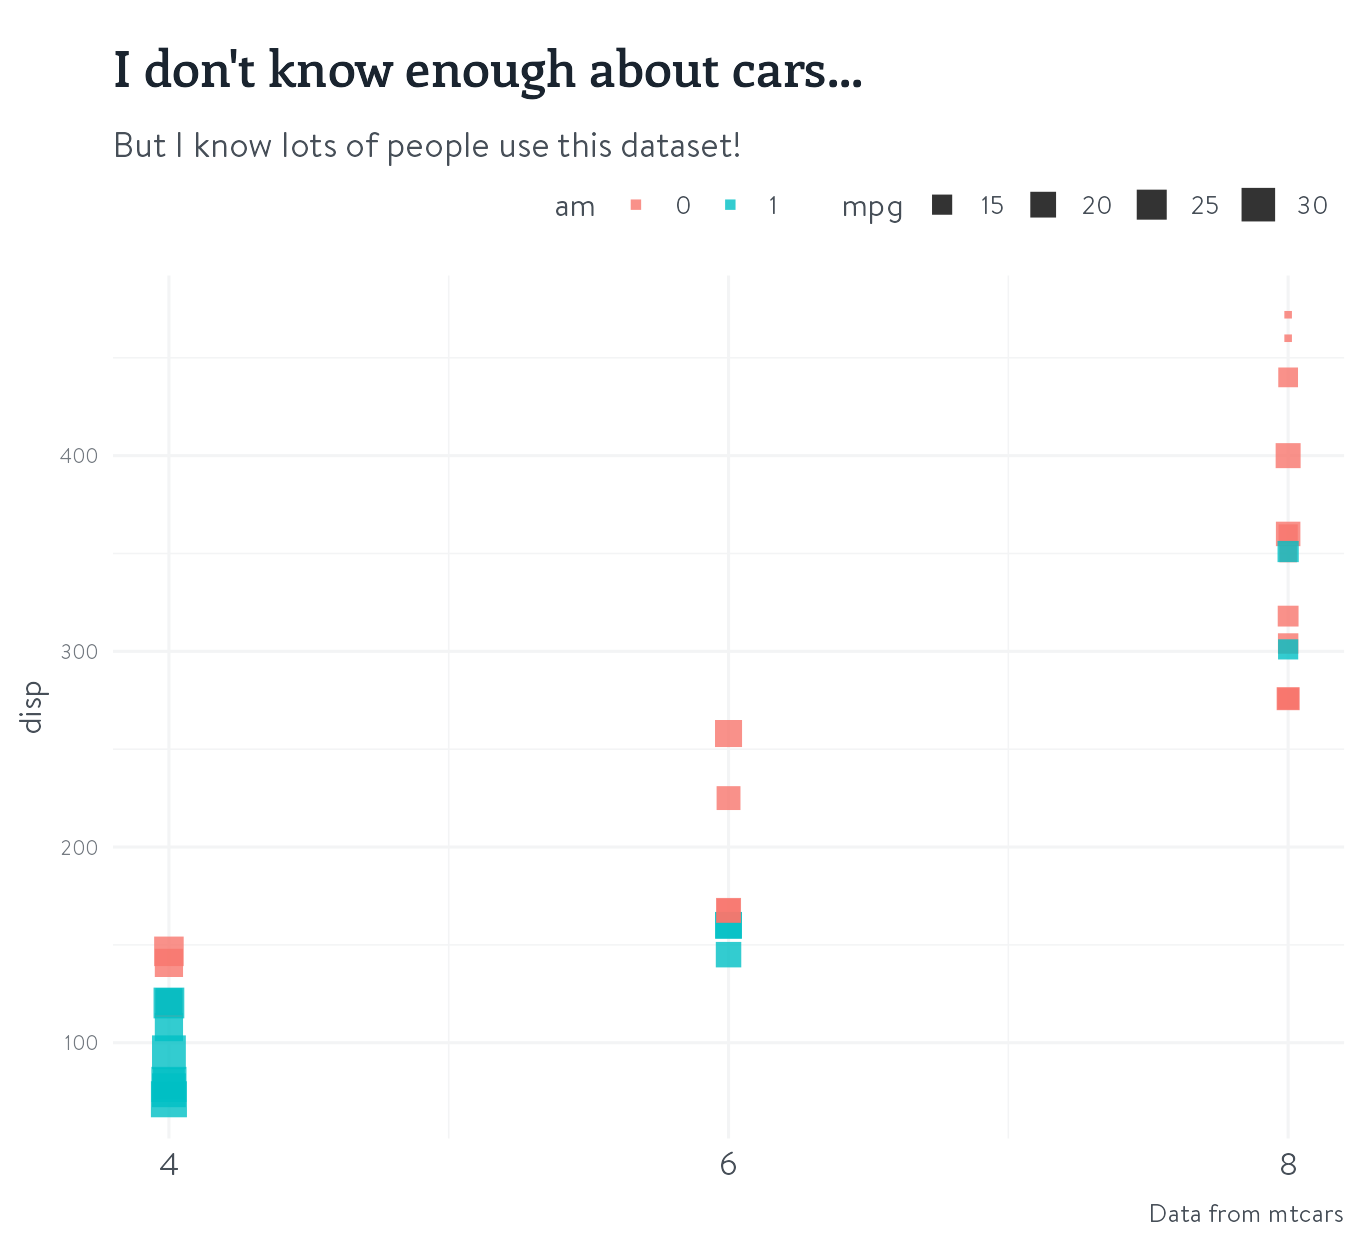
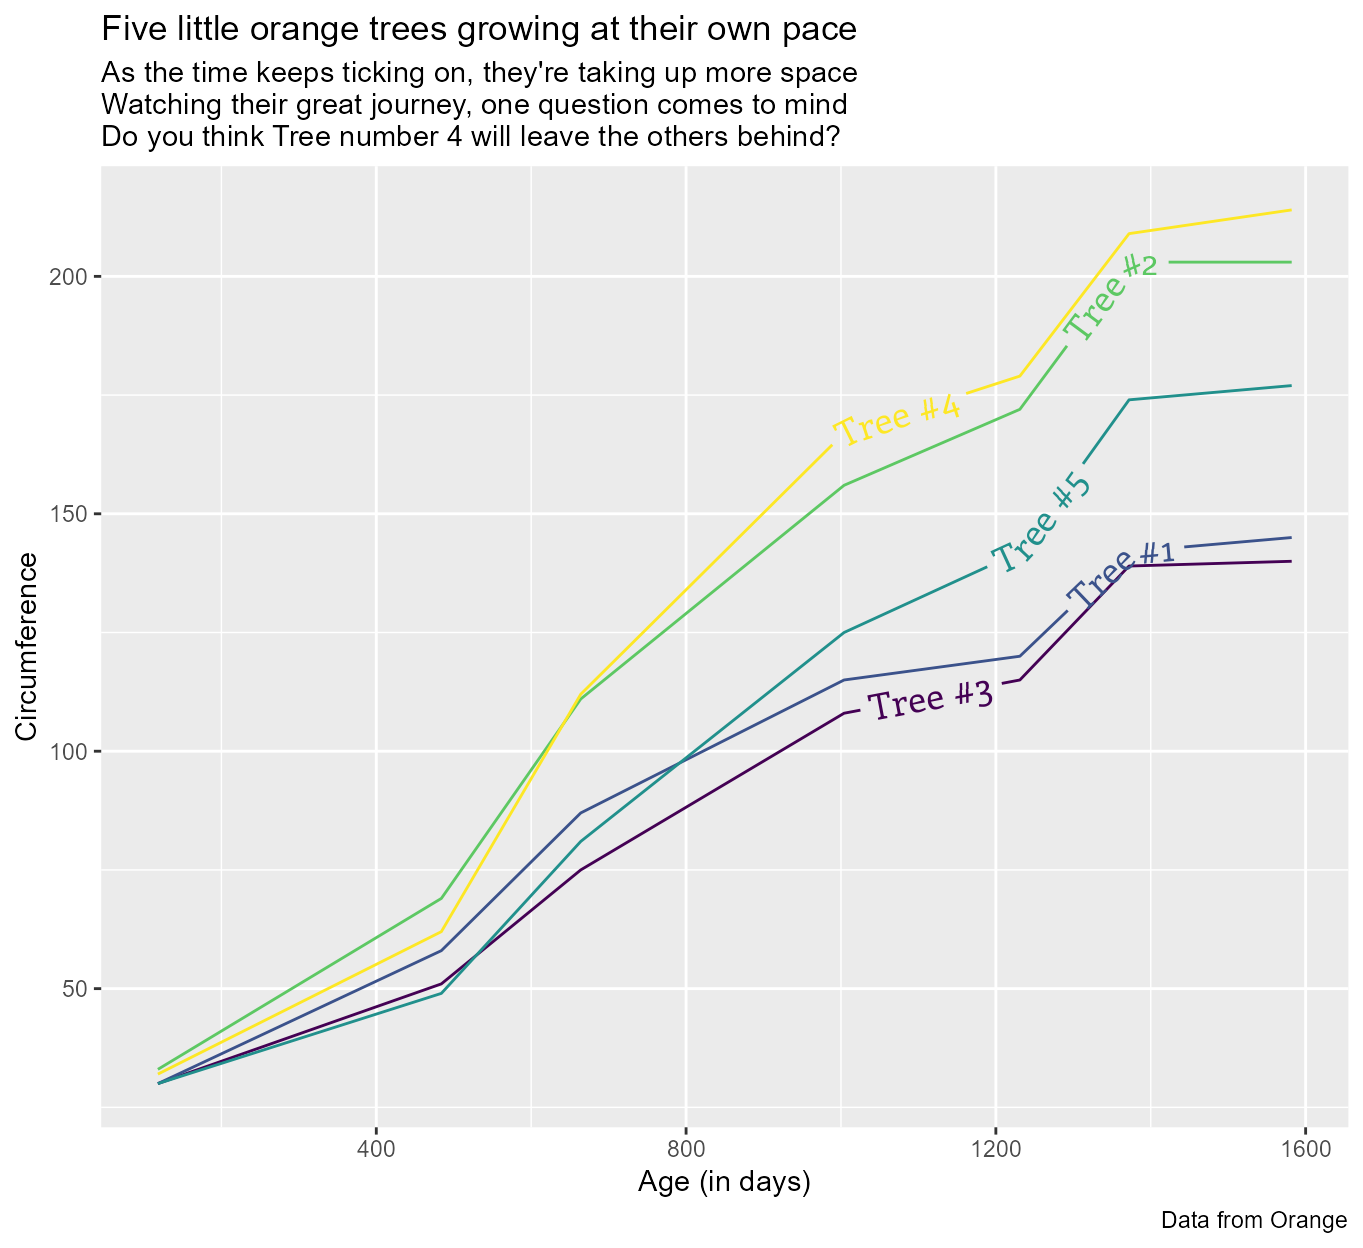
Apply it to any plot you like! 📦{datasets}
#3 - Create aesthetic consistency
Apply it to any plot you like! 📦{datasets}
#3 - Create aesthetic consistency
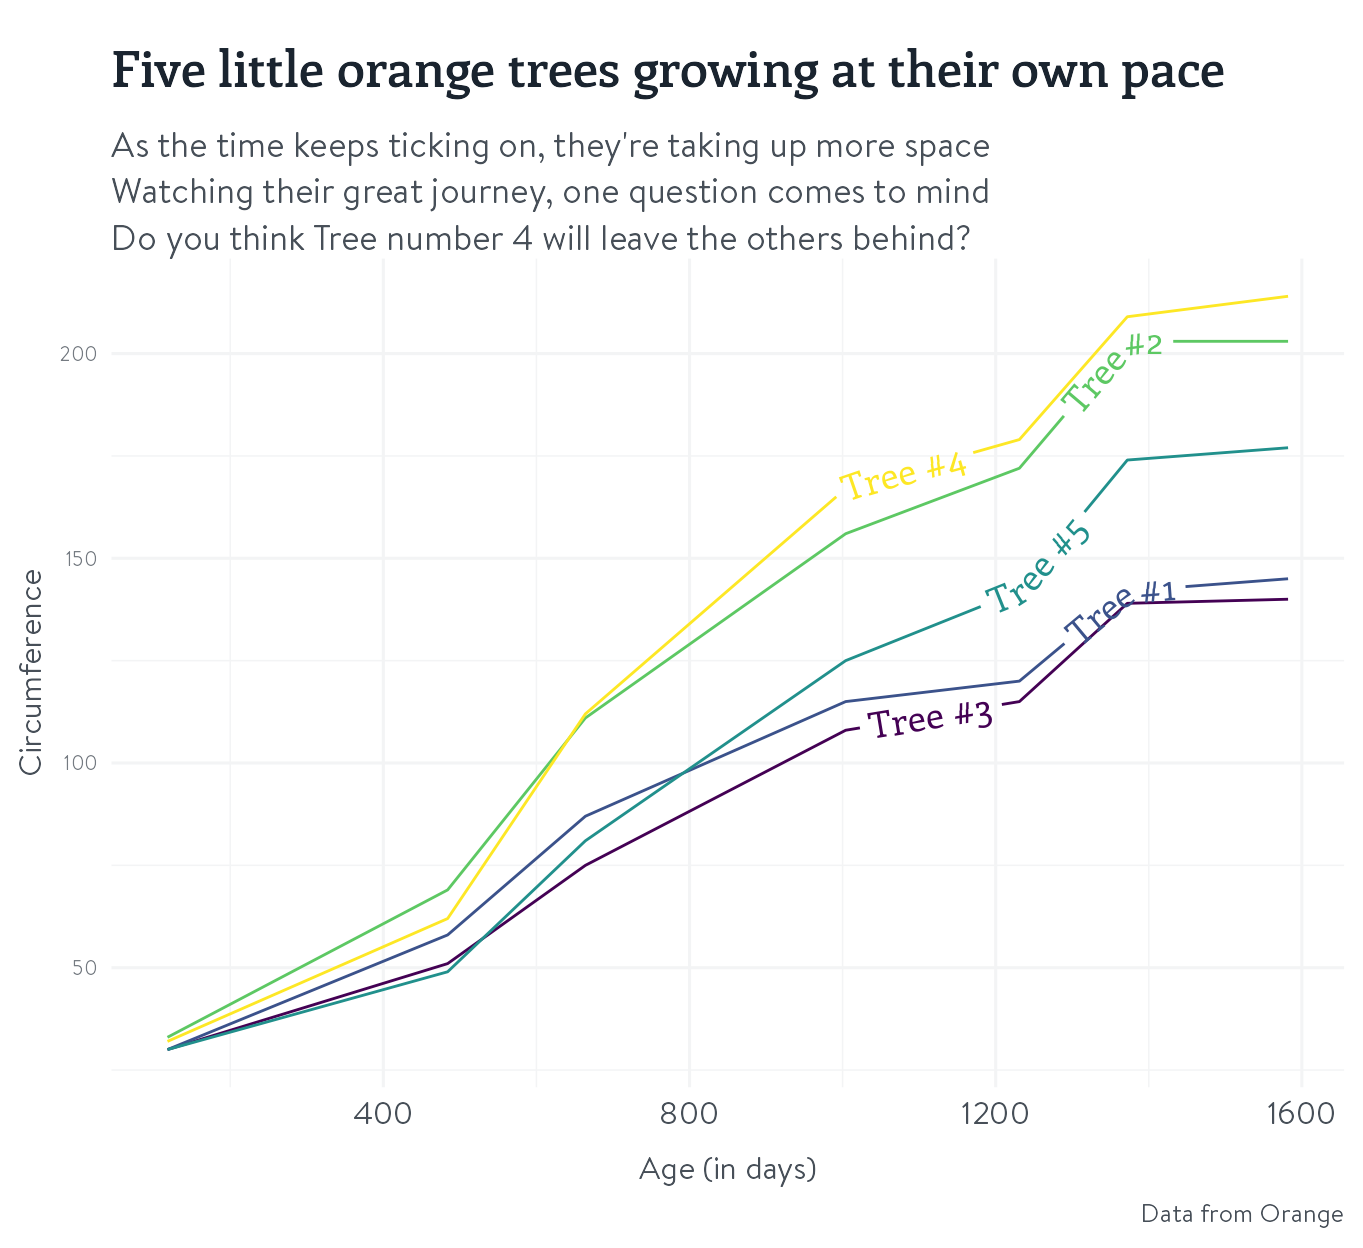
📦 {geomtextpath}
#3 - Create aesthetic consistency
📦 {geomtextpath}

#3 - Create aesthetic consistency
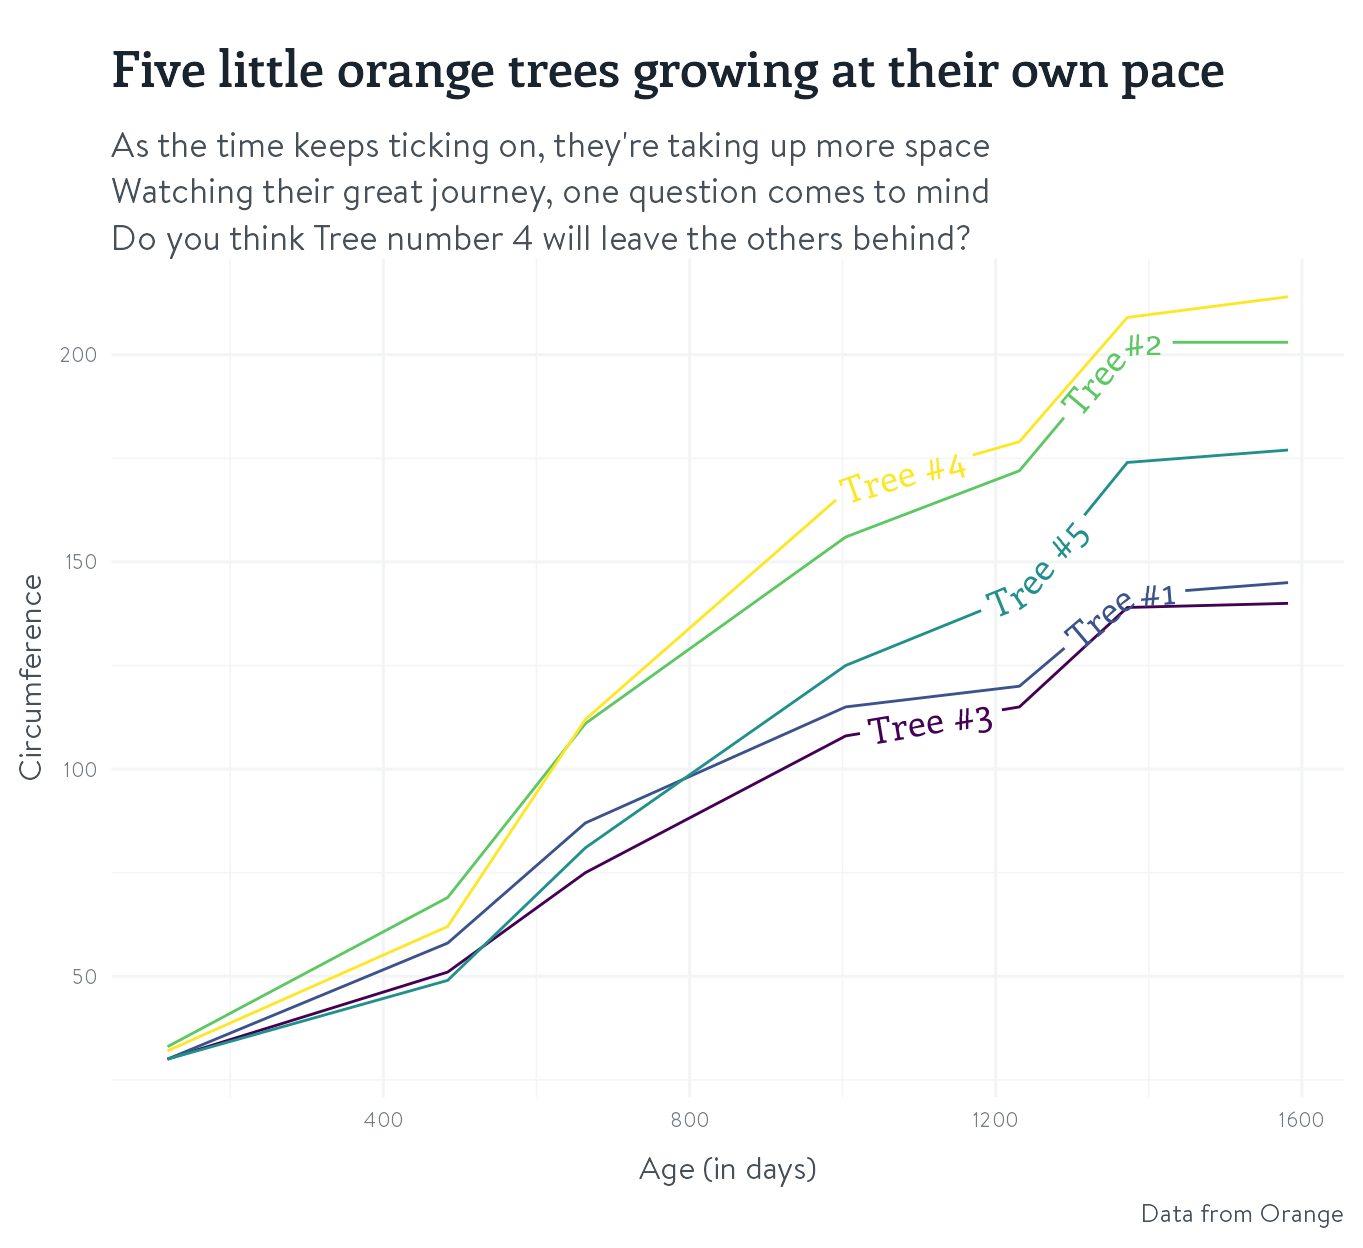
There’s still room for further modifications if you want to make them!
#3 - Create aesthetic consistency
There’s still room for further modifications if you want to make them!
#3 - Create aesthetic consistency
There’s still room for further modifications if you want to make them!

#3 - Create aesthetic consistency
There’s still room for further modifications if you want to make them!
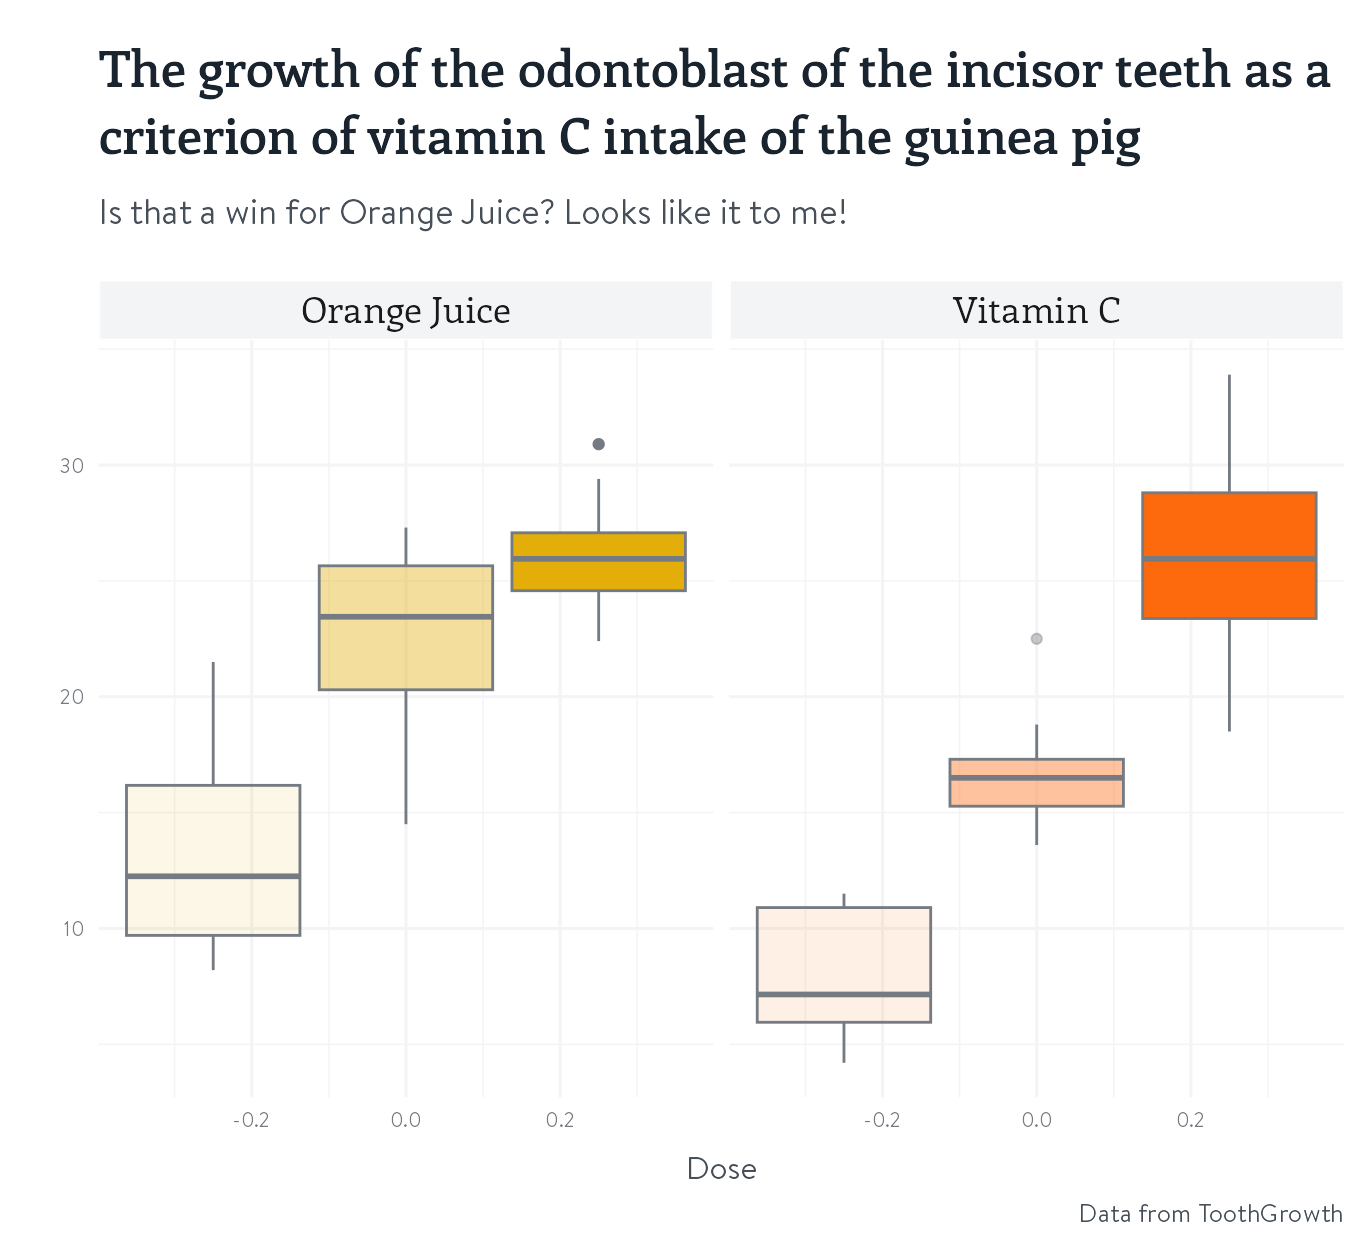
ToothGrowth_plot +
  theme_nhsr_demo() +
  theme(
    axis.text.x = element_text(colour = light_text, size = rel(0.8)),
    axis.title.x = element_text(margin = margin(8, 0, 0, 0)),
    strip.background = element_rect(fill = "#F3F4F5", color = "#FFFFFF"),
    strip.text = element_text(family = "Enriqueta", size = 14)
  )
#3 - Create aesthetic consistency
All in the interest of effortless consistency - R for the Rest of Us
#3 - Create aesthetic consistency
All in the interest of effortless consistency - Misc + theme_nhsr_demo()